Analyze Excel & Spreadsheets Data with AI

Turn your Spreadsheets or Excel data into clear answers and results you can edit and share. Just upload your spreadsheet, describe your task, and let Kimi Sheets generate the formulas, pivot tables, charts, and reports you need.

Clean, analyze, and report on your excel data with AI

Automate & simplify spreadsheet analysis with AI

Kimi Sheets compares regions, products, and time periods to answer your business questions. See where revenue grew, which products contributed most to sales, or how performance changed, with supporting figures and tables.
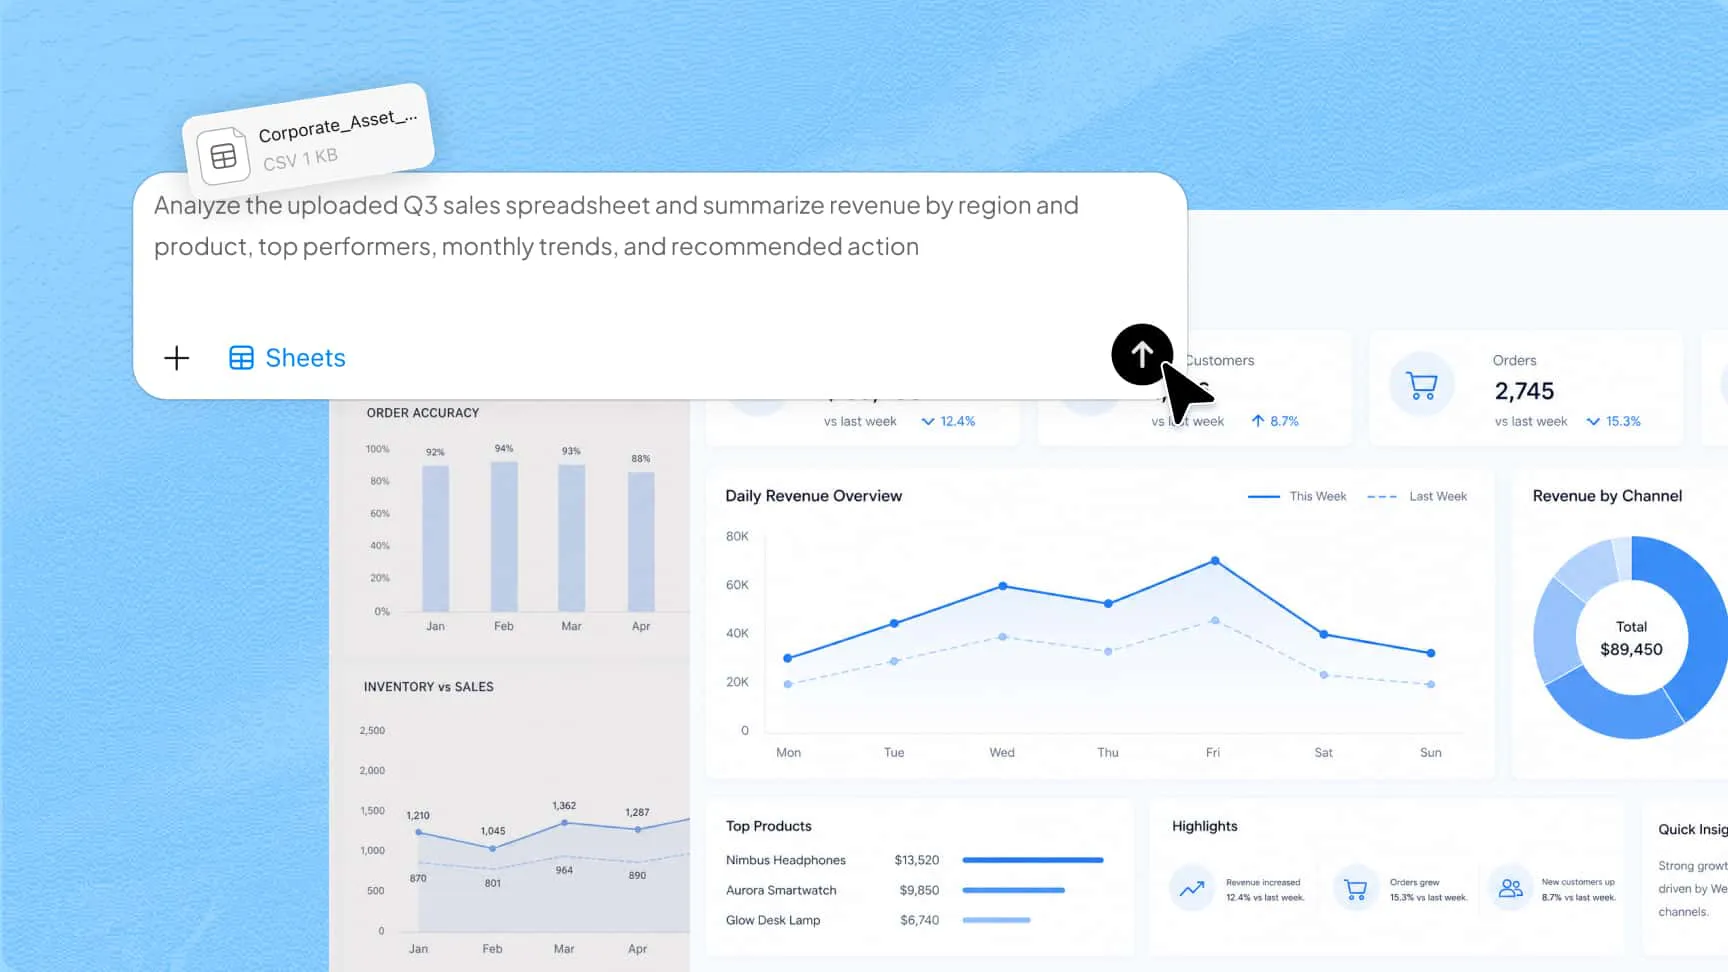
Kimi Sheets uses AI to analyze Excel data from a Q3 sales spreadsheet and display sales trends, regional comparisons, and product performance.

Clean and organize data

The AI Excel data analysis tool removes duplicate rows and standardizes date, text, and number formats based on your instructions. It can handle issues such as inconsistent product names or mixed date formats.
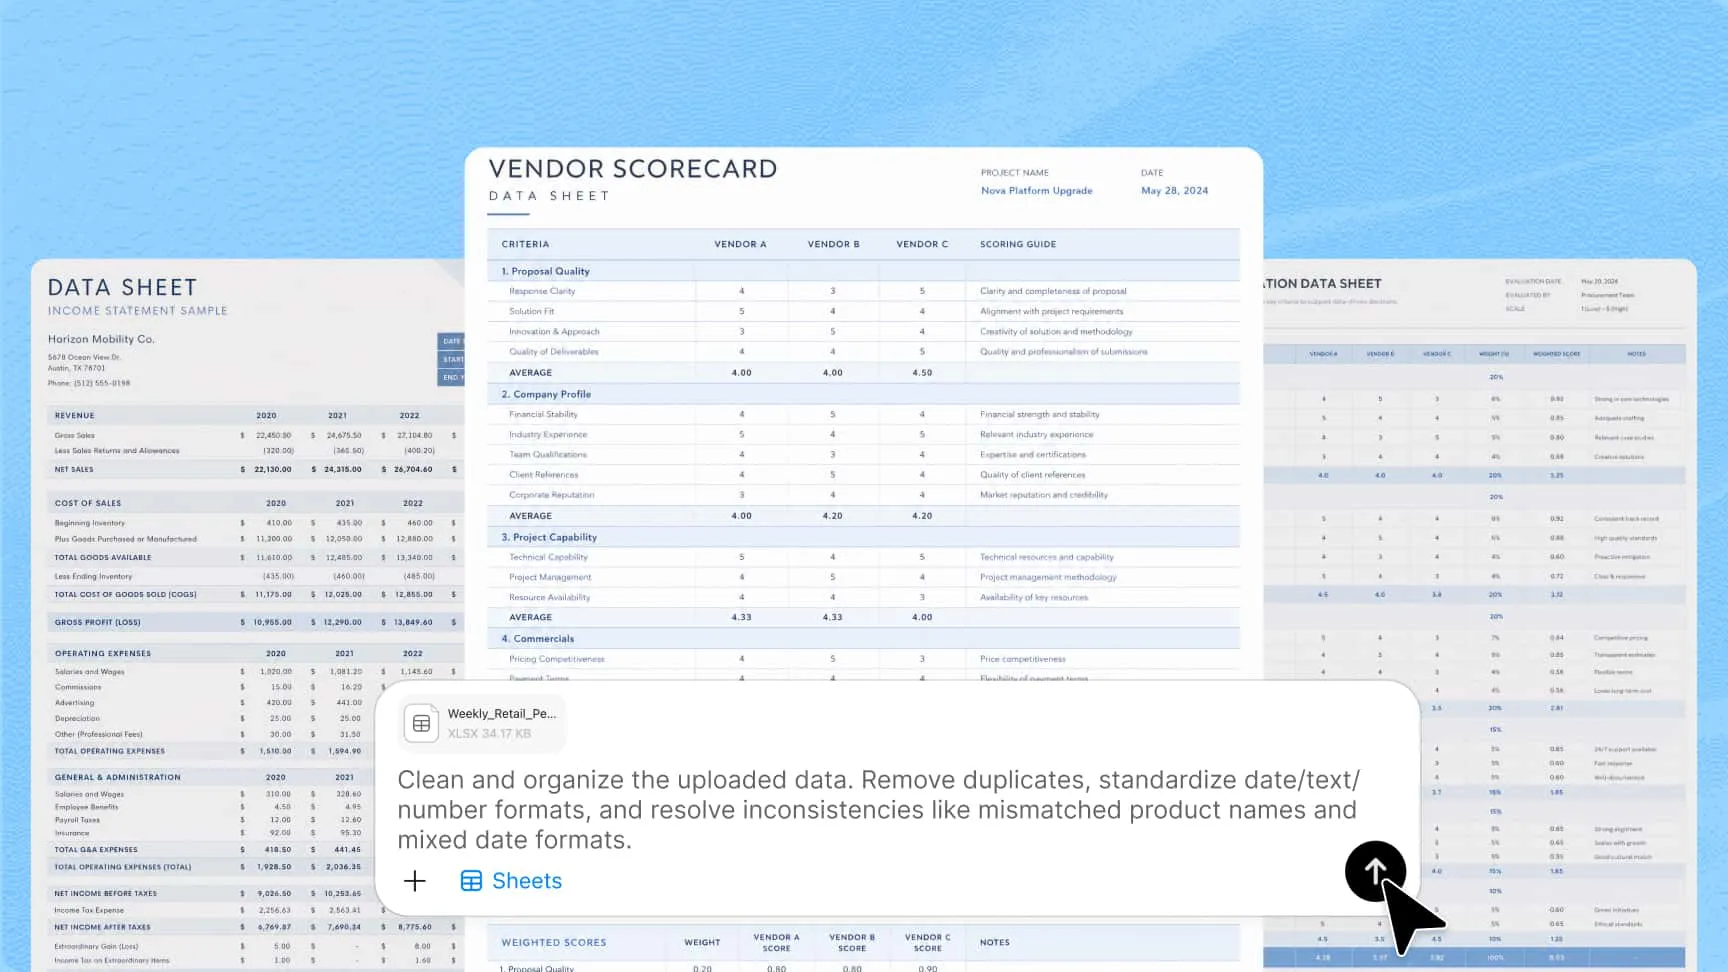
AI Excel analysis in Kimi Sheets, with a prompt to remove duplicates and standardize formats alongside cleaned data tables.

Generate ready-to-use formulas and pivot tables

Kimi Sheets creates Excel formulas and pivot tables for calculations and summaries, such as profit margin, month-over-month growth, or total sales by region. You can review and edit them in Excel.
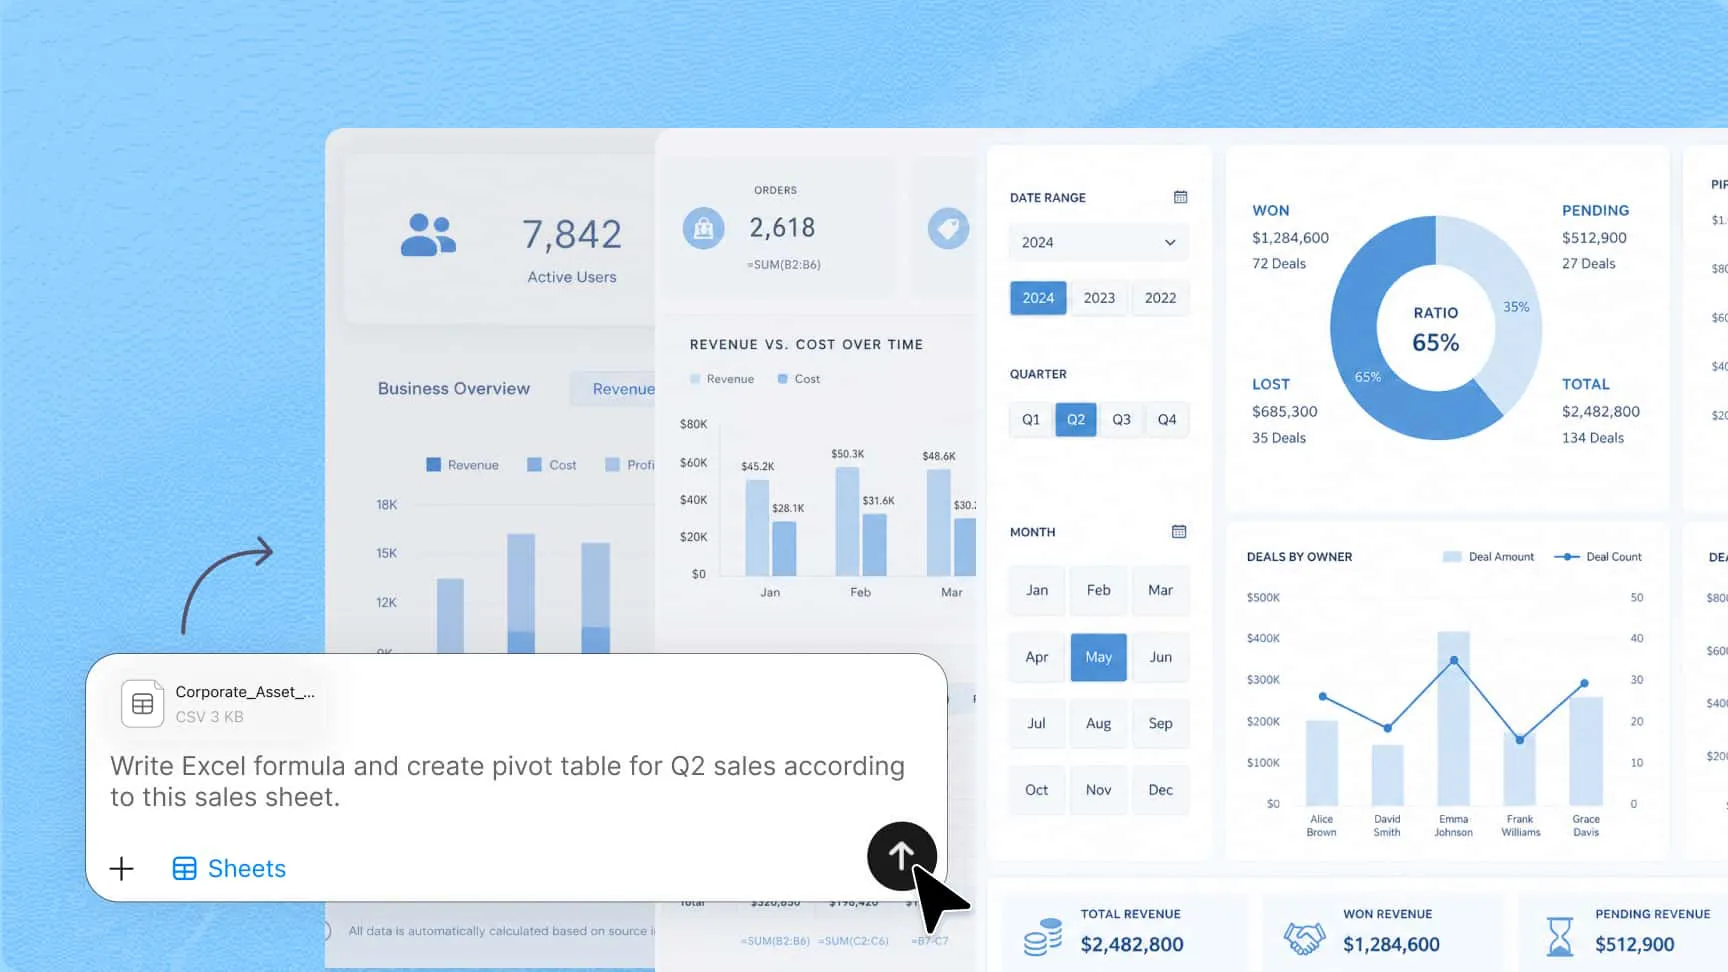
Kimi Sheets AI for Excel analysis, showing a request for Q3 sales formulas and pivot tables alongside spreadsheet summaries and charts.

Create charts and reports

Kimi Sheets creates charts to compare categories or track changes over time. It combines charts, tables, and written summaries into reports you can export as PDF, Word, or PowerPoint files.
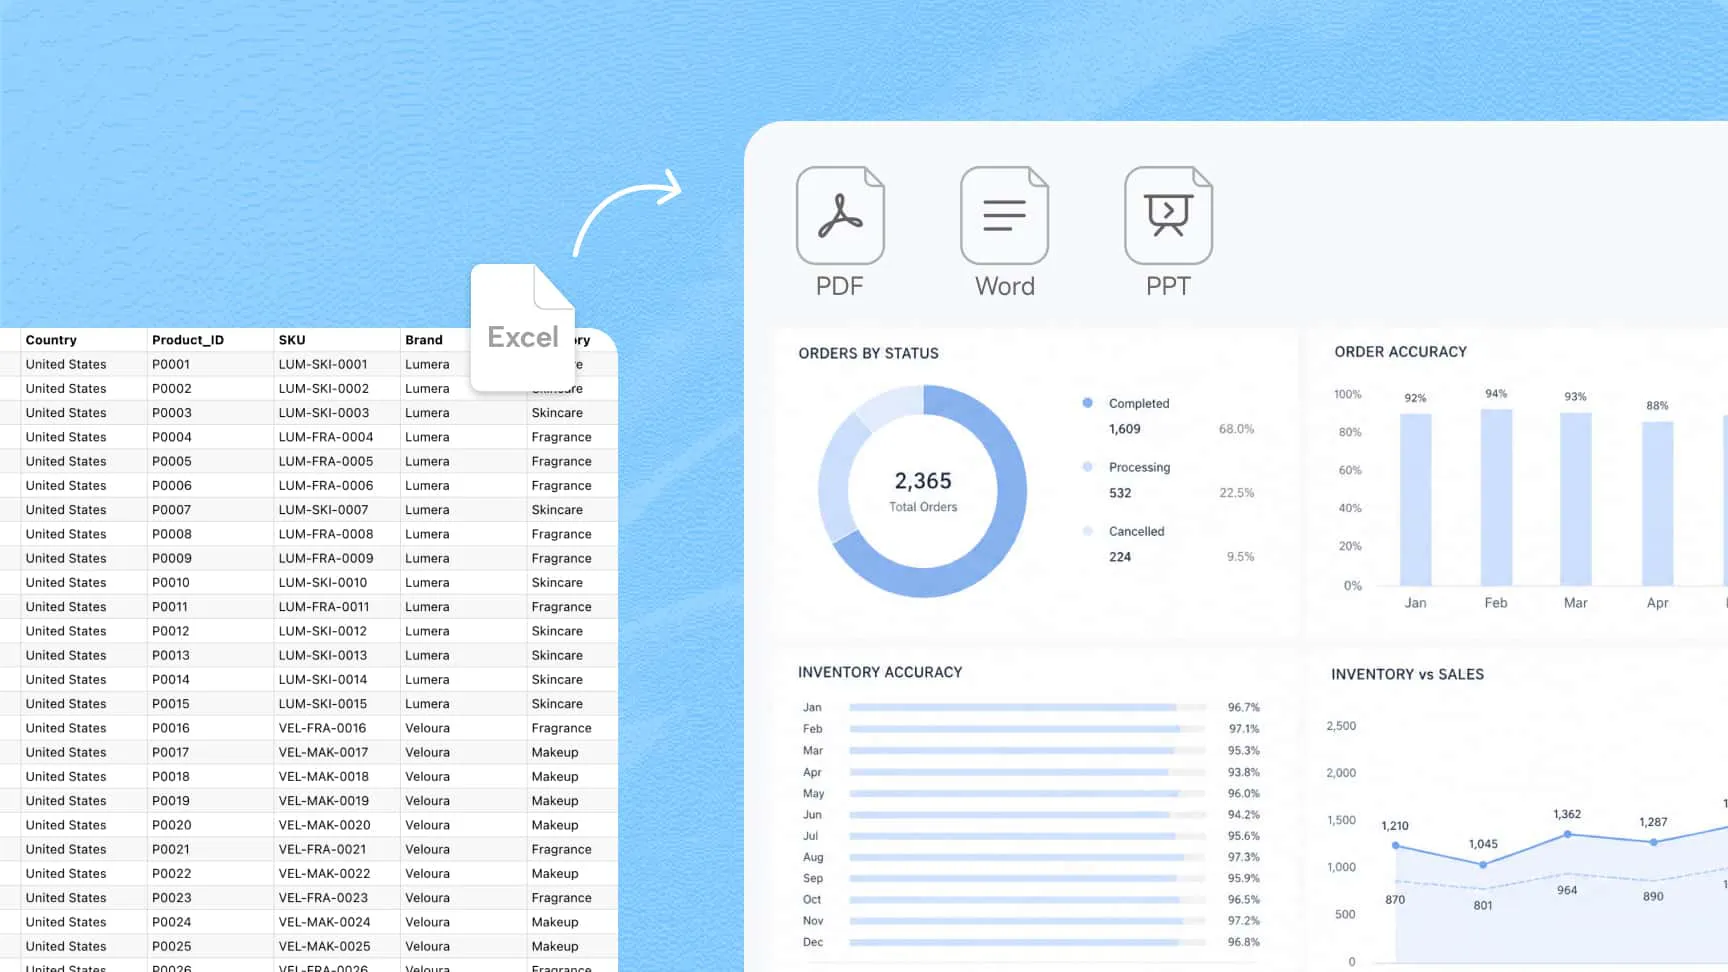
Excel AI analysis workflow turning spreadsheet data into charts and reports, with PDF, Word, and PPT export options.

A simpler, smarter way to analyze Excel data

Traditional Excel analysisSmarter analysis with Kimi Sheets
Ease of useRequire learning Excel formulas, pivot table settings, and chart controlsRequire only a plain-language description of the task
EfficiencySet up calculations, summaries, and charts manuallyGenerate calculations, summaries, and charts from one request
AccuracyManual formula entry can introduce syntax and reference errorsReduce manual formula entry, with editable calculations you can check
Data handling capacityLarge, formula-heavy workbooks can become slow to calculate and difficult to manageAnalyze spreadsheets with thousands of rows and multiple columns in a single task

90%

time saved on Excel data analysis

0

Excel formulas to write manually

5+

Output formats for editing and sharing

AI tools for Excel analysis in everyday work

Two colleagues reviewing a laptop together, illustrating sales performance reviews supported by AI Excel data analysis.

Sales performance analysis

Track sales performance, identify revenue trends, and evaluate team results with Kimi Sheets. Turn raw sales data into actionable insights with AI Excel data analysis, helping managers refine strategies, forecast performance, and drive business growth.

Marketing colleagues discussing work around a computer, illustrating the use of AI tools for Excel data analysis in campaign reviews.

Marketing campaign analysis

Measure campaign performance by analyzing engagement, conversions, and ROI in one place. Kimi Sheets consolidates data from multiple sources and highlights the metrics that matter, making it easier to optimize campaigns with confidence.

Two colleagues working at a laptop, illustrating financial reporting with an AI tool to analyze Excel data.

Financial reporting

Automate financial calculations, summaries, and forecasts with Kimi's AI Excel data analysis tool. Generate accurate, presentation-ready reports while reducing manual work and minimizing reporting errors.

A presenter speaking to a seated group, illustrating the sharing of customer behavior insights from AI Excel analysis.

Customer behavior analysis

Discover buying patterns, customer preferences, and emerging trends across your data. Kimi Sheets transforms complex spreadsheets into clear insights that support better marketing, sales, and customer engagement strategies.

Two colleagues reviewing a laptop, illustrating inventory planning supported by AI tools to analyze Excel data.

Inventory management

Monitor inventory levels, reorder points, and supply trends with AI for Excel analysis. Stay on top of stock movements, reduce manual tracking, and avoid shortages or unnecessary overstock.

A teacher leading a classroom discussion, illustrating educational insights supported by AI for Excel analysis.

Educational insights

Analyze grades, attendance, assessment results, and other academic data with ease. Kimi Sheets helps educators and researchers uncover trends faster, making it easier to support data-driven decisions and improve learning outcomes.

Analyze Excel data with AI in 3 simple steps

1

Step 1: Upload & describe your task

Upload your Excel file and describe what you want to analyze in plain language. Kimi Sheets understands your request, organizes the data, and prepares it for analysis automatically.

2

Step 2: Analyze instantly

Within minutes, Kimi Sheets analyzes your spreadsheet and highlights key patterns, trends, and anomalies. Skip manual formulas and repetitive work, and move straight to the insights that matter.

3

Step 3: Export & share results

Export your results as neatly formatted reports, complete with charts, tables, and summaries. Share them with your team or use them directly in presentations and business reports.
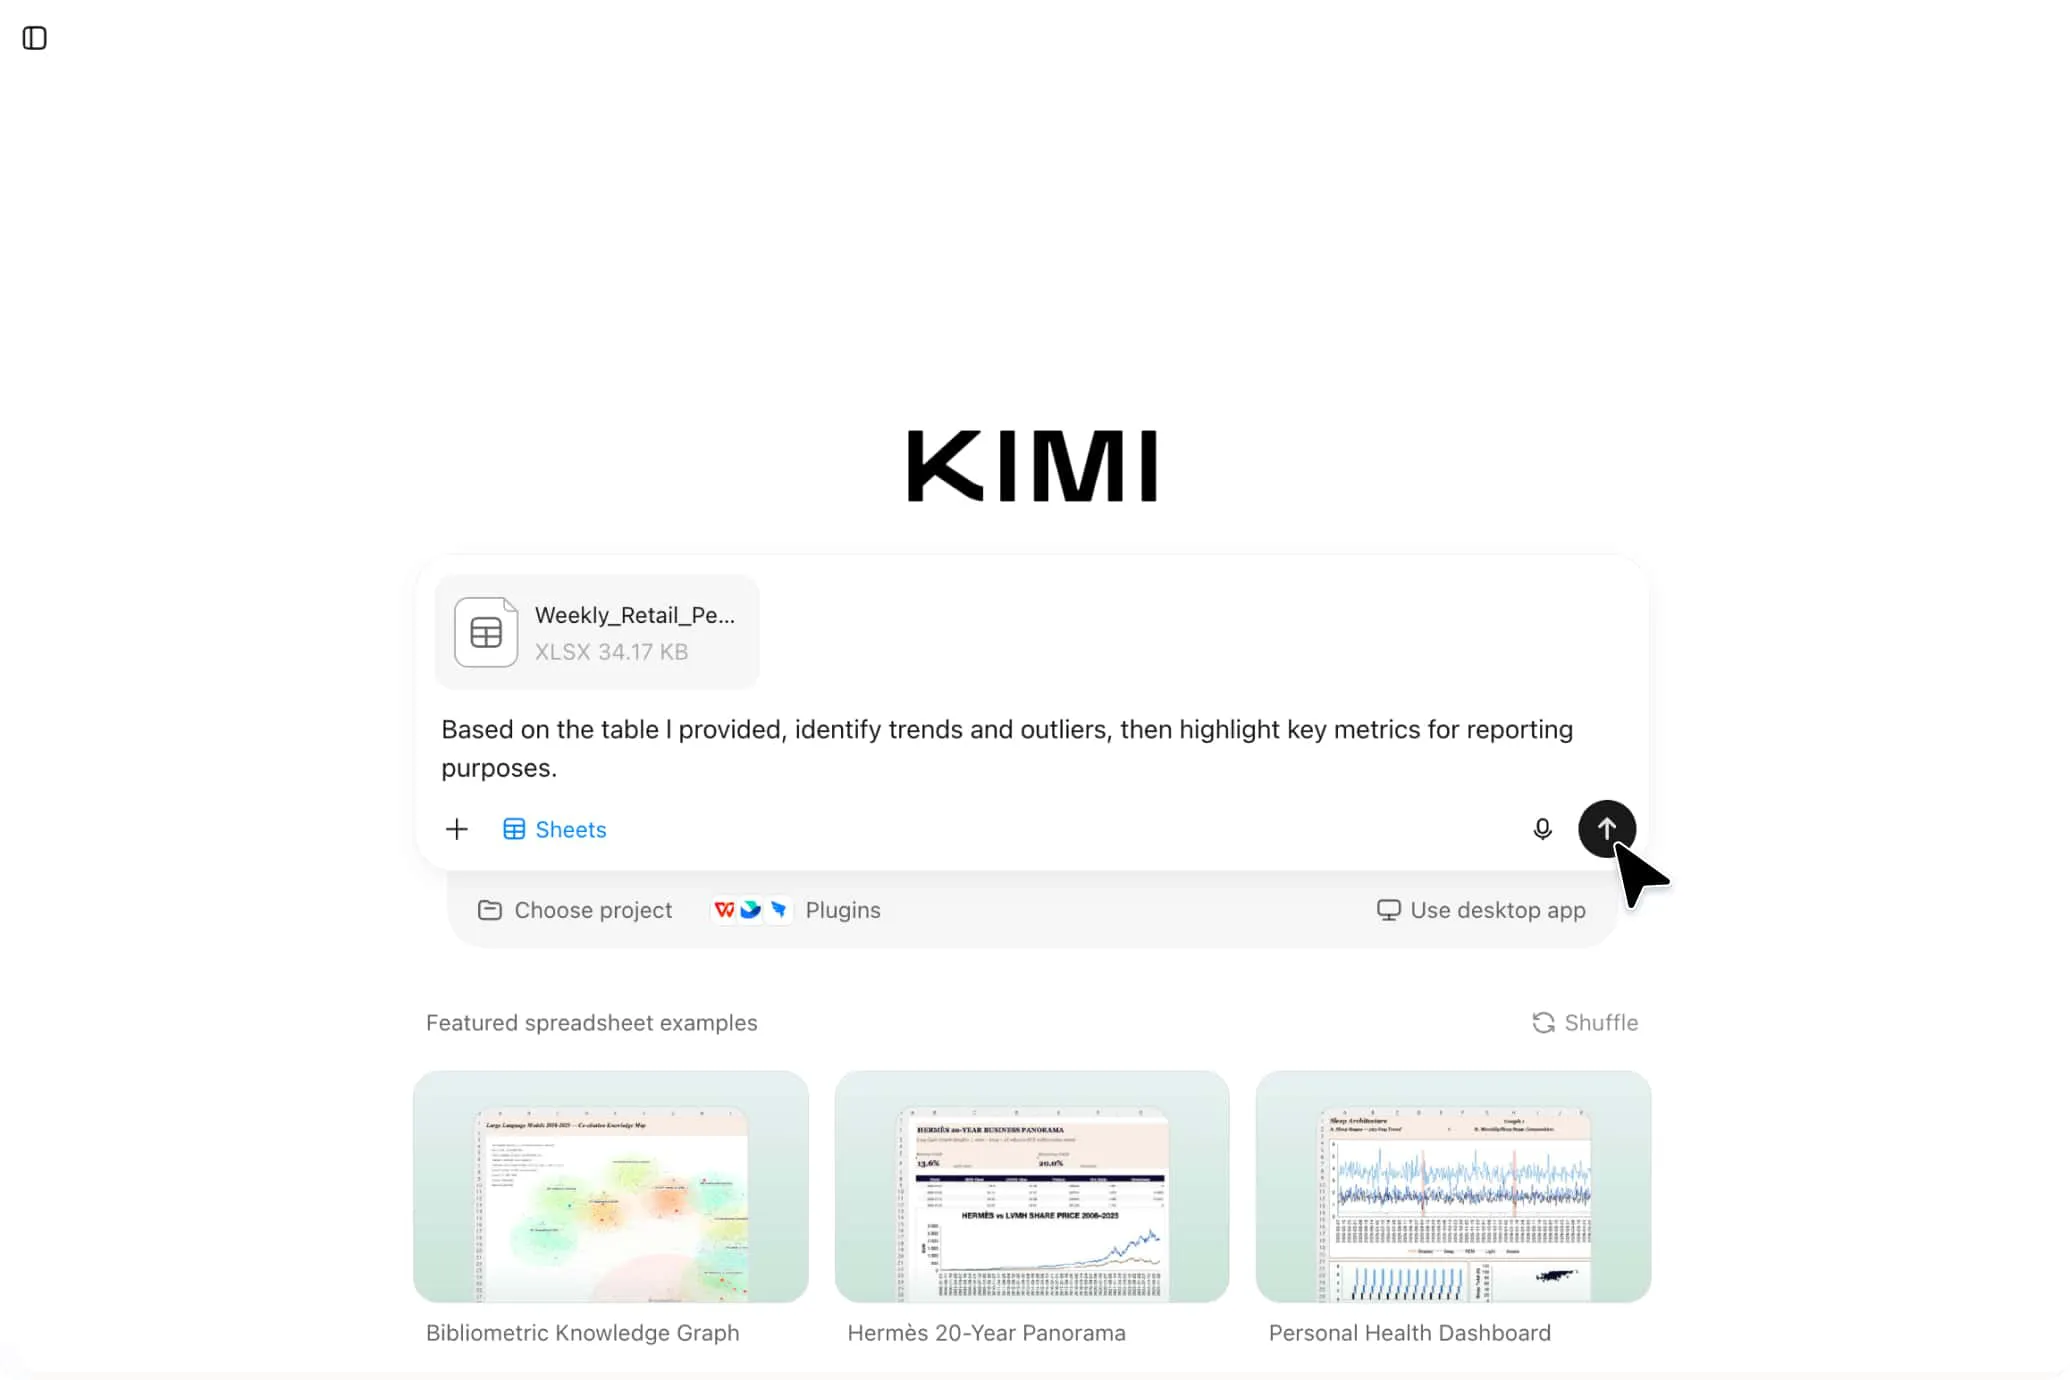
Upload a spreadsheet to Kimi Sheets and ask AI to analyse Excel data for trends, outliers, and key reporting metrics.

FAQ

An AI Excel data analysis tool automatically cleans, organizes, and analyzes spreadsheet data. It turns raw data into formulas, charts, reports, and actionable insights, helping you complete complex analysis with much less manual work.
No. Kimi Sheets is designed for anyone who works with spreadsheets. Simply upload your Excel file, describe what you need, and the AI handles the analysis for you—no coding or advanced Excel knowledge required.
Kimi Sheets can process financial, sales, marketing, academic, and operational data. As an AI Excel data analysis tool, it works with both simple and complex datasets. This makes it useful across different industries.
Yes. Kimi Sheets is built to process large Excel files efficiently, including datasets with thousands of rows and numerous columns. It stays responsive even when working with data-heavy spreadsheets.
When your spreadsheet is well-structured, Kimi Sheets delivers highly accurate formulas, summaries, and insights while reducing manual calculation errors. As with any analytical tool, it's still a good idea to review the results before making important business decisions.
Kimi Sheets supports a wide range of common file formats, including Excel, CSV, PDF, Word, and PowerPoint. You can upload files for analysis and export the results as editable Excel workbooks, PDF reports, Word documents, or PowerPoint presentations. This makes AI Excel analysis easy to use across different platforms. It ensures smooth sharing and reporting.
Simply upload your spreadsheet, describe what you want to learn from the data, and let Kimi Sheets do the rest. It automatically analyzes your data, generates formulas, charts, and reports, and prepares the results for export or sharing.

Start smarter data analysis today

AI Excel Data Analysis for Formulas, Charts & Reports