Large datasets are difficult to interpret without clear visualizations. Creating charts, dashboards, and reports manually can be slow and repetitive, especially when working with changing data. Data visualization skills enable AI agents to automatically transform raw data into clear charts, dashboards, and visual reports based on natural language instructions. Explore the AI agent skills in this article to find the right ones for automating your data visualization workflow.
What are AI data visualization skills?
AI data visualization skills are structured instructions and workflows that guide AI agents in turning raw data, complex information, or unstructured ideas into clear visual outputs. These skills help agents follow consistent approaches for selecting suitable visualization methods, organizing information, and creating charts, dashboards, and diagrams that are easier to understand and communicate.
Discover data visualization skills in Kimi
If you need a quick, flexible way to create professional visuals, Kimi offers AI-powered tools that make the process much easier. From generating high-quality charts to building interactive infographics, these skills help transform raw data into clear visual content. Here are data analysis and visualization skills you can discover in Kimi:
| Skill name | Description |
|---|---|
| chart-image | Generates publication-quality PNG chart images from data, supporting line, bar, area, candlestick, pie, and heatmap charts for reports, alerts, and dashboards, running as a lightweight headless process without a browser. |
| data-viz-renderer | Generates self-contained HTML and SVG infographics from JSON data, including stat cards, bar charts, flow diagrams, and mixed dashboards, with multiple color palettes and built-in icons. |
| database-scout | Explore SQLite and PostgreSQL databases, inspect schemas, preview data, and generate Mermaid ER diagrams. |
How to use Kimi's AI skills for data visualization?
Kimi lets you create charts, dashboards, and other visuals by simply choosing the right AI skill and describing what you need. Follow these simple steps to get started:
Step 1: Install the skill and input its command
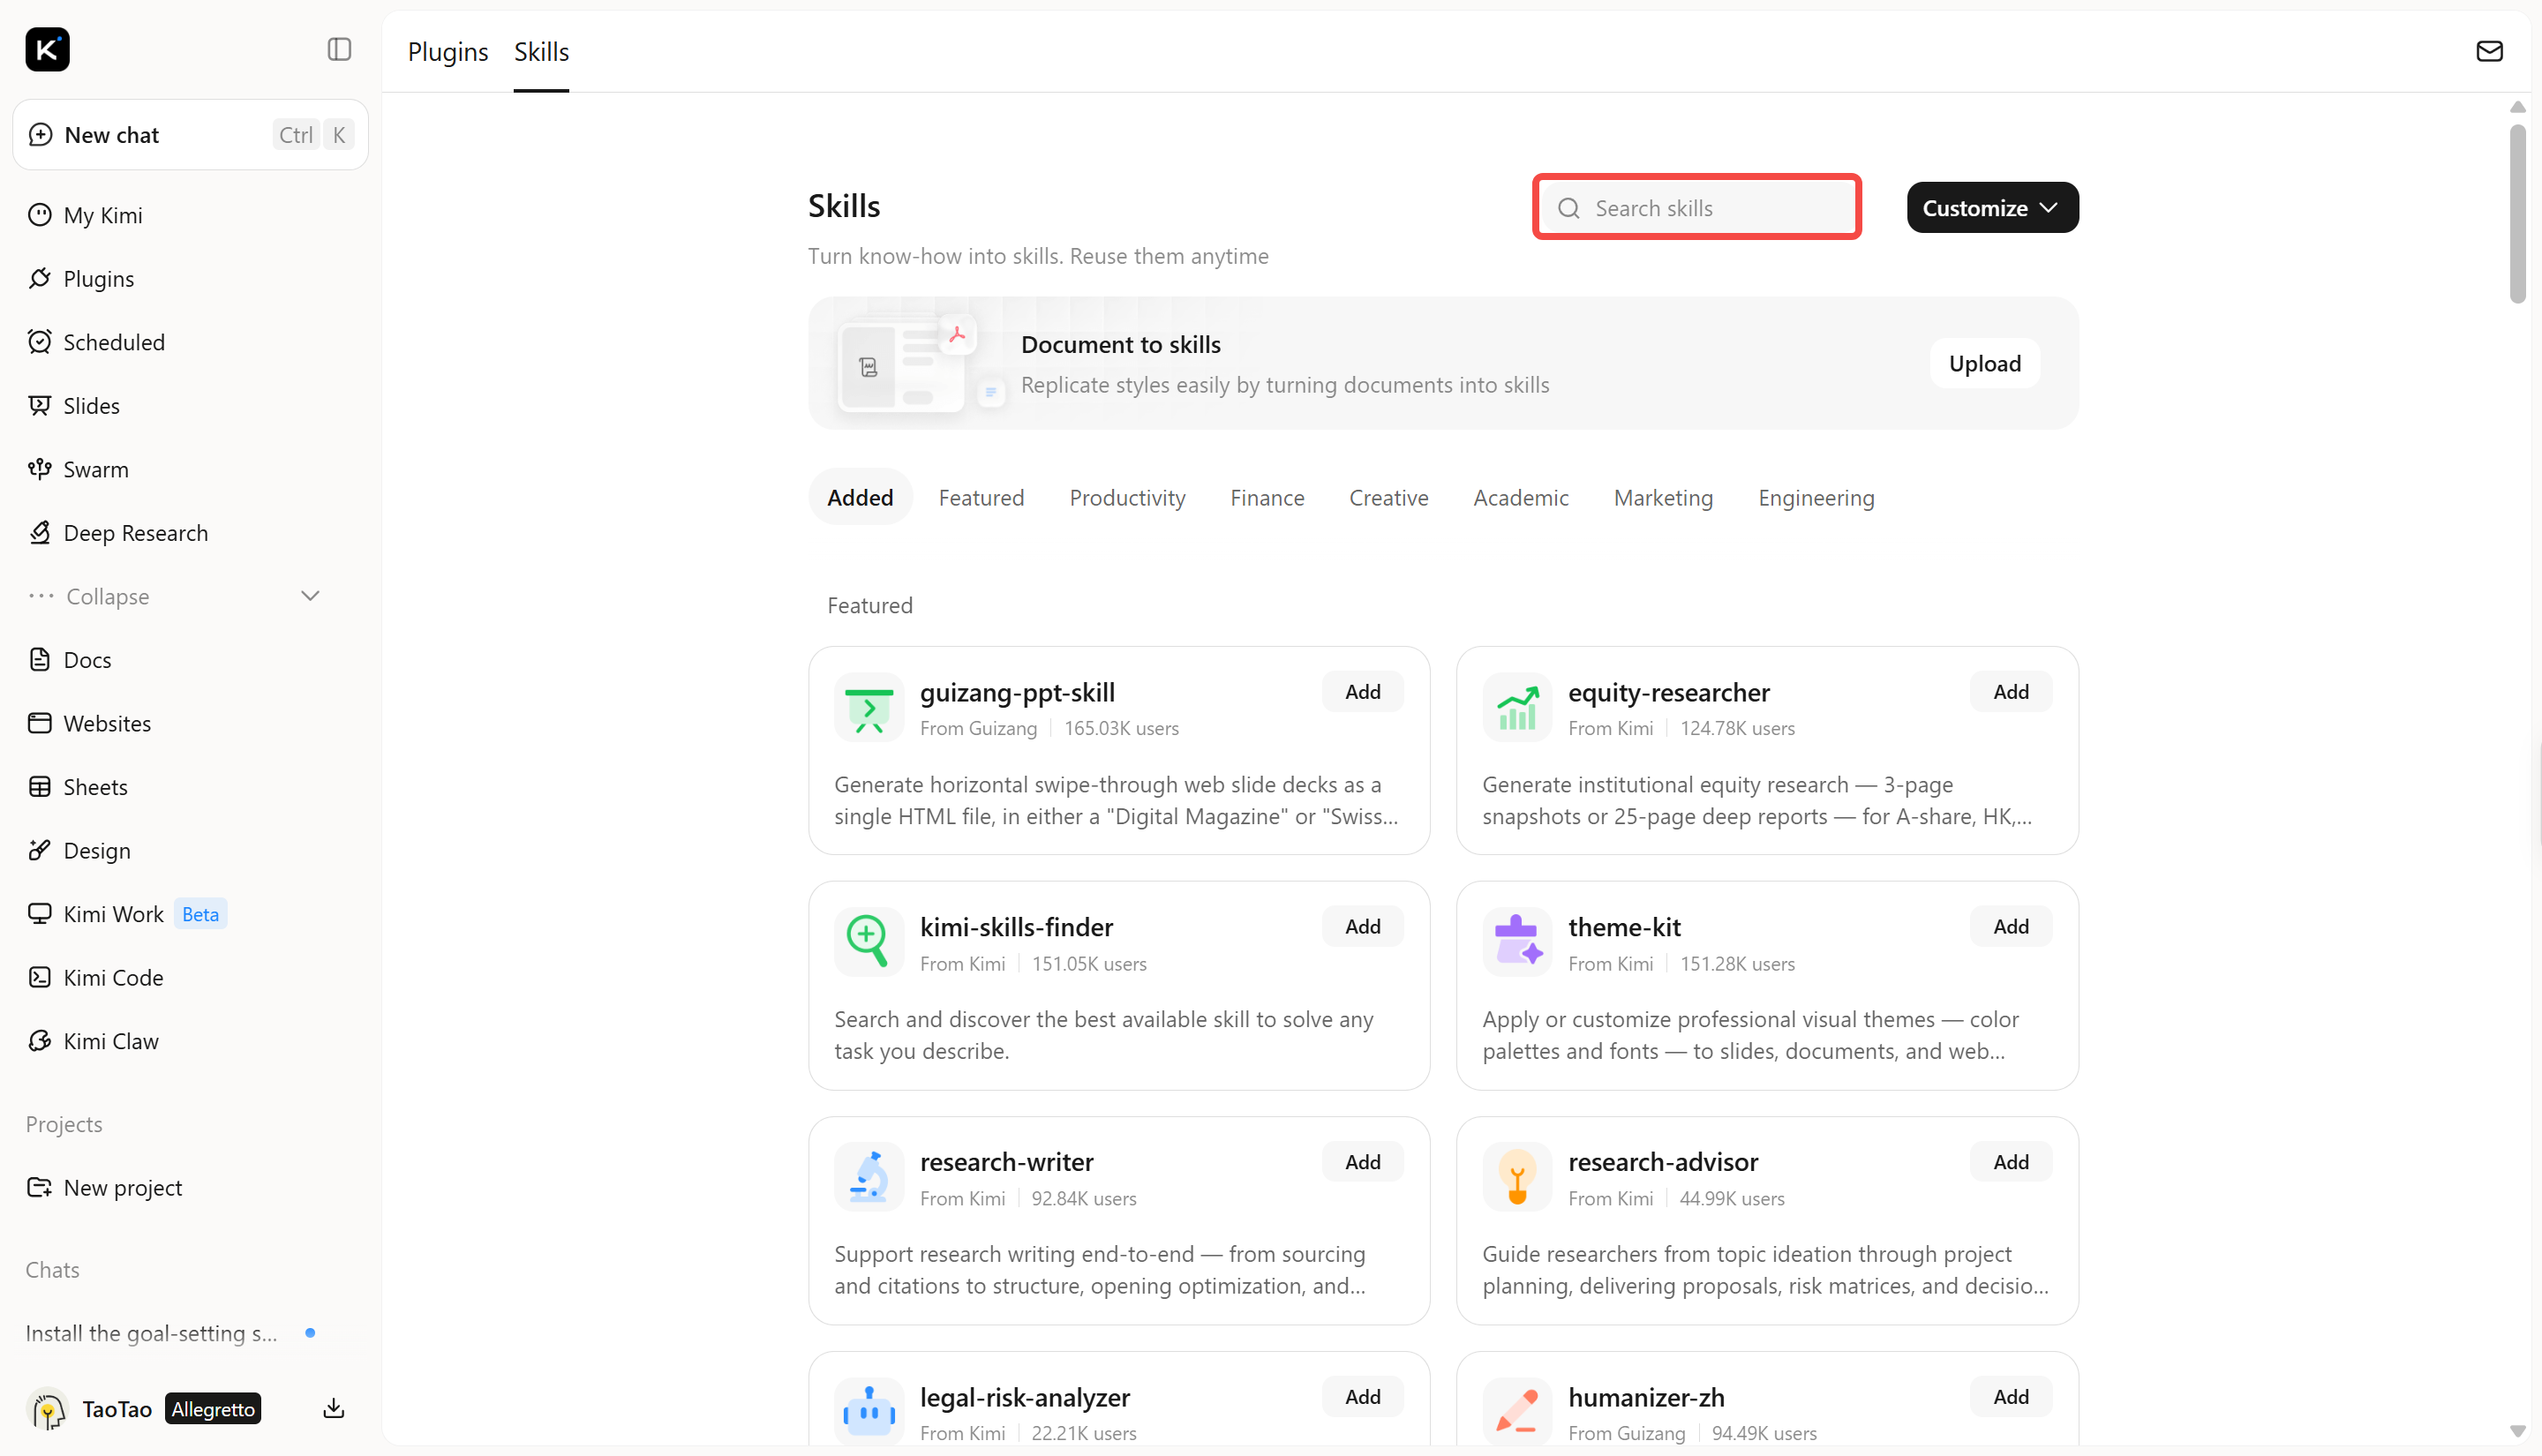
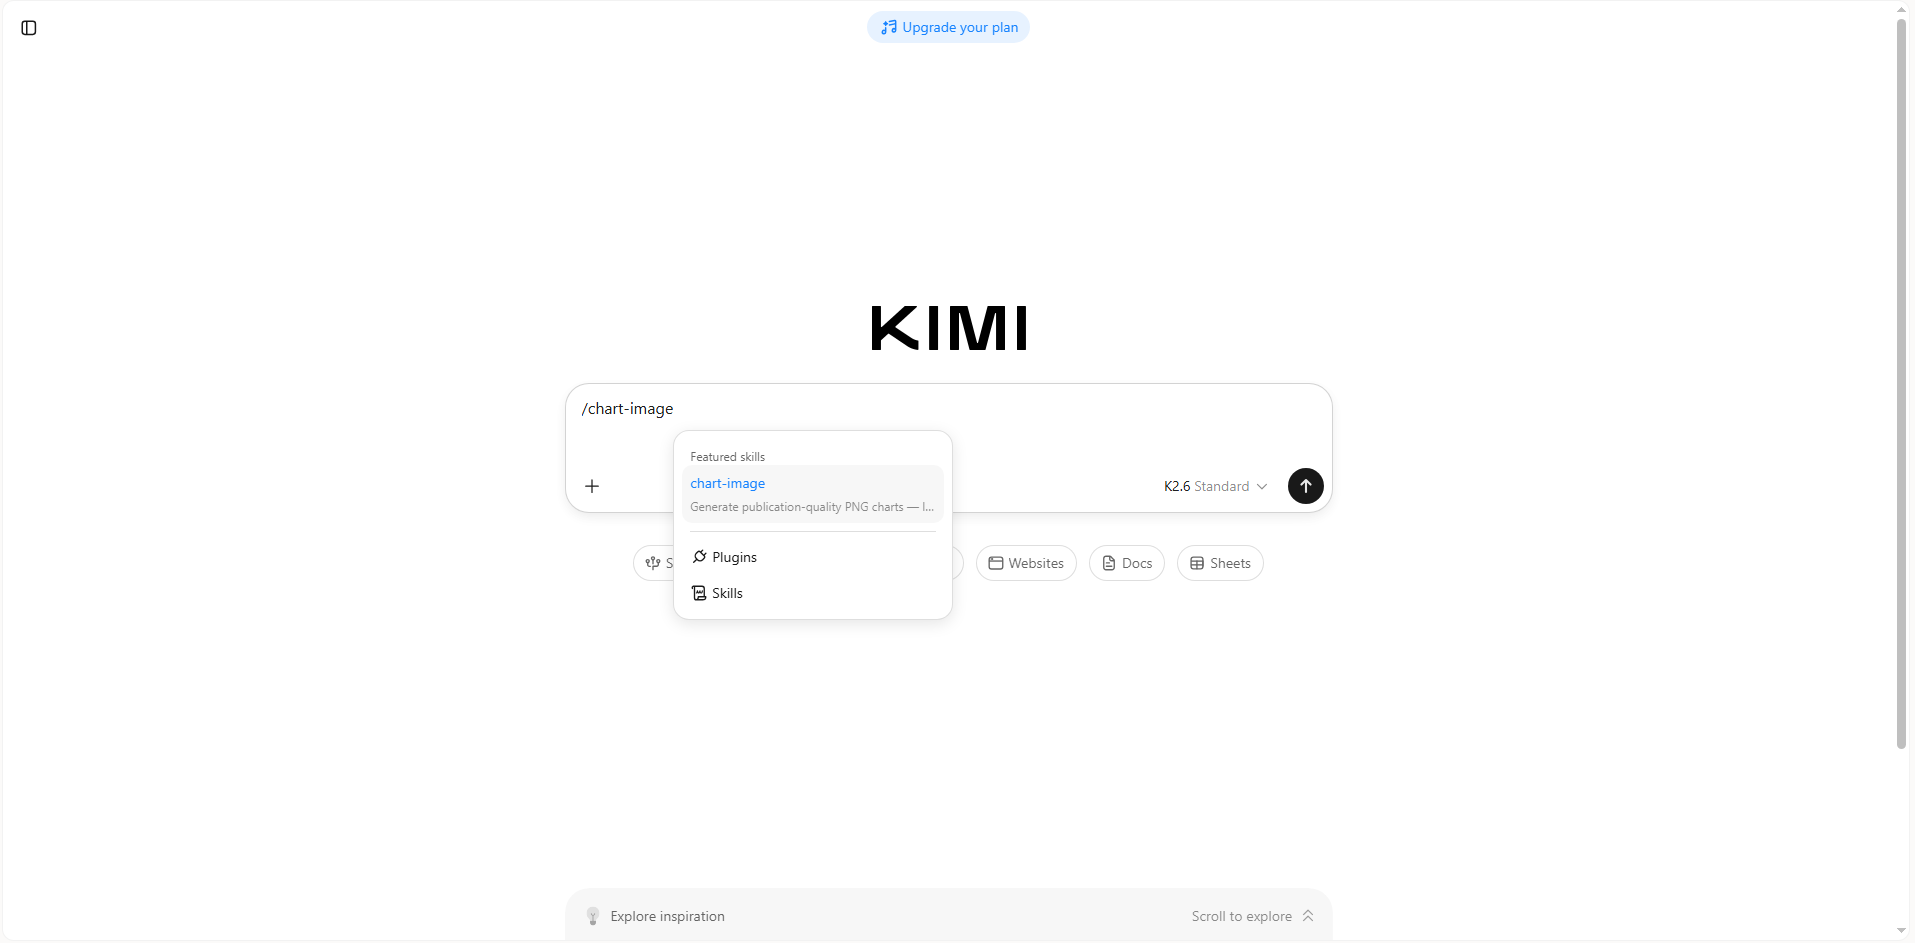
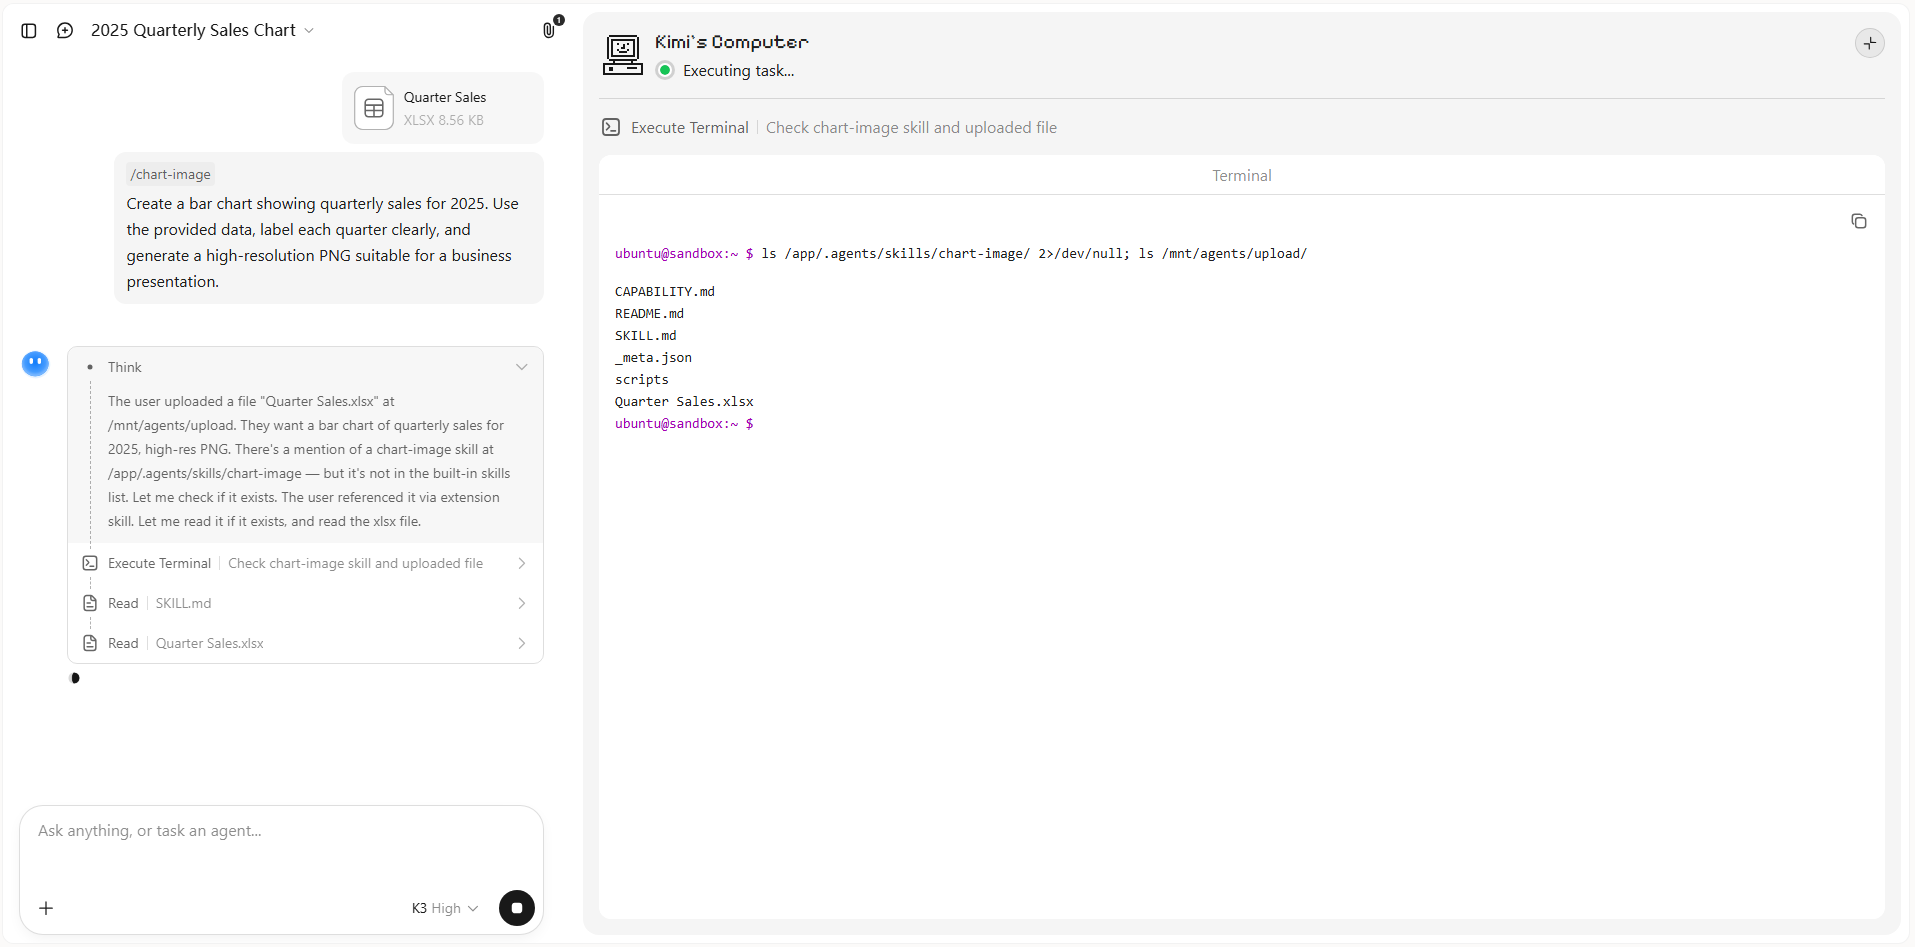
Open Kimi and type / in the input box to open the Skills store. Search for chart-image and click to install it. Then type /chart-image in the input box to activate the skill.
Step 2: Start your research task
Explain the data you want to visualize and the type of output you need.
Example prompt:
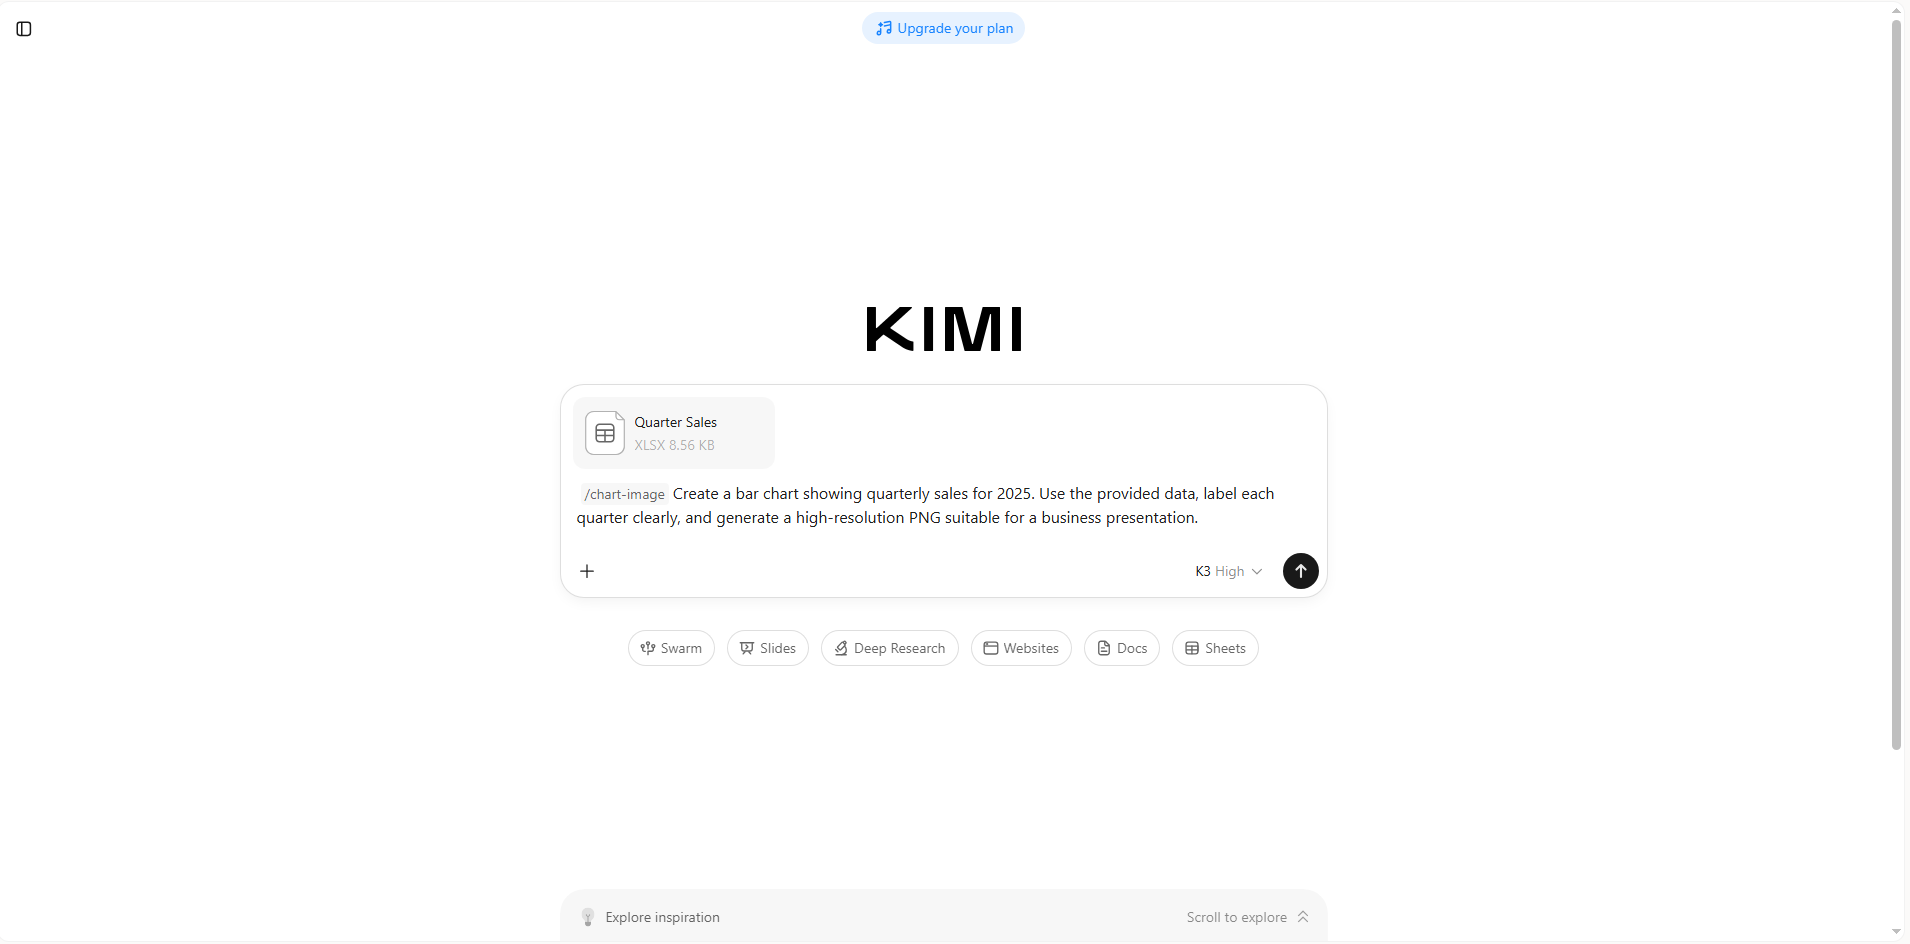
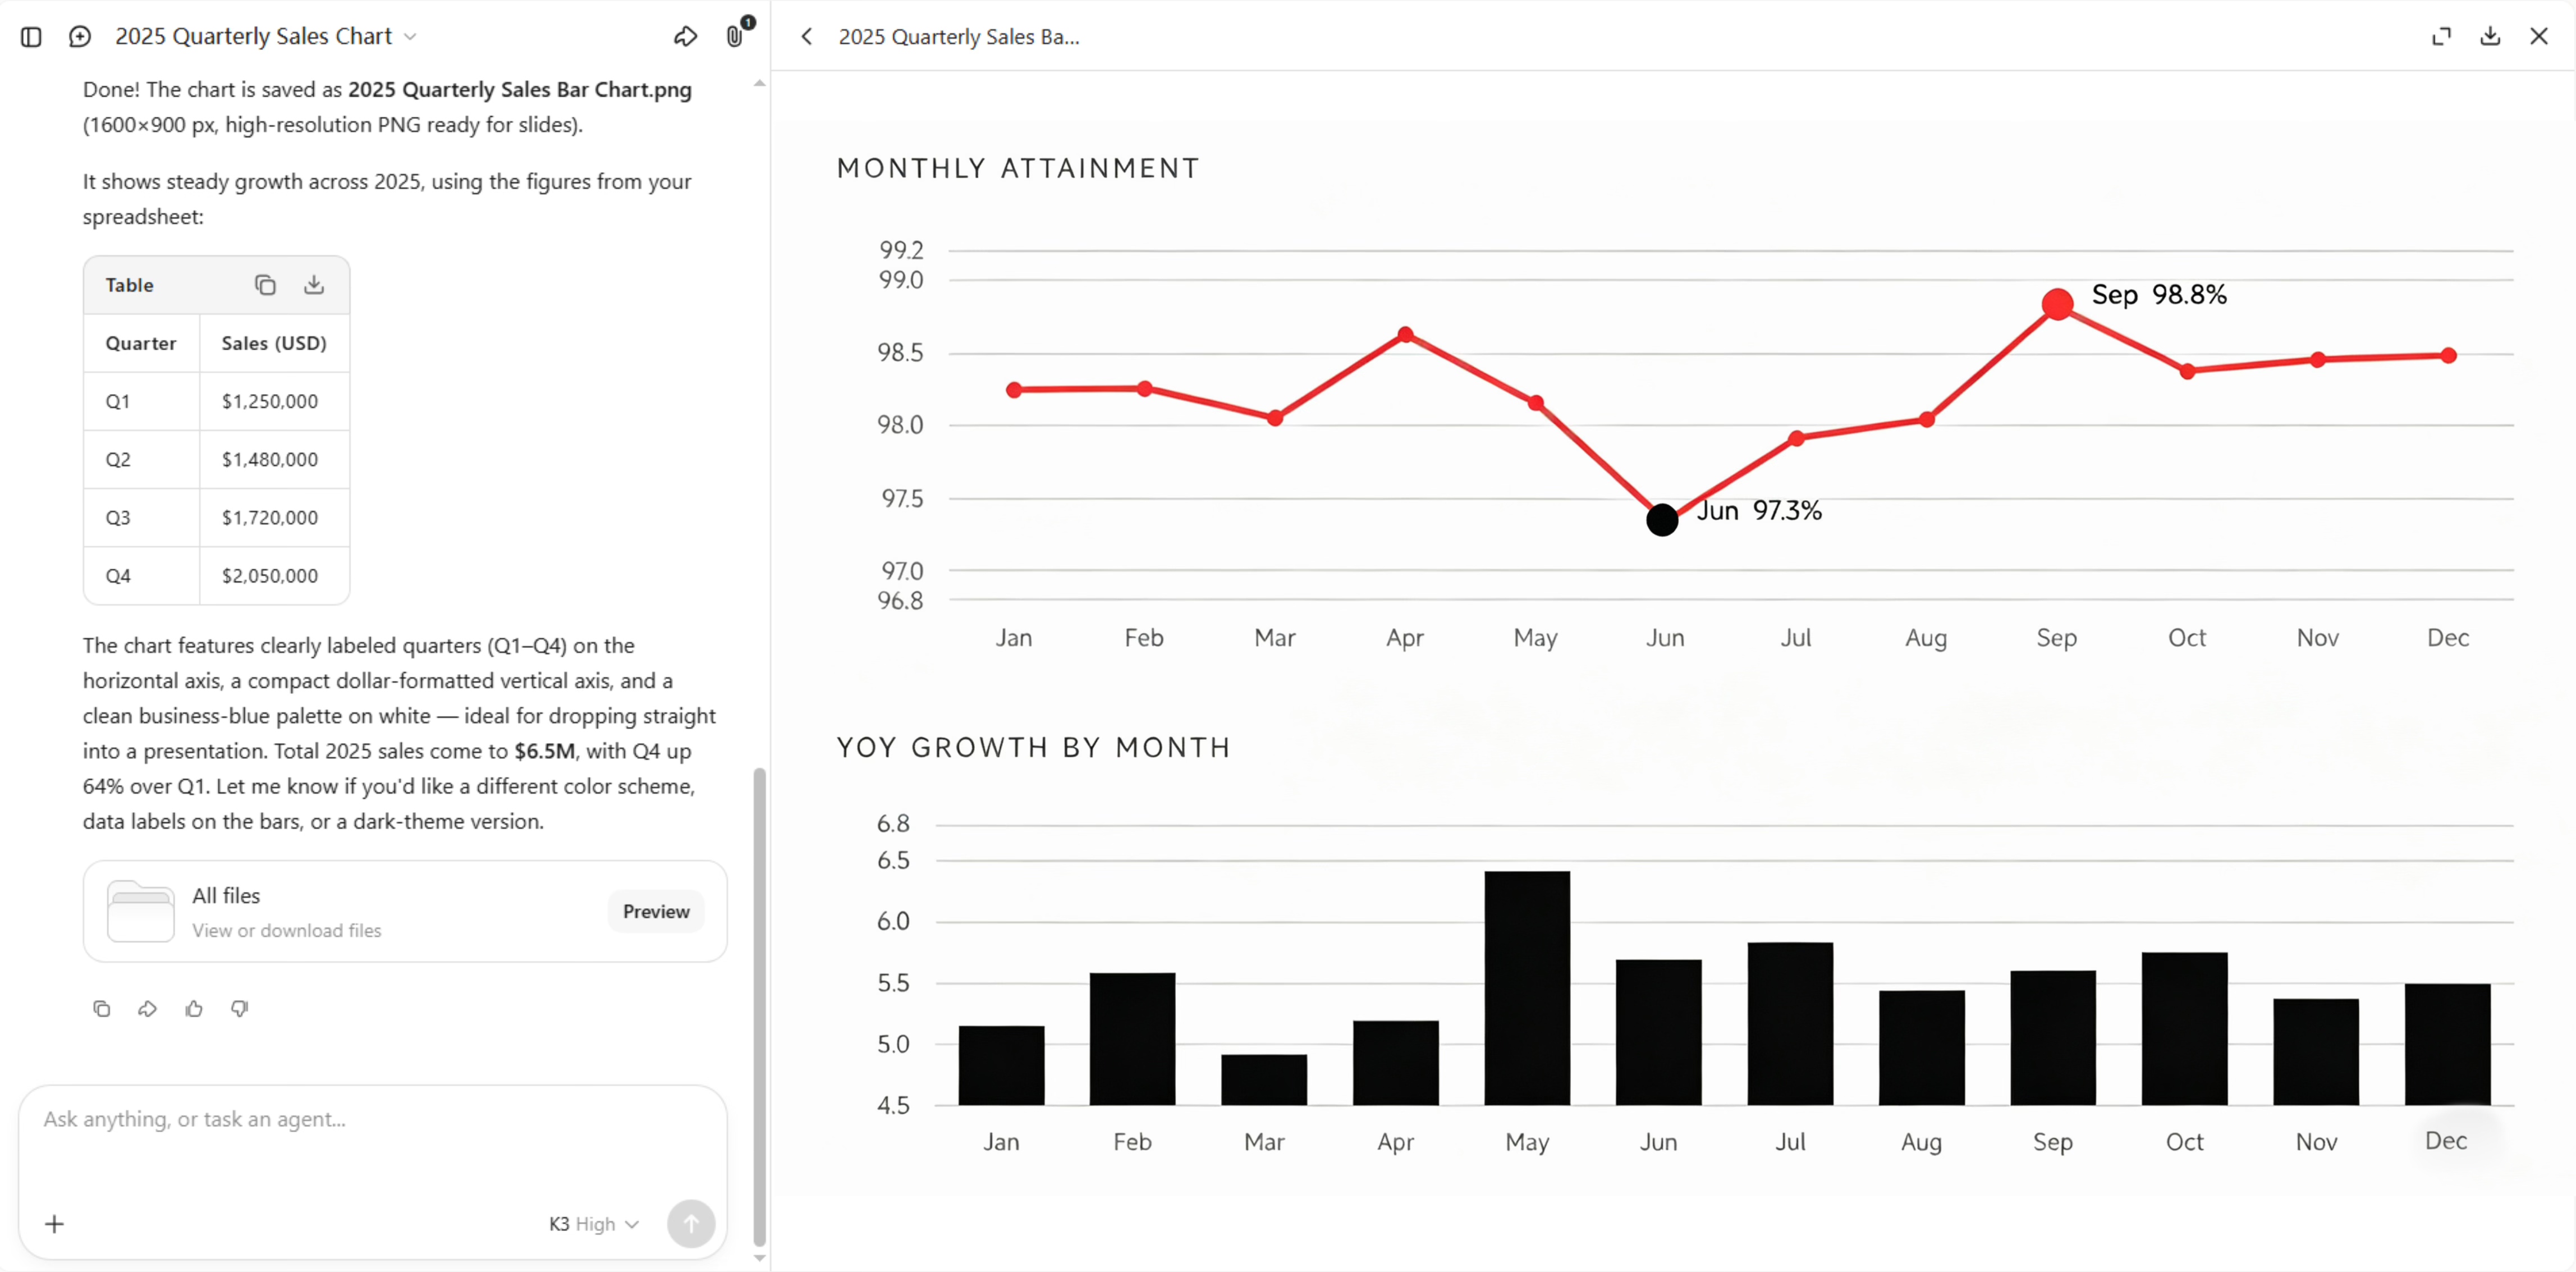
Kimi will process your request and generate a clear, well-structured visual based on your instructions.
Step 3: Review the output
Check the generated chart or infographic, make any adjustments if needed, and save the final output for reports, presentations, or dashboards.
Explore open-source data visualization skills
Beyond the Kimi Skills store, the open-source community offers many powerful Excel skills for data analytics and visualization specialization. Some focus on creating charts and dashboards, while others help visualize knowledge graphs, project structures, and complex data relationships. Explore the open-source AI skills below to find the ones that best fit your analytics and visualization needs:
| Skill name | Description | URL |
|---|---|---|
| mckinsey-style-visualization-skill | Agent skill that turns messy notes into rendered strategy-consulting visuals. Includes a dependency-free Python renderer and committed SVG outputs for 12 patterns. Features input triage, pattern library, style system, quality rubric, and expert review loop. | https://github.com/kgraph57/mckinsey-style-visualization-skill |
| scientific-plotting-skill | AI skill for publication-ready ggplot2/plotnine figures with vector PDF output. Journal-friendly widths (85mm/180mm), Wong discrete colors, viridis continuous colors, and Times typography rules. No bundled scripts — agent generates code from SKILL.md rules. | https://github.com/dazhiyang/scientific-plotting-skill |
| tableau-dashboard-creator-skill | Agentic AI skill that transforms dashboard requests into Tableau specifications. Includes interactive HTML mock, implementation blueprint, and executable Tableau workbook. Supports PostgreSQL with extensible database connectors. | https://github.com/laviDrori0702/tableau-dashboard-creator-skill |
| dashboard-governance-skill | Skill for maintaining Big Ideas, Sessions, Decisions, and emerging next steps in a project Dashboard. Includes Dashboard row semantics, scope narrowing, candidate memory, and end-of-task review with local validators. | https://github.com/buccaneermethodology/dashboard-governance-skill |
| knowledge-graph-reasoning | Agent skill for building, querying, validating, and reasoning over knowledge graphs. Features adversarial fact validation, deterministic reasoning, JSON-LD schemas, and a graph traversal engine with 5 test cases. | https://github.com/michaelwinczuk/knowledge-graph-reasoning |
| aeo-schema-skill | AI agent skill for Schema.org JSON-LD markup covering Google Rich Results and AEO (AI answer engine optimization). Includes entity graph approach, Speakable properties, sameAs strategy, and platform-specific instructions. | https://github.com/yulia-glukhova/aeo-schema-skill |
| skills-md-graph | Rust CLI that parses AI agent SKILL.md files to extract and visualize dependency graphs. Scans directories, builds dependency graphs, links for cycles/orphans, and exports to RDF/Turtle or Cypher for Neo4j. | https://github.com/navfa/skills-md-graph |
| obsidian-skill-graph | Obsidian plugin to visualize agent skill structures (OpenClaw/Claude Code) in graph view. Displays SKILL.md nodes with frontmatter names, connects referenced files with edges, and colors nodes by type. | https://github.com/hanamizuki/obsidian-skill-graph |
| skill-graph | Framework for authoring Claude Skills as interlinked graphs instead of monolithic SKILL.md files. Applies graph structure to skill prose for context-budget efficiency with validator invariants. | https://github.com/quaylabshq/skill-graph |
| skillscan-lint | Quality linter for AI agent skill files checking readability, clarity, and graph integrity. Detects cycles, dangling references, broken links, and supports CI integration via GitHub Actions and pre-commit hooks. | https://github.com/kurtpayne/skillscan-lint |
How to use open-source data visualization skills in Kimi?
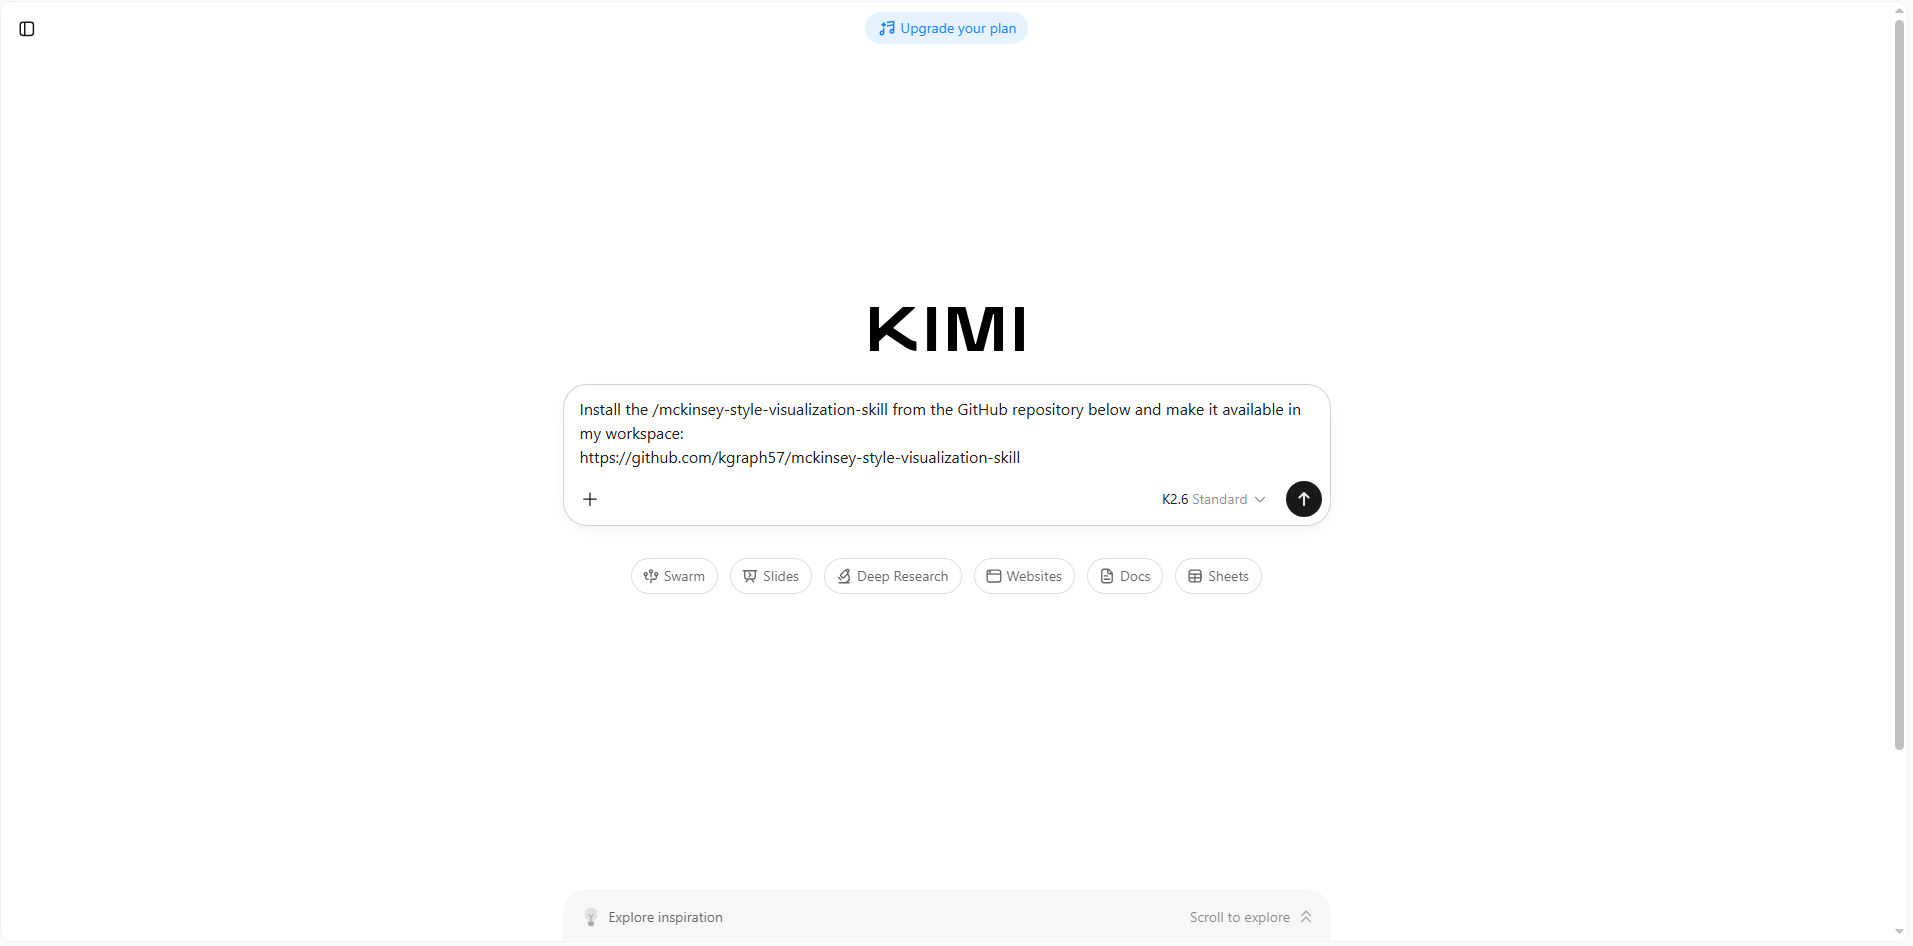
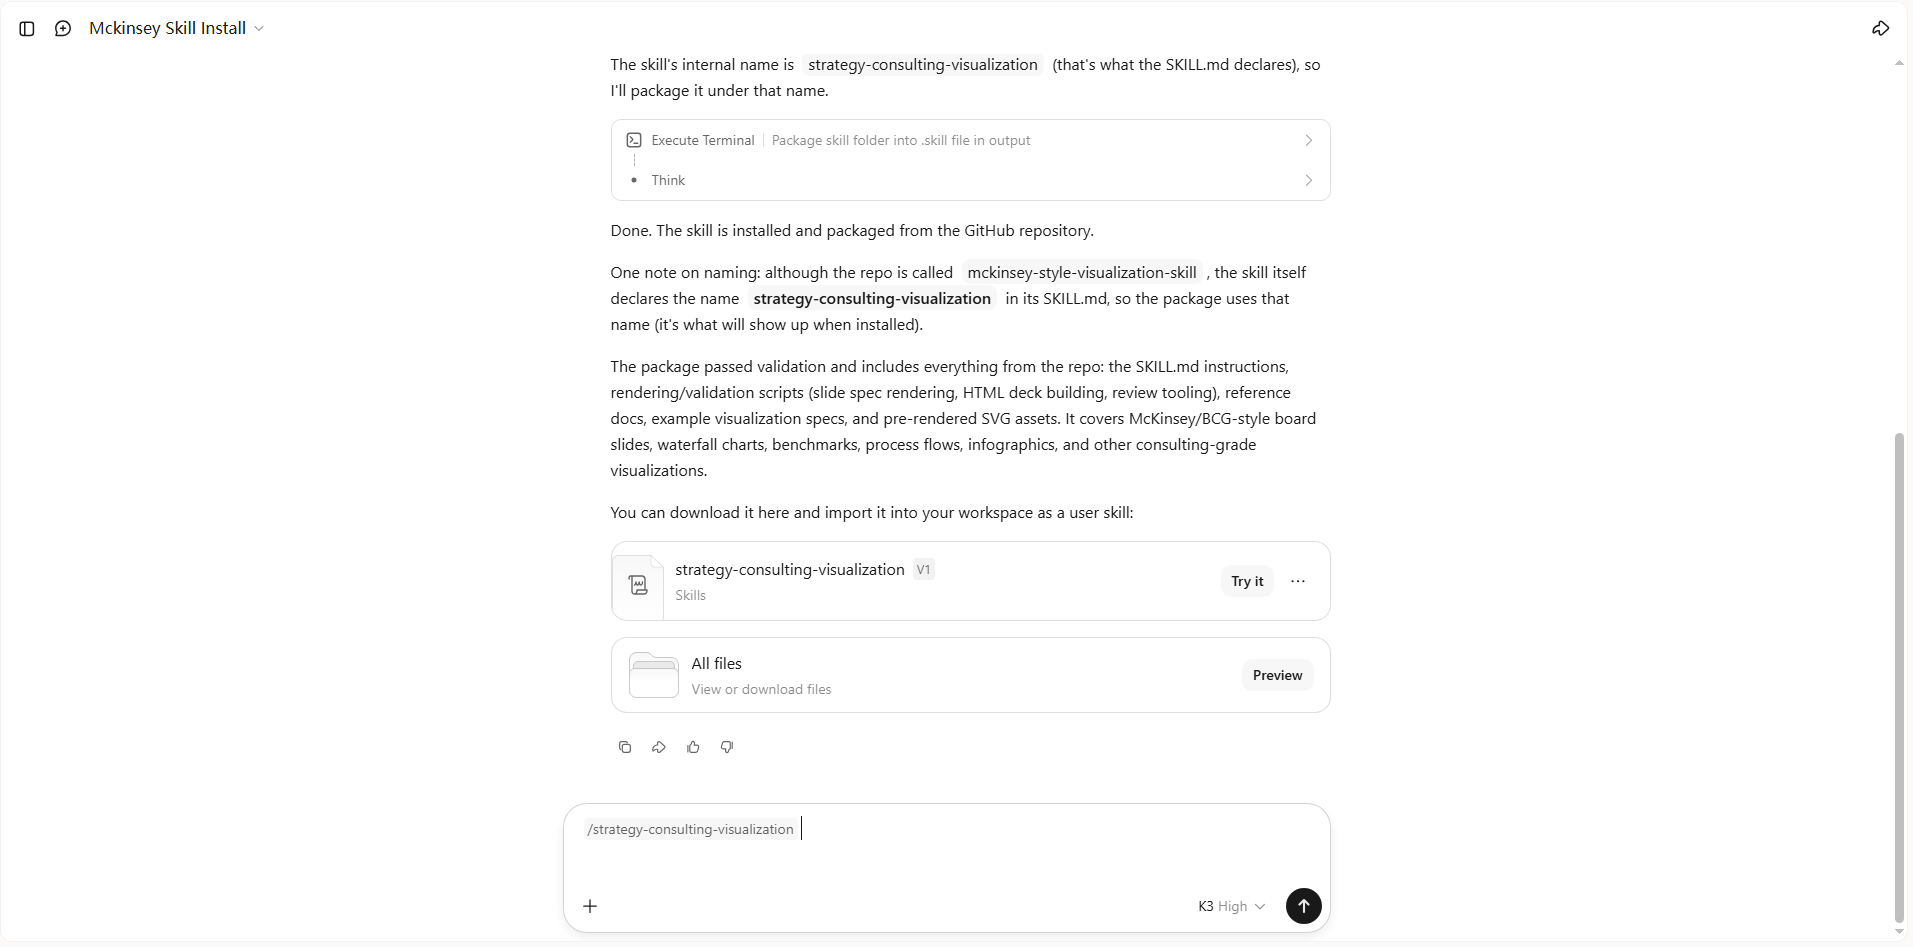
You can extend Kimi with open-source visualization skills by providing the GitHub repository link. Once installed, these skills can generate charts, dashboards, diagrams, and other visual outputs based on your requests. Here's how to use open-source skills in Kimi:
Step 1: Enter a prompt
Open Kimi and ask it to install the visualization skill using the GitHub URL of the repository you want to use.
Example prompt:
Step 2: Let AI install the skill automatically
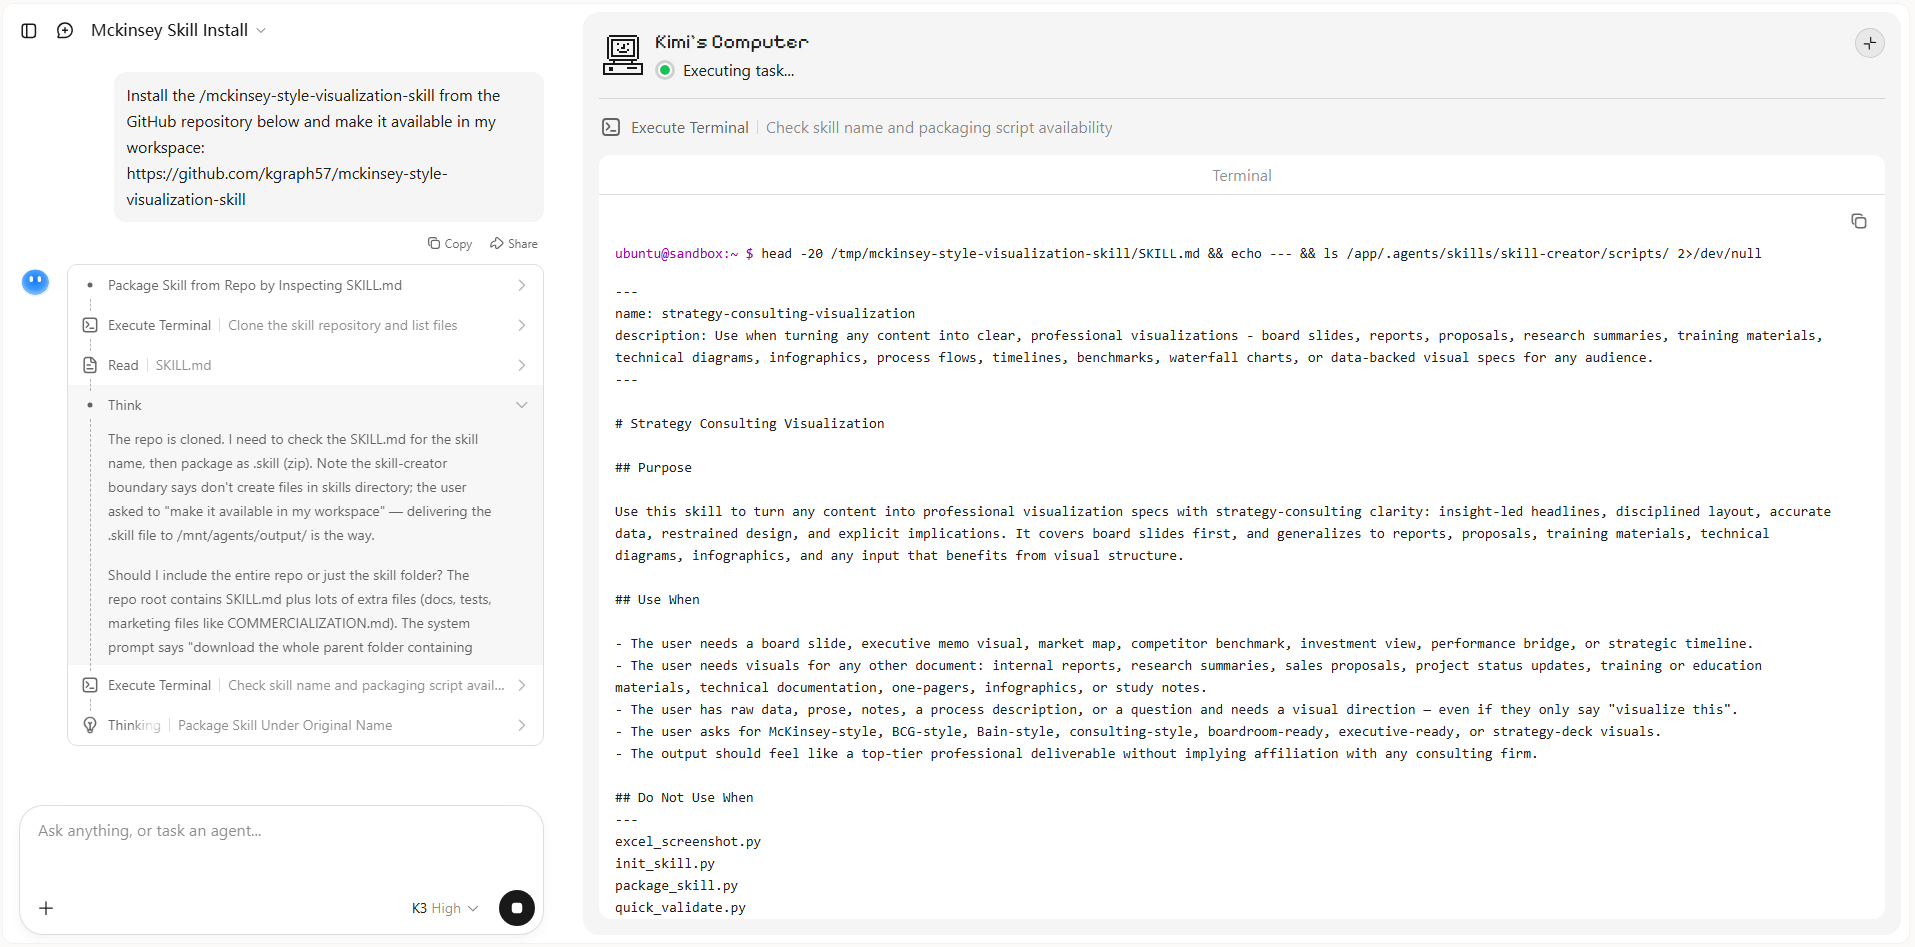
Kimi downloads the required files, configures the skill, and prepares it for use without requiring manual setup. Once the installation finishes, the skill becomes available in your workspace.
Step 3: Use the skill
Activate the installed skill and describe the type of chart, dashboard, or visual you want to create. Kimi will generate the requested output based on your prompt.
Take data visualization further with custom skills in Kimi
Kimi also lets you create your own visualization skills from documents and workflows you use regularly. This makes it easy to build reusable AI tools that generate charts, dashboards, reports, or infographics based on your preferred data formats. Follow the steps below to convert a document to a skill in Kimi:
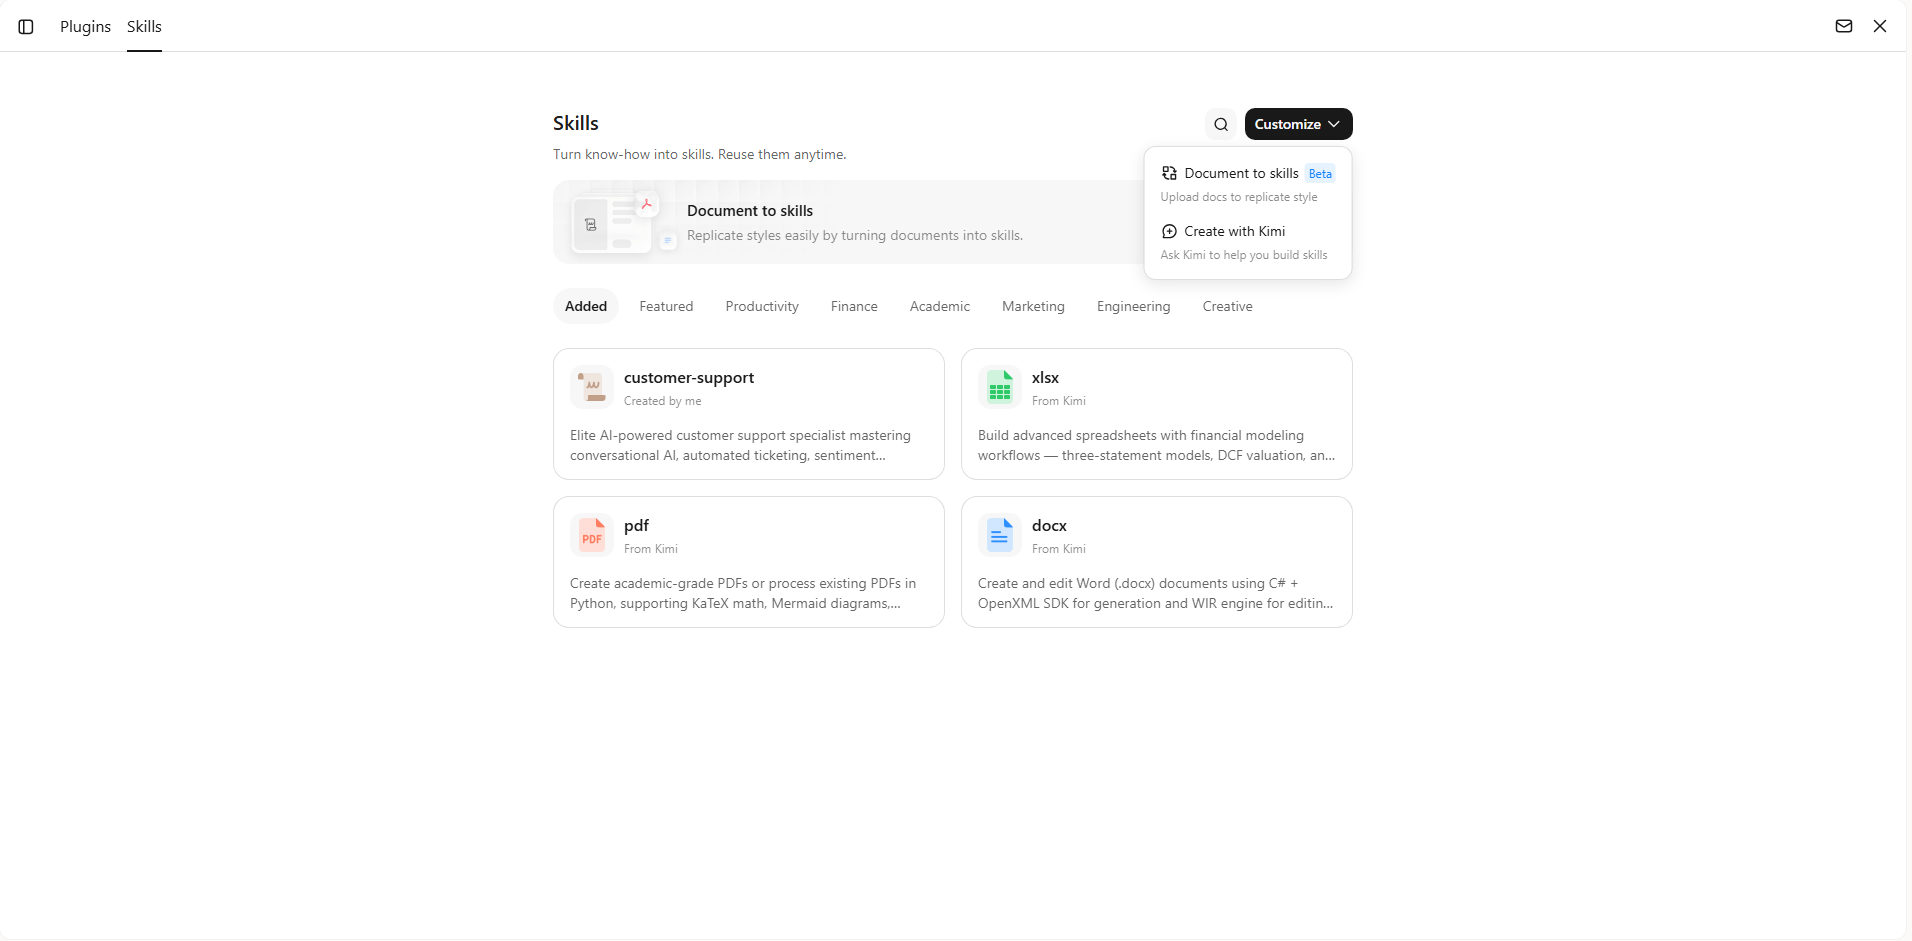
Step 1: Access the "Document to skills" tool
Open Kimi Skills and select "Document to skills" to begin creating your custom visualization skill.
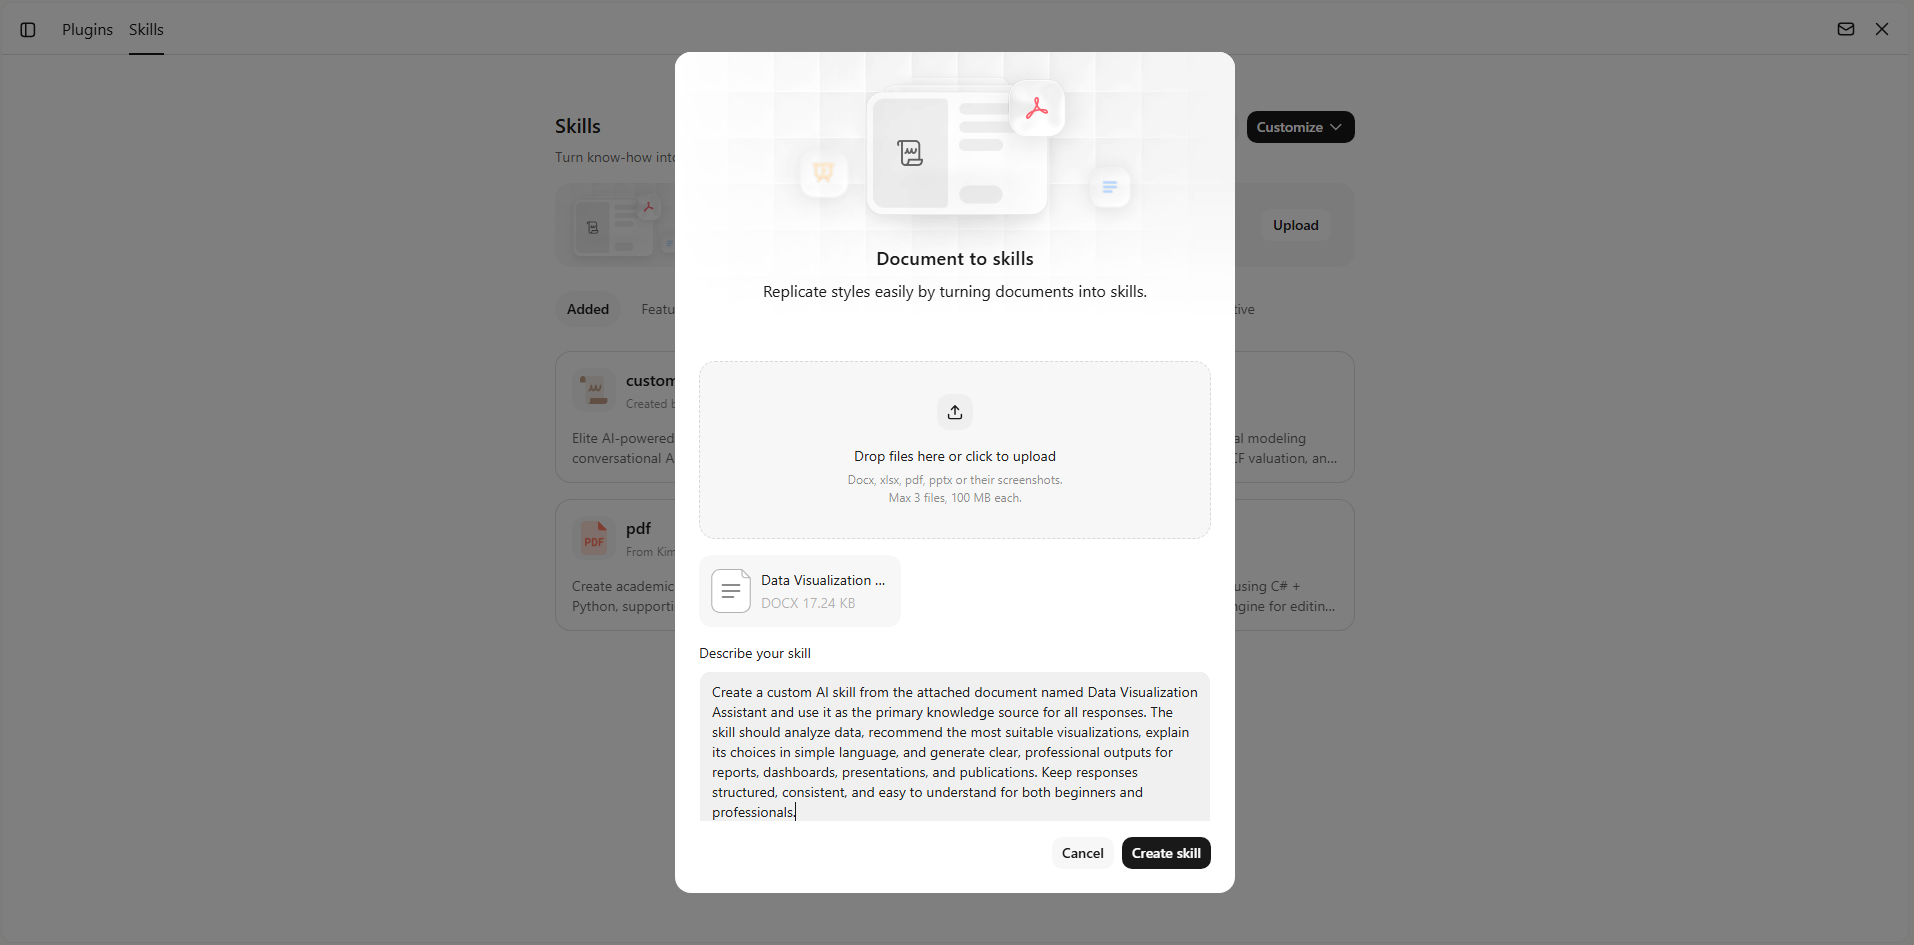
Step 2: Upload the files
Upload the documents you want Kimi to learn from, such as reporting templates, dashboard specifications, chart guidelines, data dictionaries, or visualization best practices. Kimi organizes the content into a reusable AI skill.
Step 3: Create and use your skills
After processing is complete, your custom skill is ready to generate visuals, format reports, and create consistent data presentations based on your instructions. You can update the skill whenever your workflow changes or reuse it across future projects.
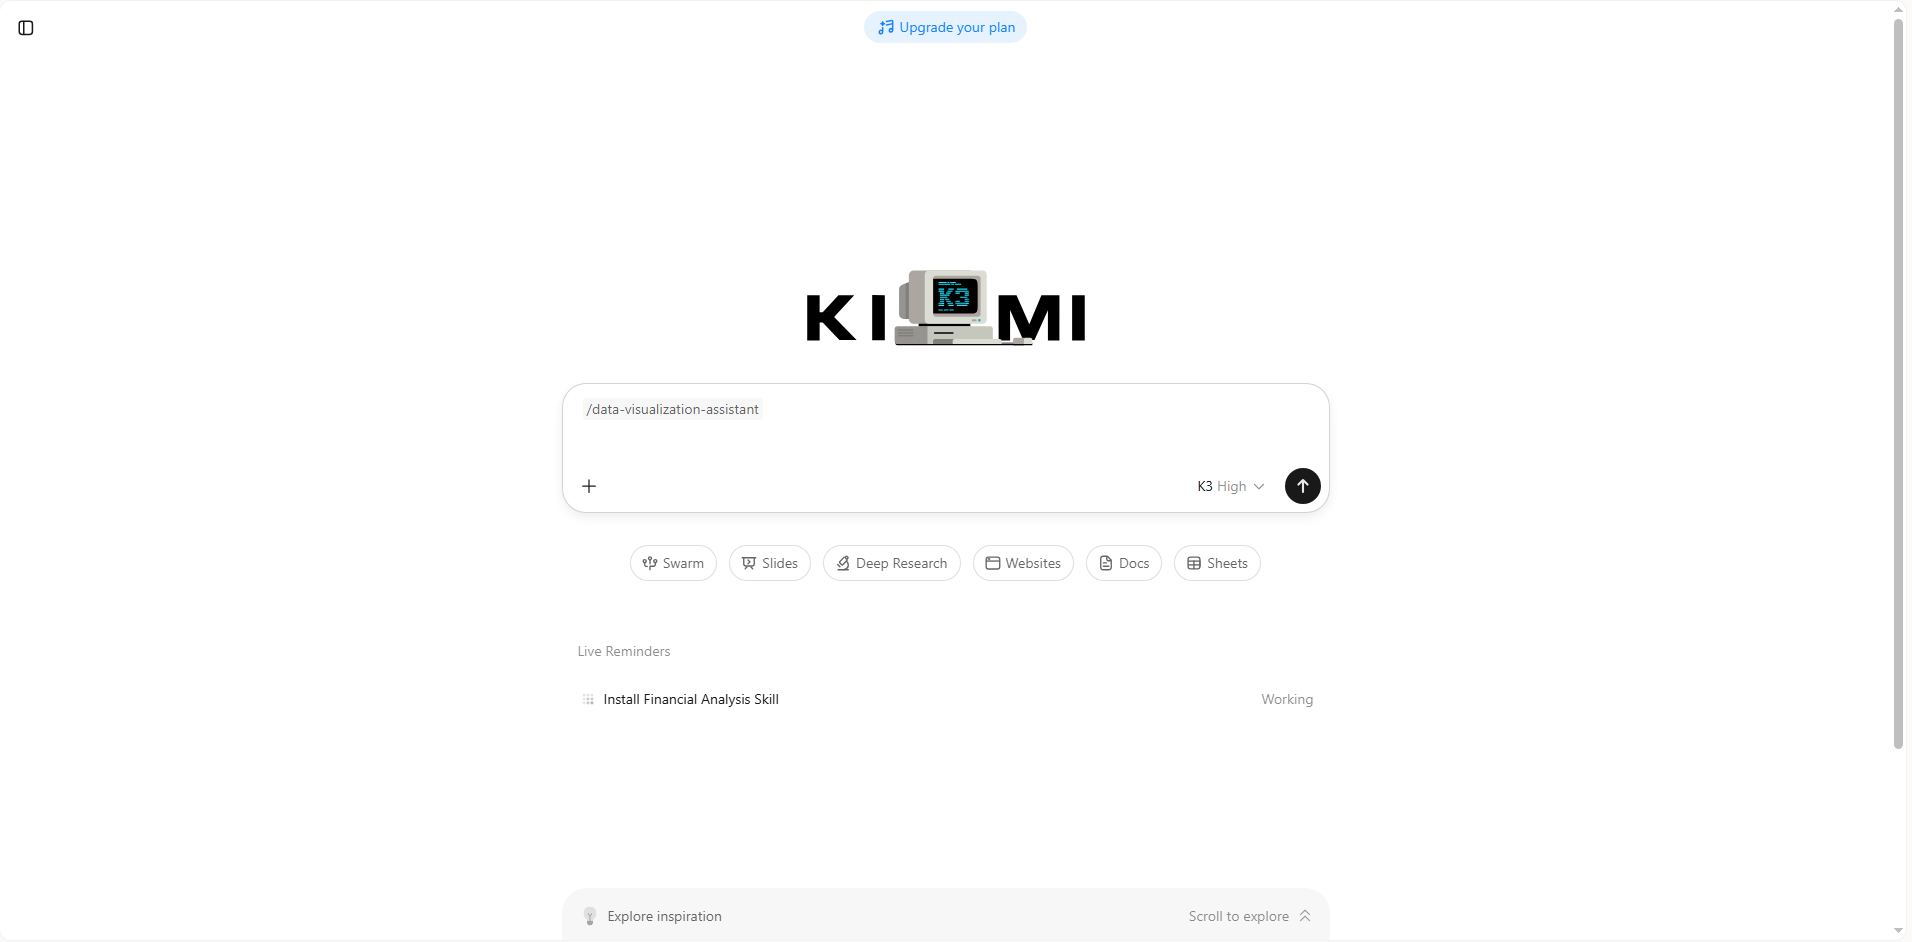
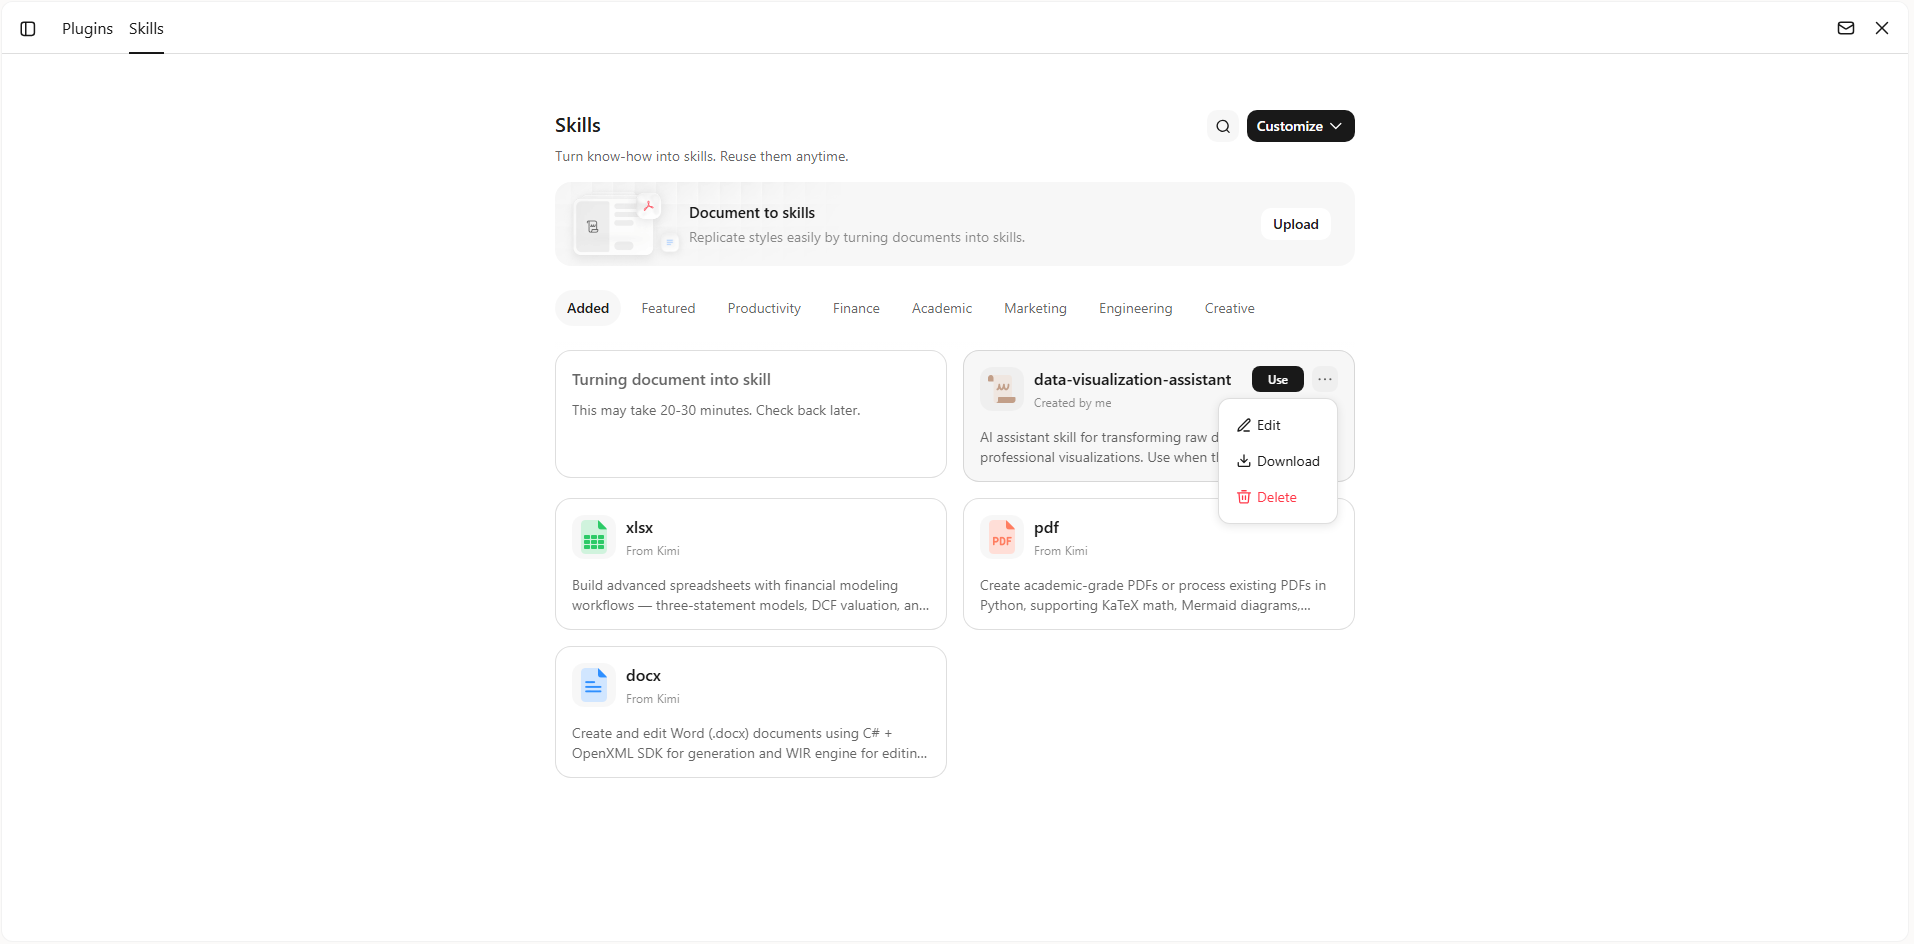
You can also edit the skill at any time to refine its behavior or download it for backup and use in future projects.
Tips for using AI data visualization skills
Getting the best results from AI is not only about choosing the right skill but also about using it effectively. With the following simple practices, you can create clearer visualizations, uncover more meaningful insights, and make your data visualization skills more reliable across different projects:
Define the purpose before creating visuals
Start by explaining what you want to learn or communicate instead of asking for a specific chart. For example, mention whether you want to compare performance, track trends, identify patterns, or highlight changes. This helps the AI choose a visualization that best supports your objective.
Match chart types to data stories
Different datasets require different visual formats to communicate information effectively. Let the AI choose the most suitable chart based on whether your data focuses on trends, comparisons, relationships, or distributions. This makes your visuals more meaningful and easier to interpret.
Provide clear visualization guidelines
Include instructions about your preferred colors, branding, audience, labels, layout, or reporting style. Clear guidelines help the AI generate visuals that are consistent and suitable for presentations, dashboards, or business reports. They also reduce the need for manual editing later.
Combine visualization with data analysis
Ask the AI to do more than generate charts by also analyzing the underlying data. It can highlight trends, unusual patterns, outliers, and key insights that may not be obvious at first glance. This makes your visualizations more informative and actionable.
Create reusable visualization workflows
If you regularly create similar reports, build custom AI skills with your preferred visualization methods and reporting structure. Reusing these workflows saves time while maintaining consistency across different projects. It also helps automate repetitive visualization tasks more efficiently.
Conclusion
As AI continues to improve, data visualization skills are making it easier to turn information into clear, useful visuals with less manual effort. Choosing the right skills can help you work faster, present ideas more effectively, and adapt to different data projects. Whether you use skills from the Skills store or custom skills, having the right workflow can make a real difference. Try Kimi to explore, build, and customize data visualization skills that fit the way you work.