Online Infographic Maker
Turn complex information into engaging visuals with an infographic maker. Upload documents, photos, and prompts to guide creation, then customize charts, design elements, and layouts to fit your needs. With Kimi Design, create polished infographics for various purposes.
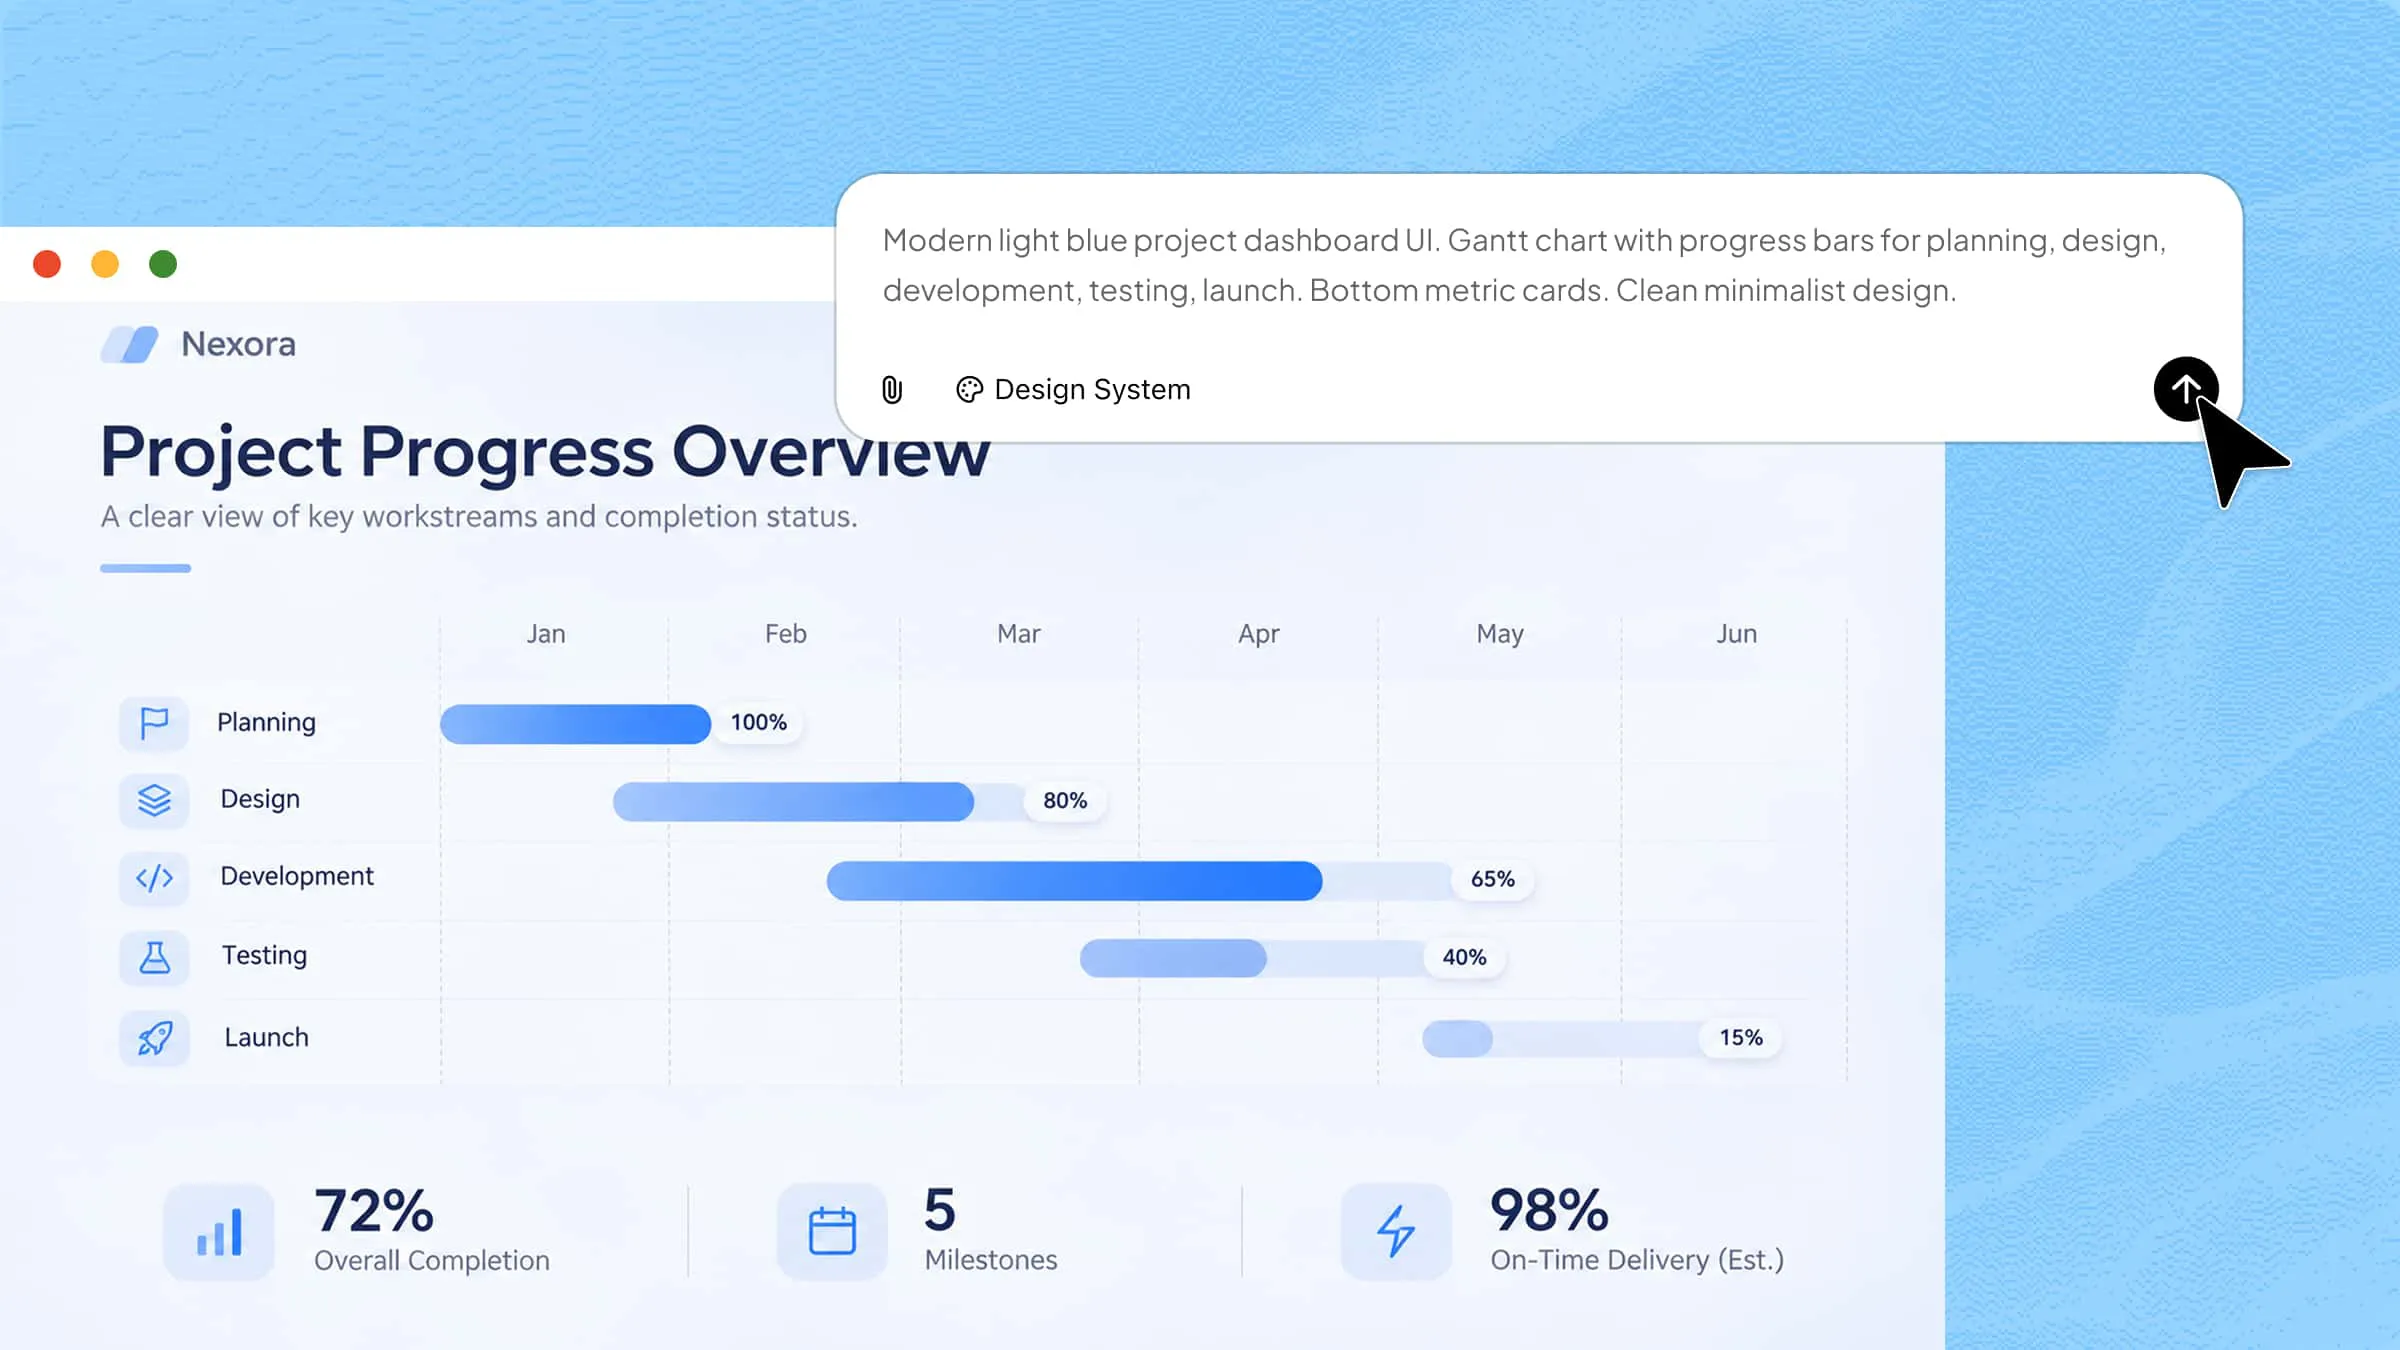
Choose an infographic type for your content
Statistical infographics
Use charts, graphs, and visual highlights to present numbers, percentages, and survey results. They make complex data easier to interpret.
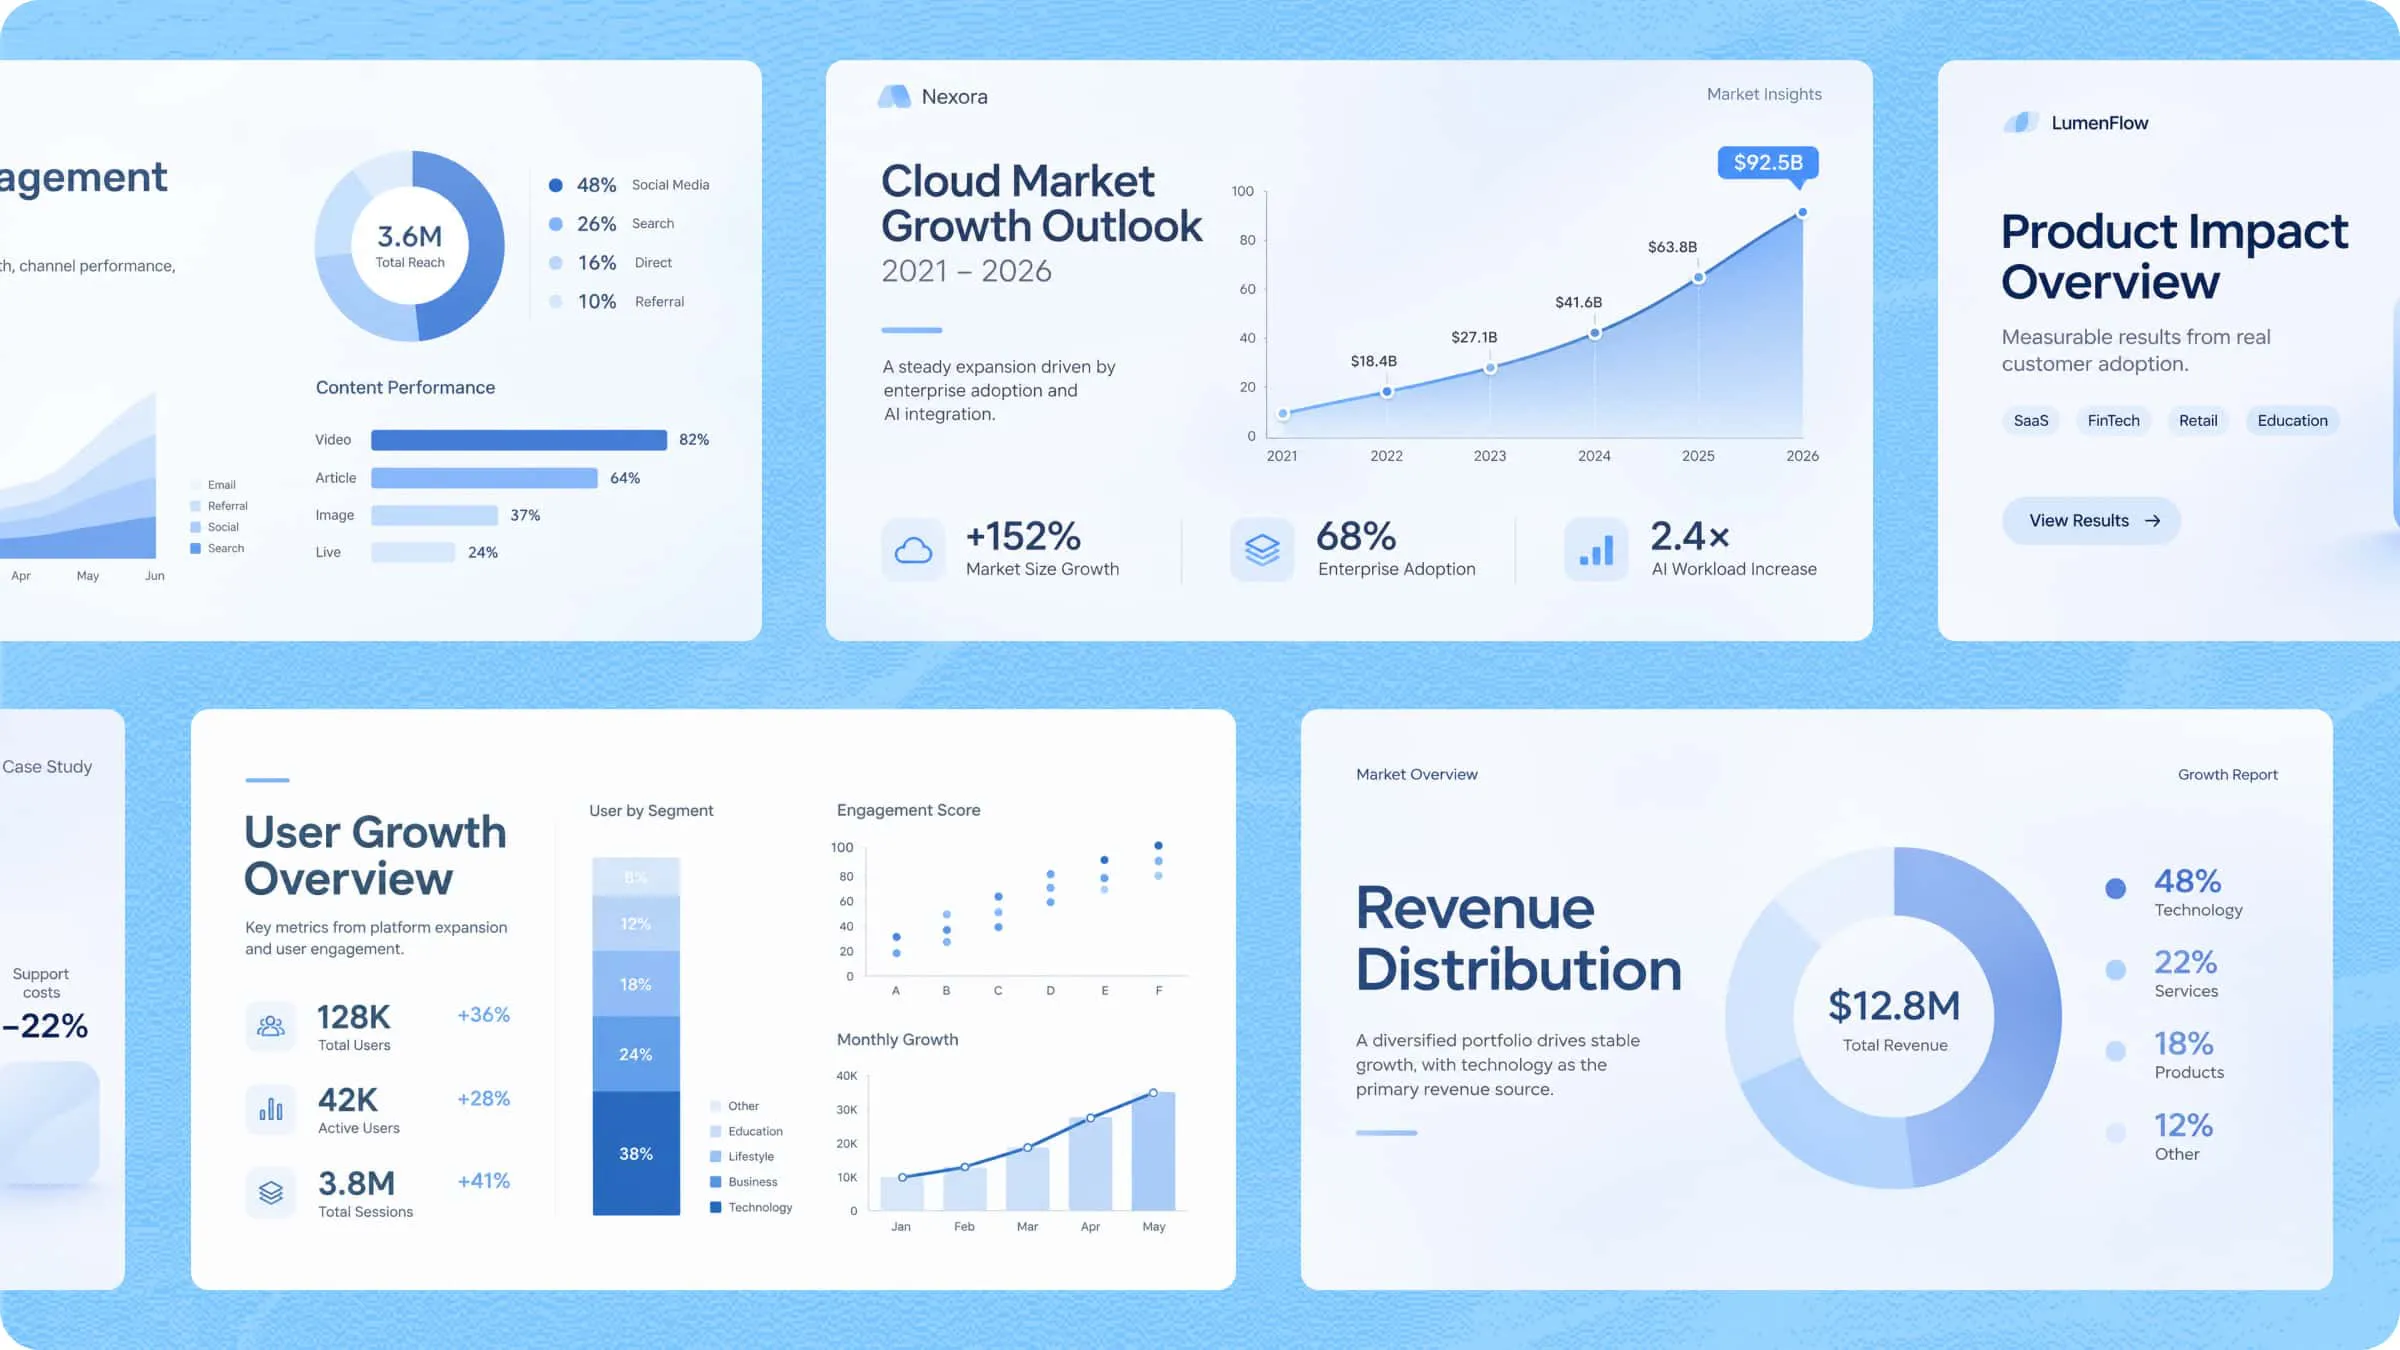
Statistical infographic with charts and graphs created using a free infographic maker
Comparison infographics
Place two or more products, services, or options side by side. Highlight their key features and differences to help readers compare them.
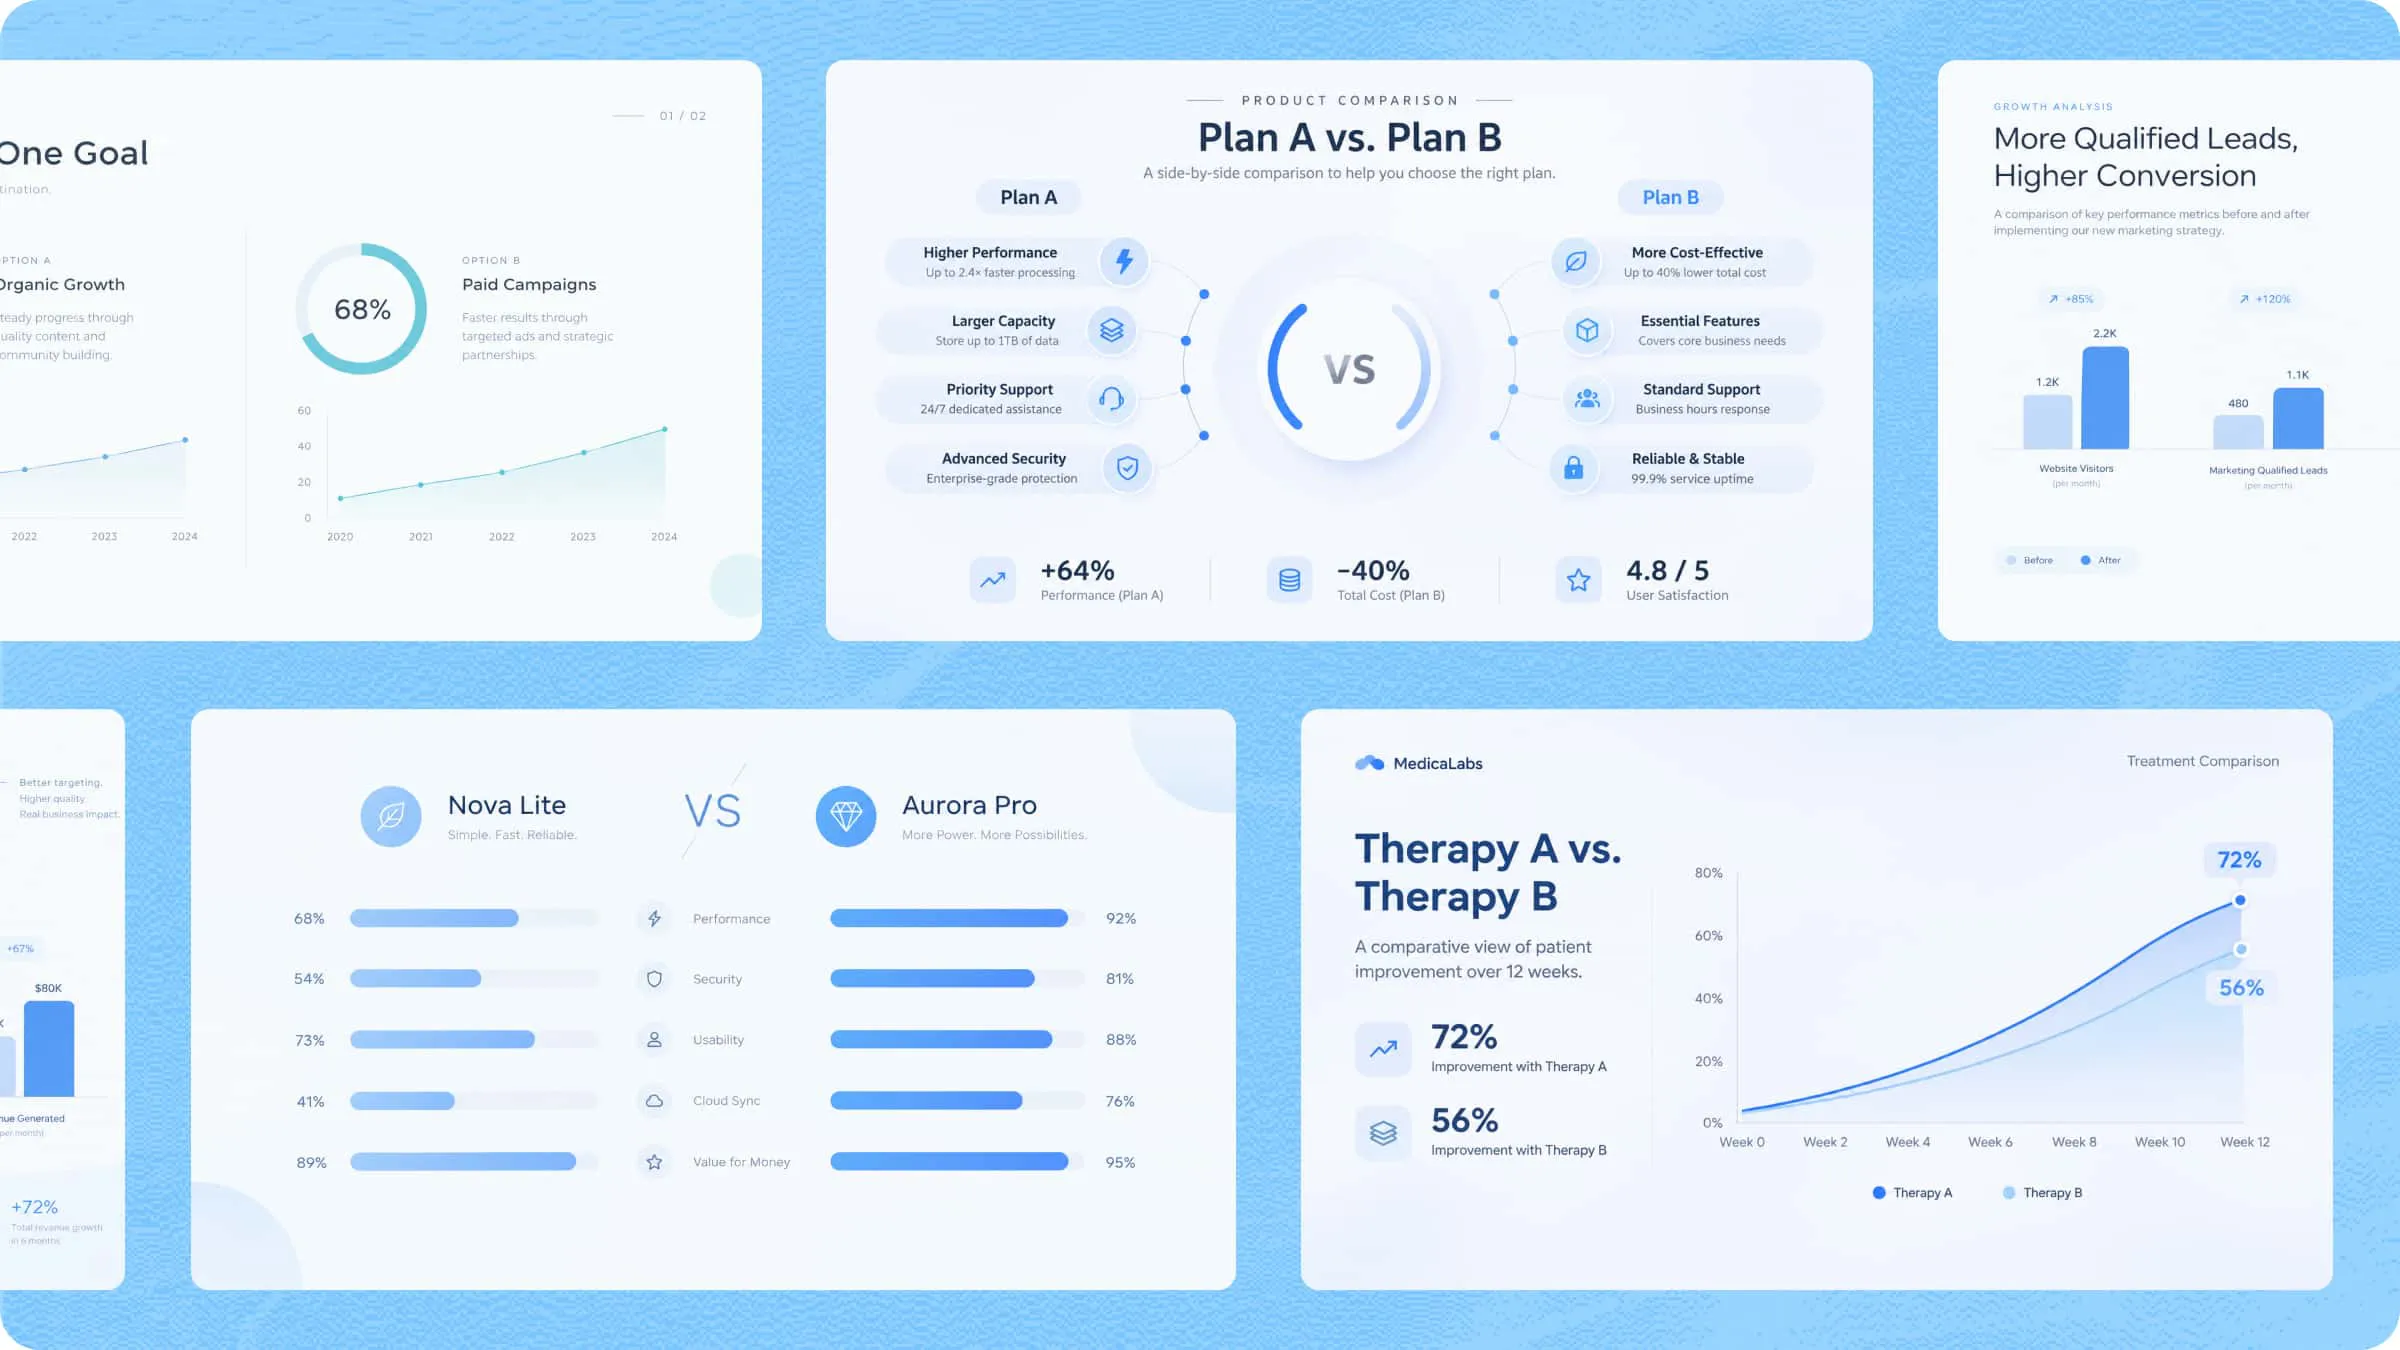
Comparison infographic presenting product features and differences side by side
Timeline infographics
Arrange events, milestones, or historical developments in chronological order. Show how activities, ideas, or projects progress over time.
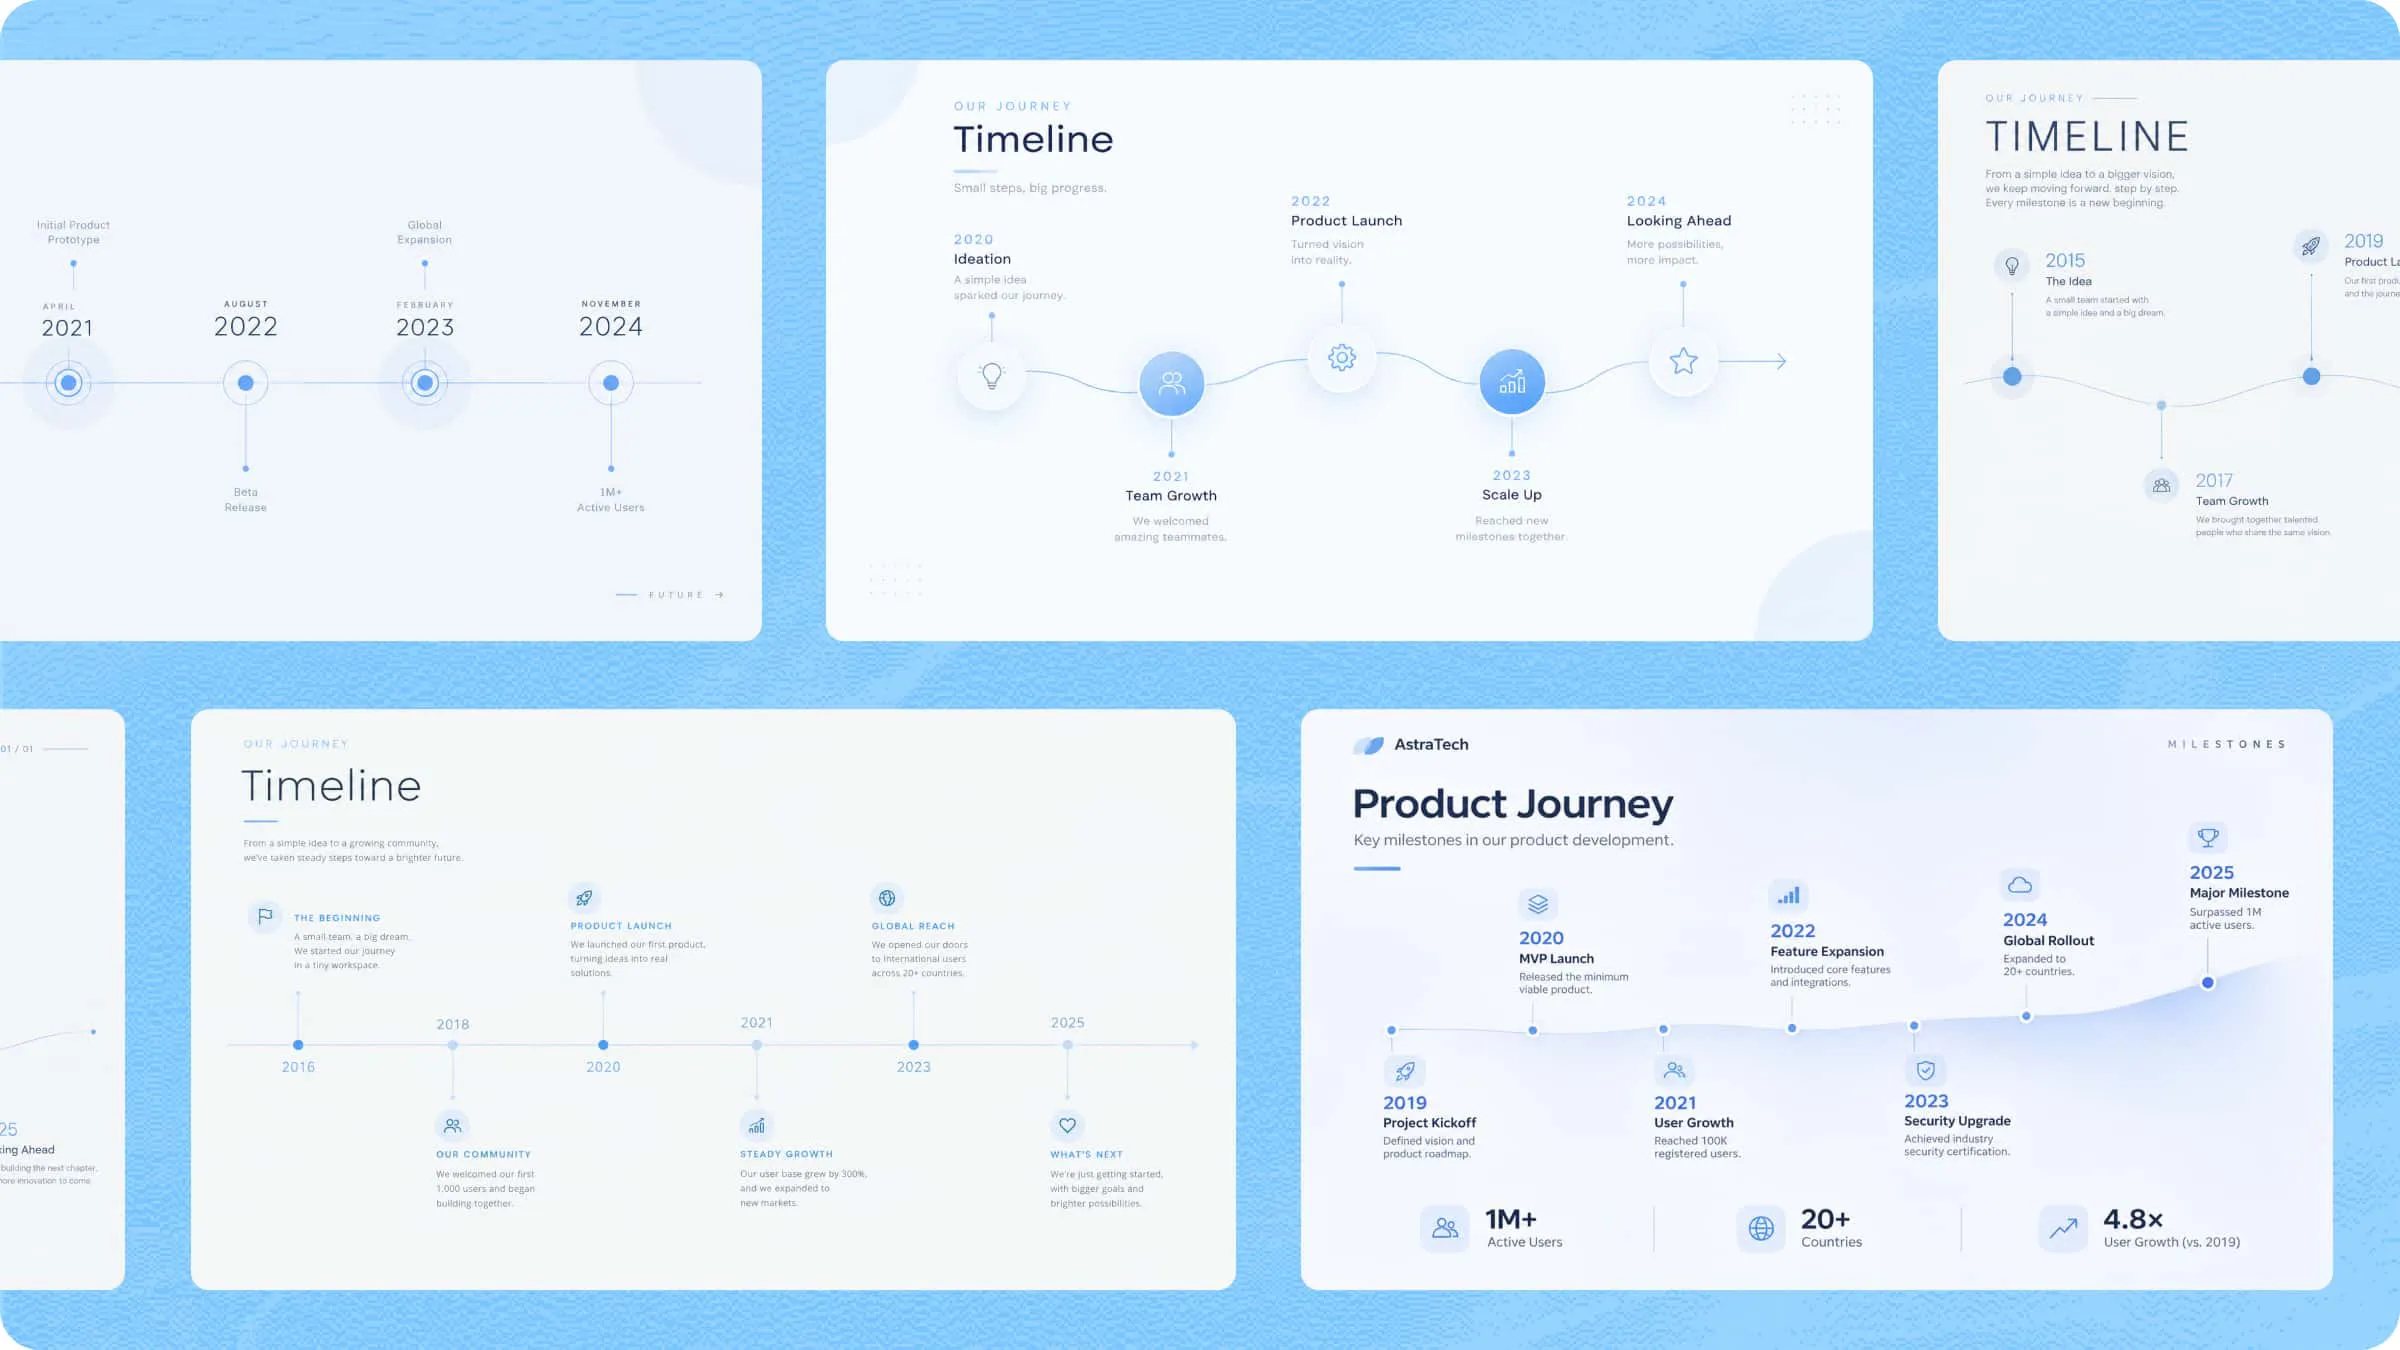
Timeline infographic showing events and milestones in chronological order
Process infographics
Break workflows, instructions, or procedures into connected steps. Guide readers through each stage using arrows, labels, and simple visuals.
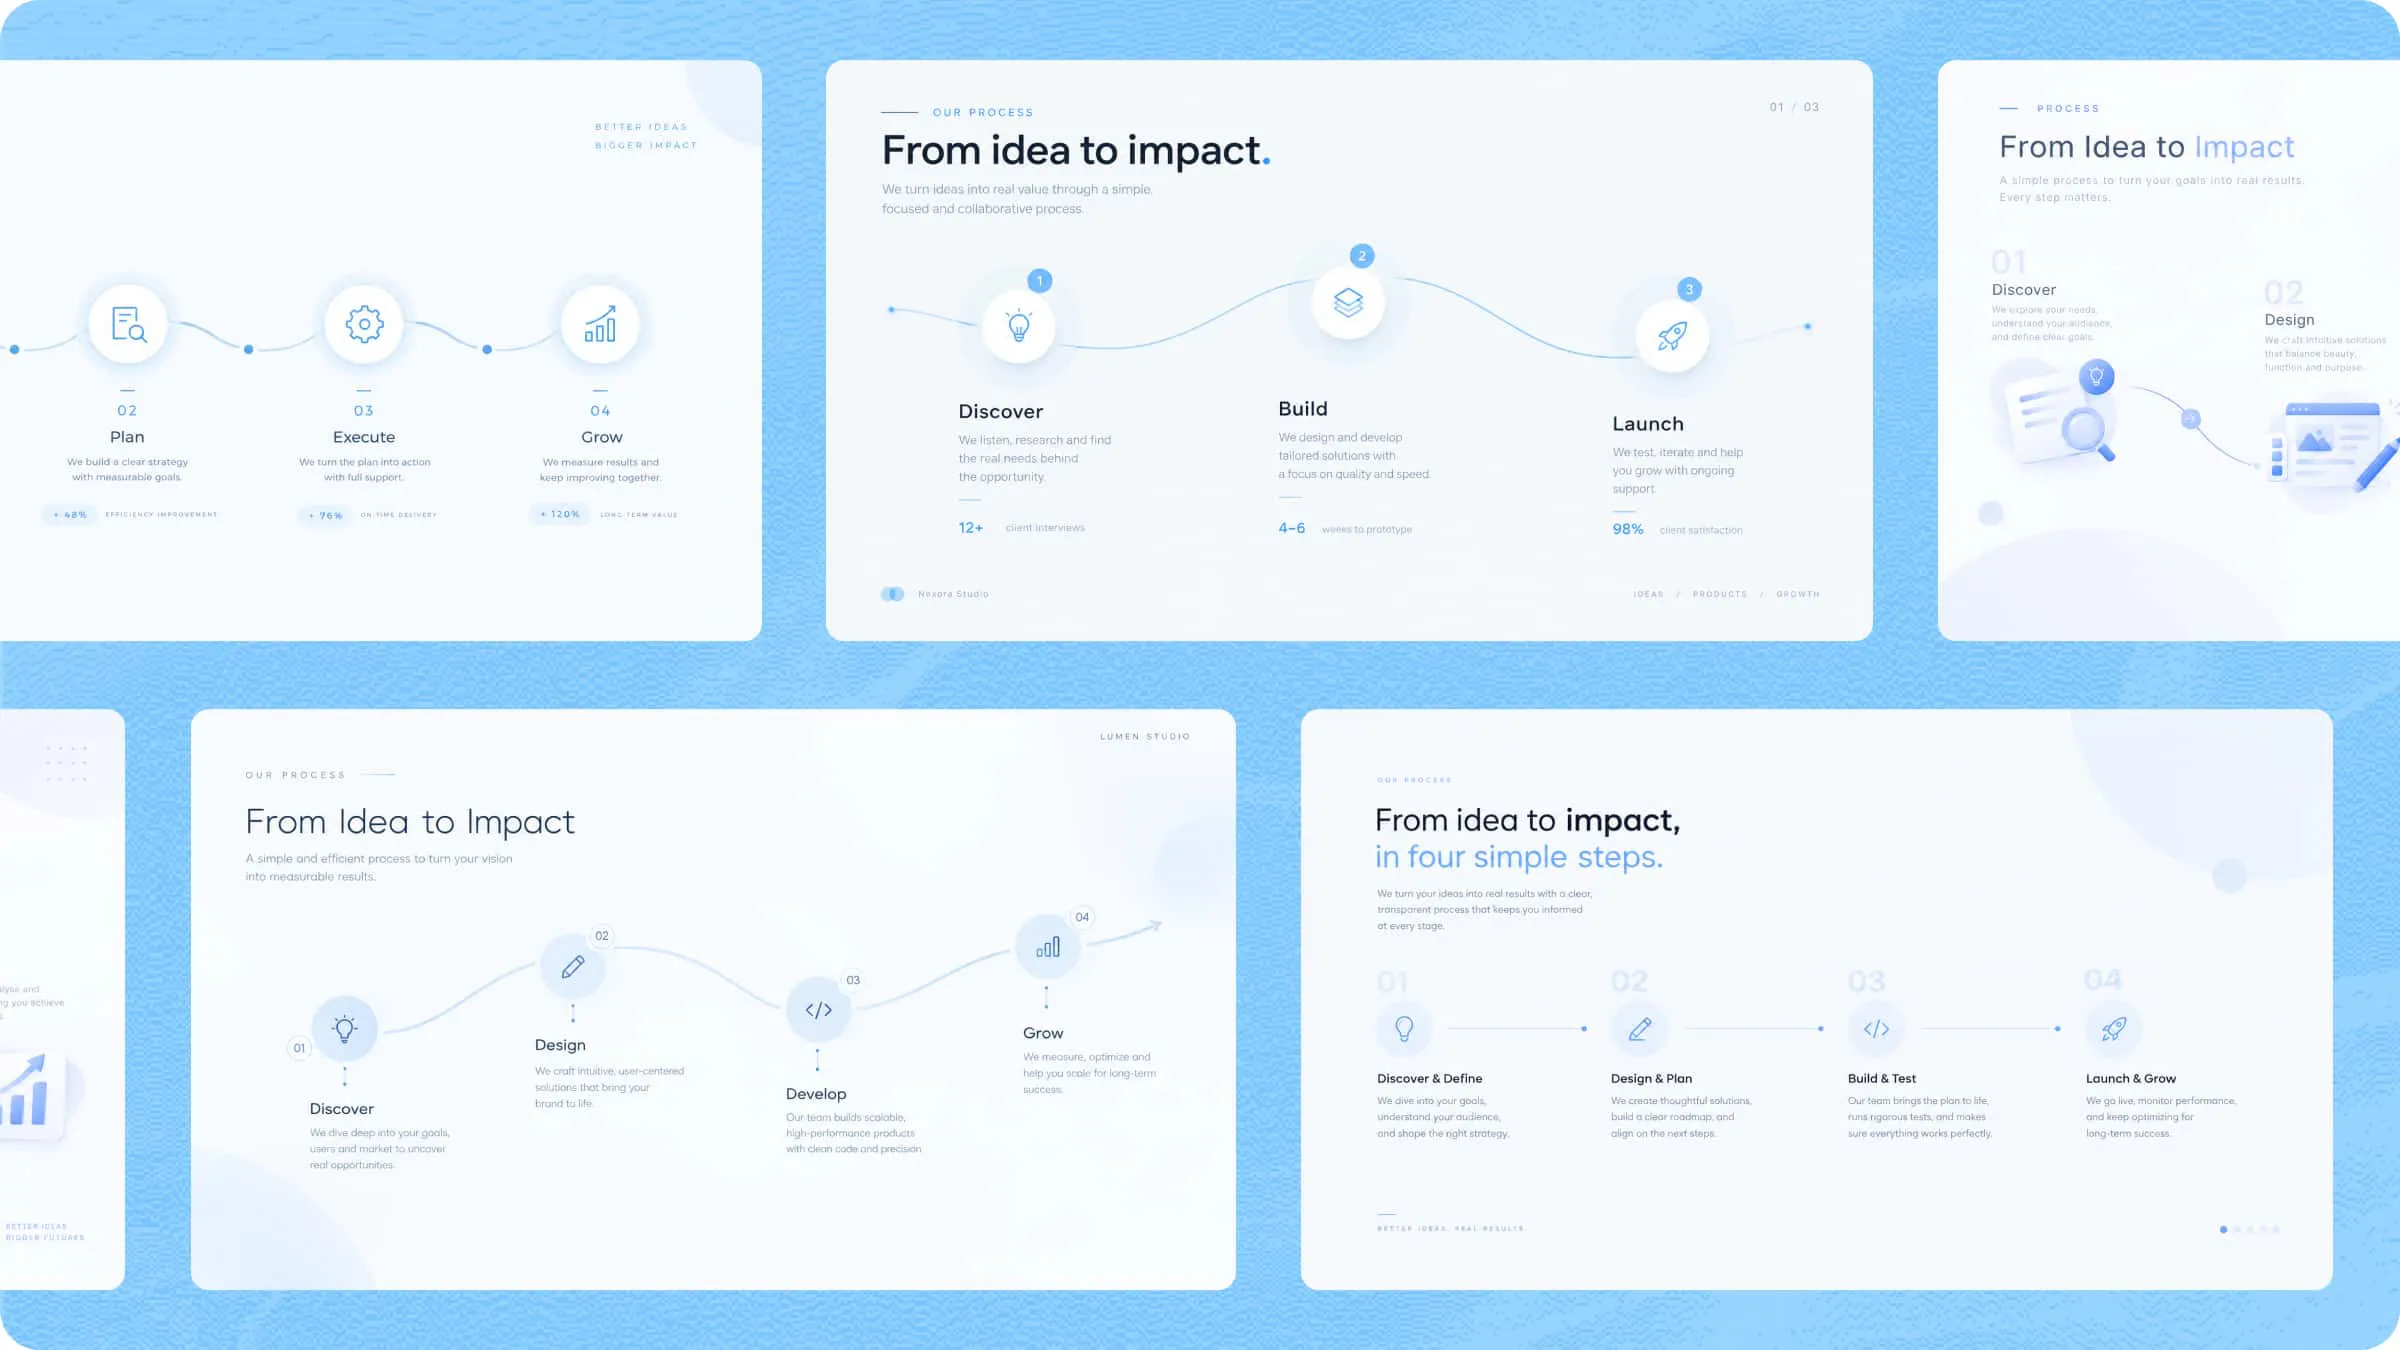
Process infographic illustrating connected steps with arrows and visual elements
List infographics
Organize tips, facts, rankings, or key points into structured visual lists. Help readers scan information quickly through numbers, icons, and short descriptions.
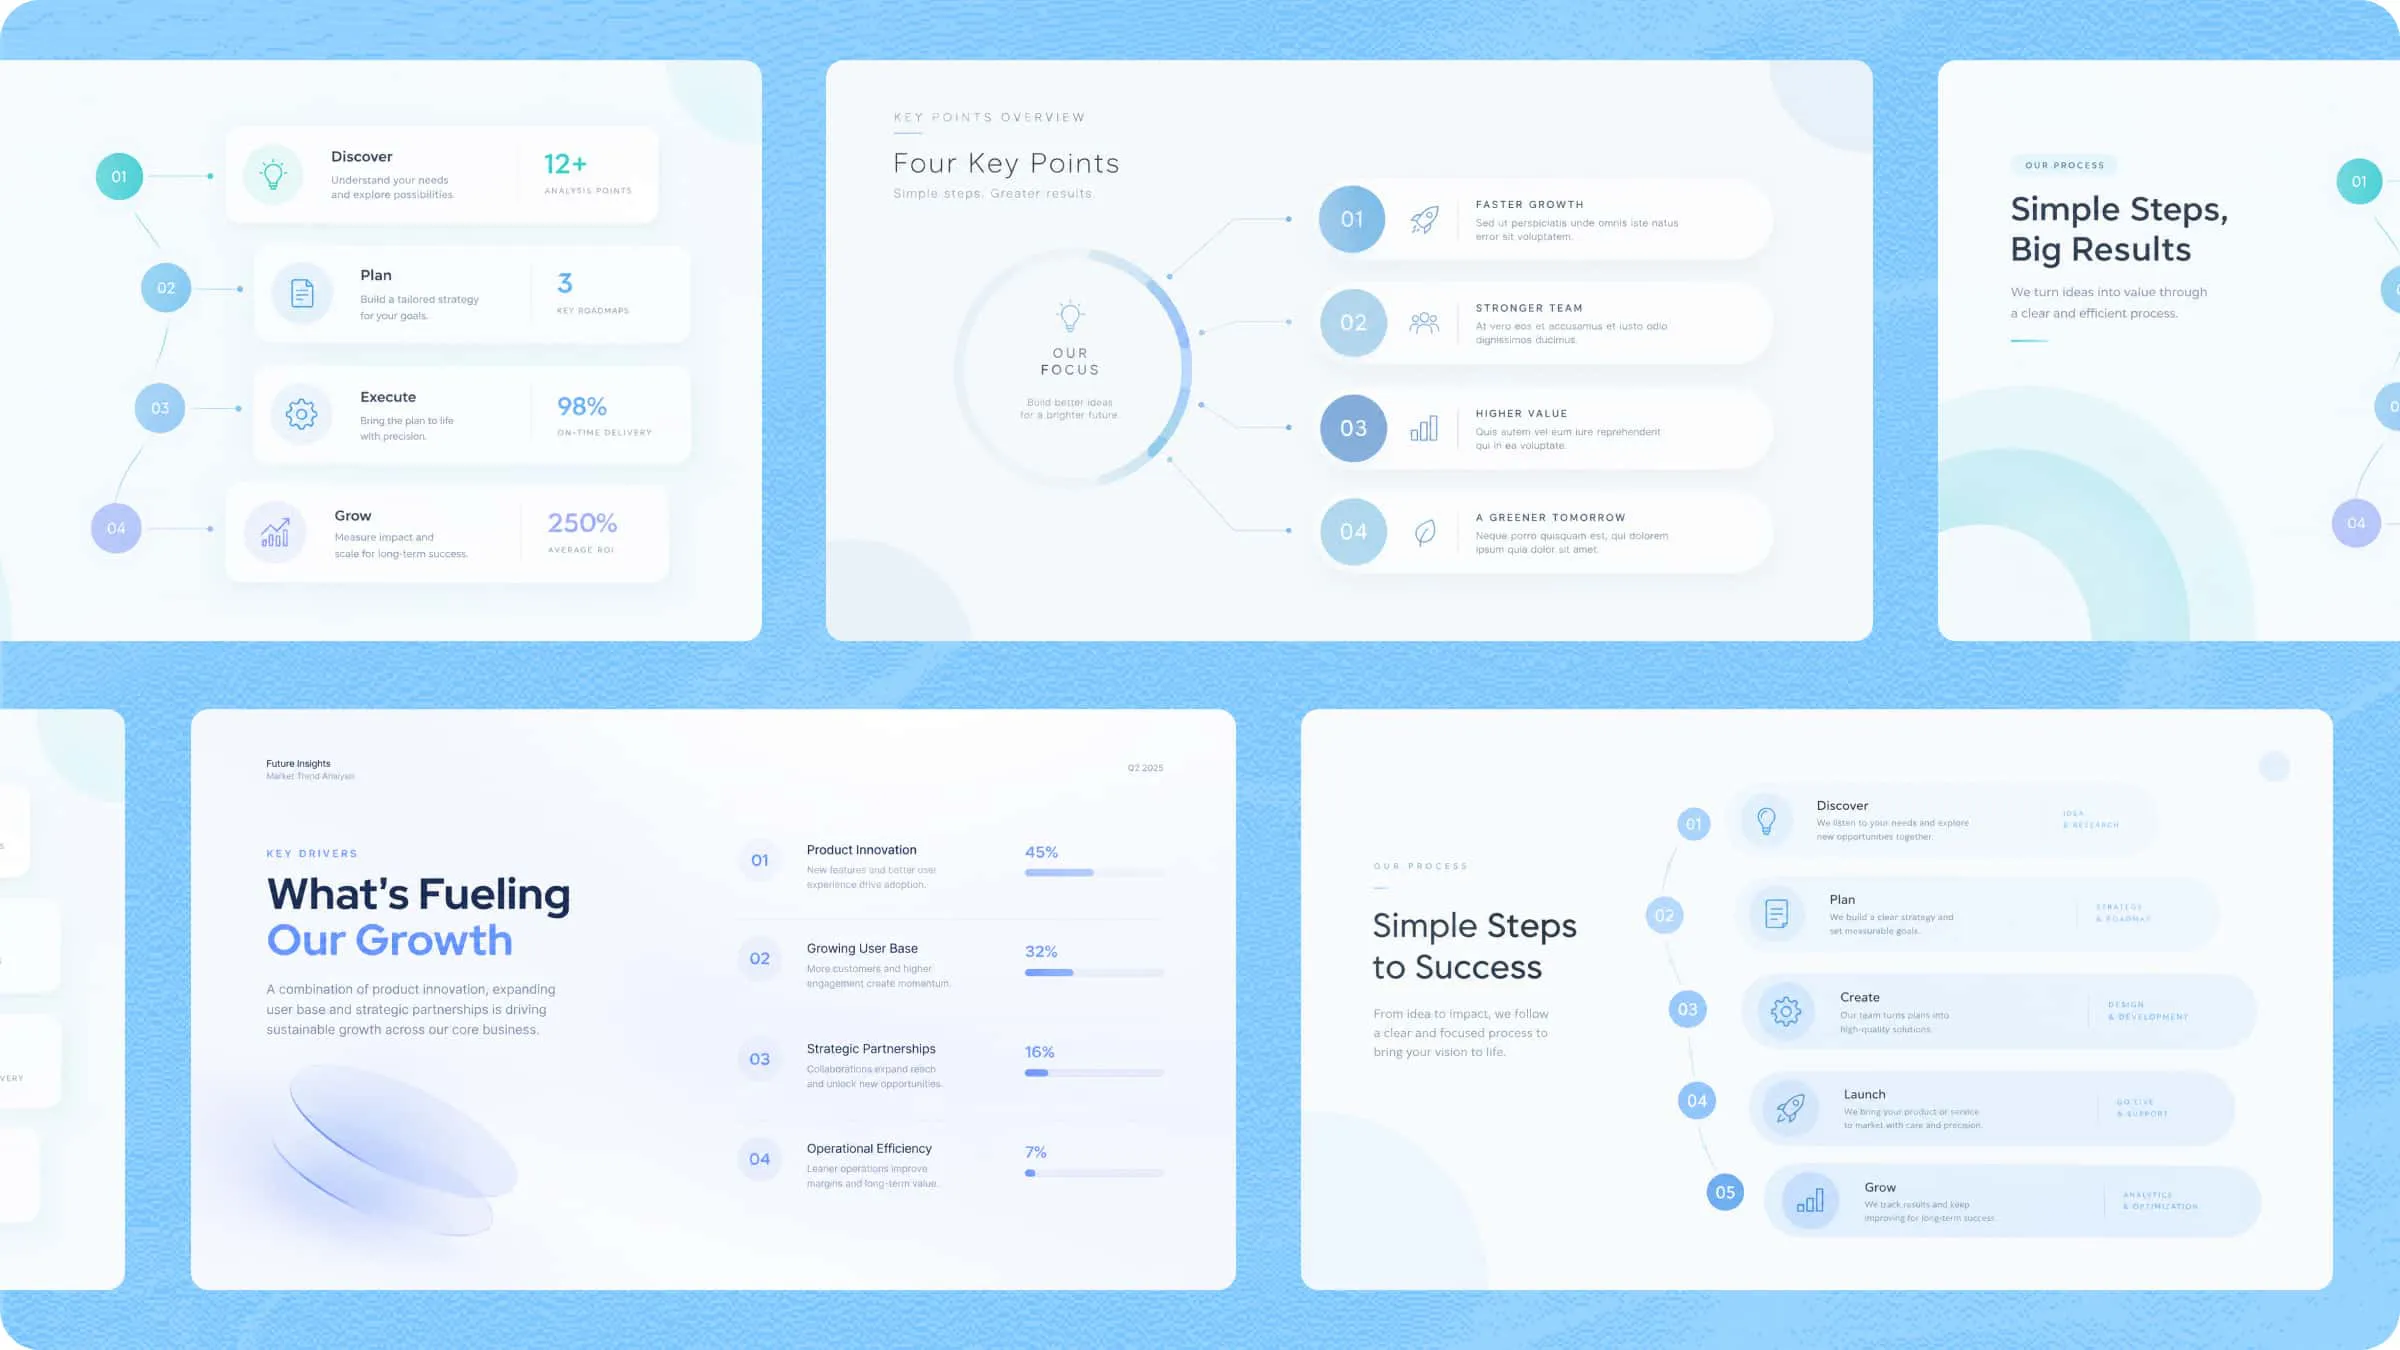
List infographic organizing tips and key facts with icons and numbers
Informational infographics
Explain a topic using concise text, icons, illustrations, and supporting facts. Present useful information in a clear layout that readers can follow easily.
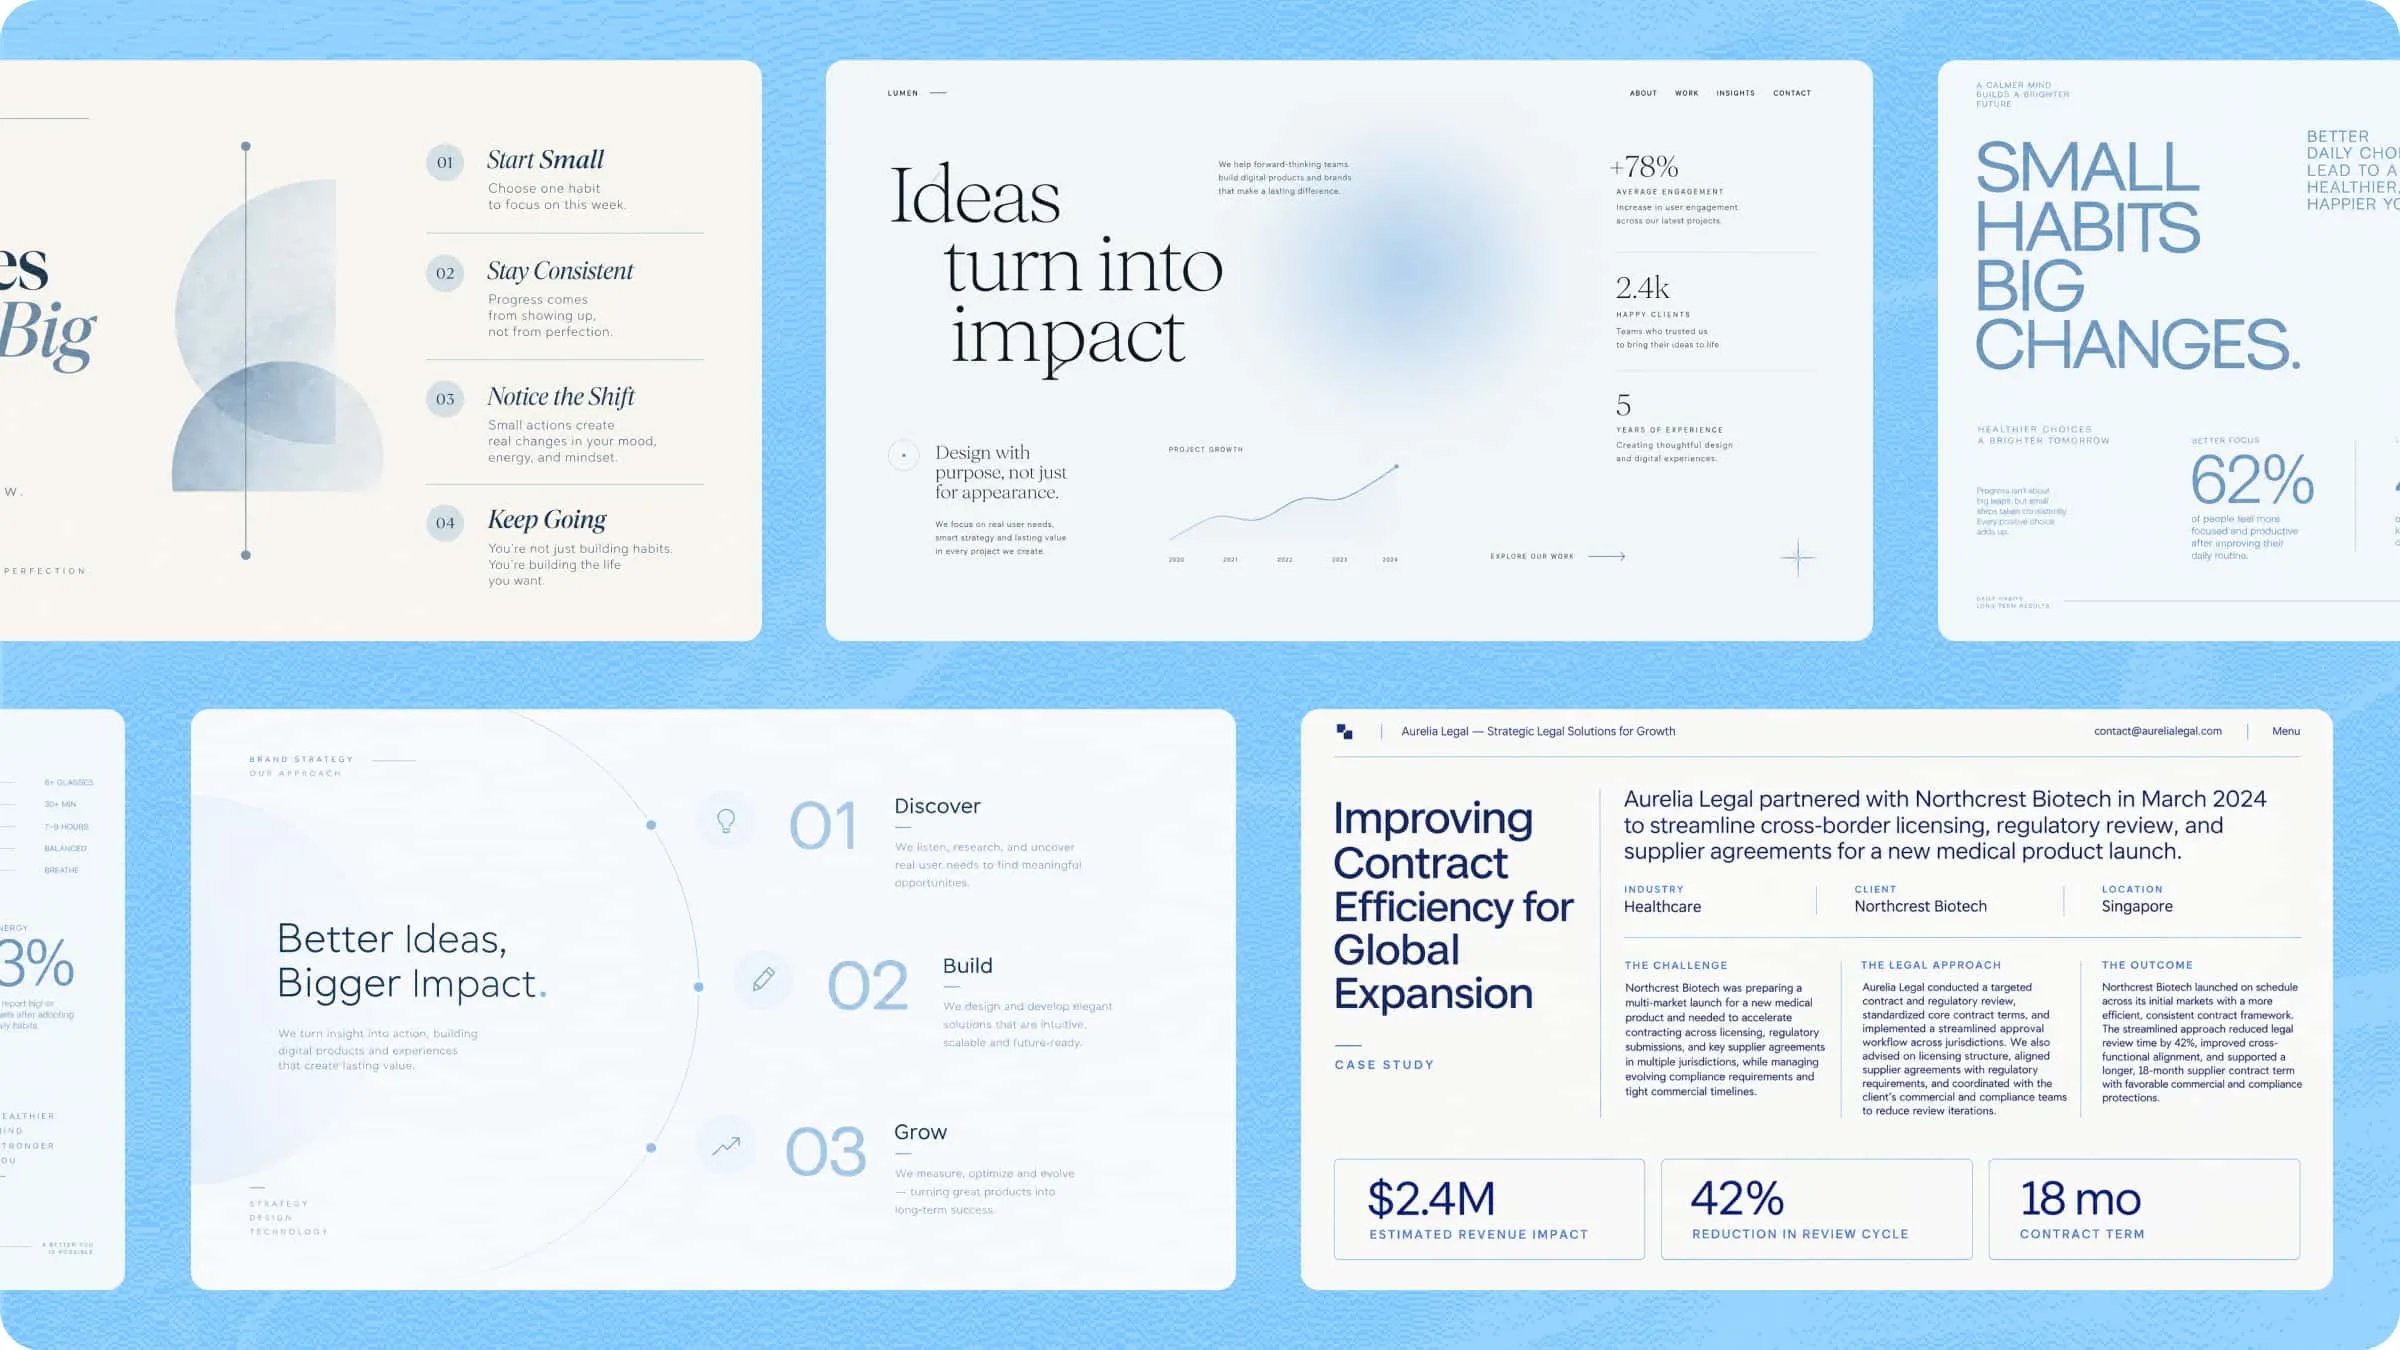
Informational infographic creator free design with icons, illustrations, and concise text
Use charts, graphs, and visual highlights to present numbers, percentages, and survey results. They make complex data easier to interpret.
Statistical infographic with charts and graphs created using a free infographic maker
Create engaging infographics with Kimi Design
Generate infographics from prompts and references
Upload documents, images, or visual references, and describe your requirements in a text prompt. Kimi Design uses your input to organize key information into clear visual layouts, making complex topics easier to understand.
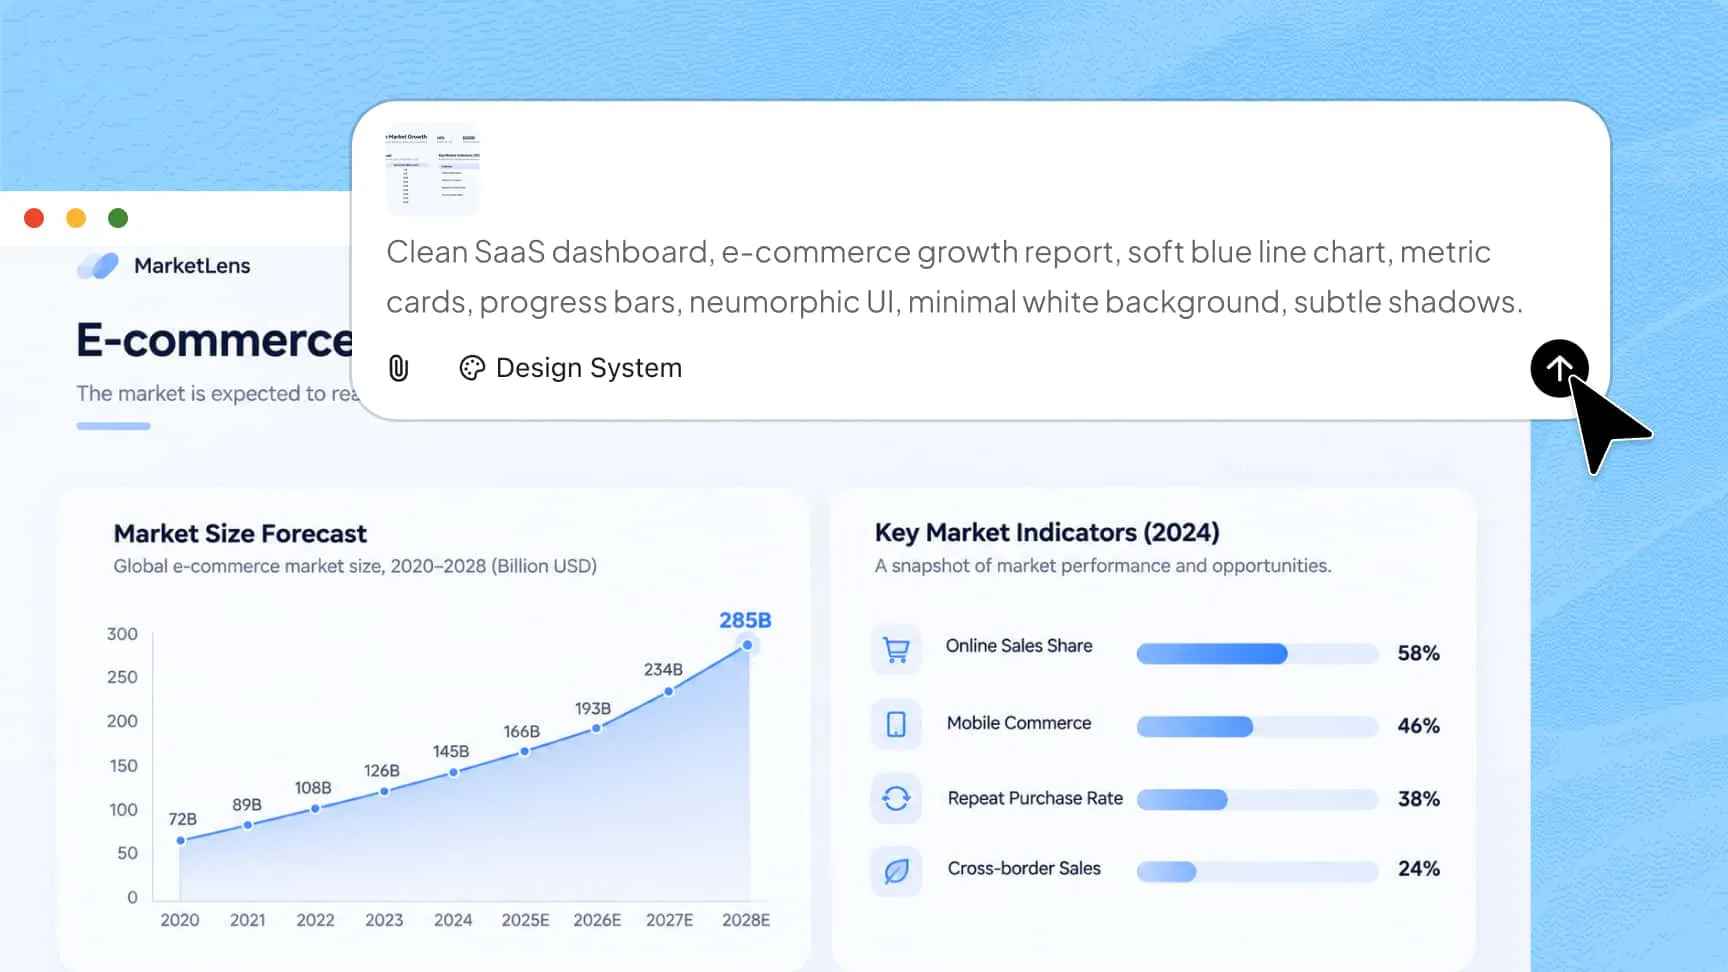
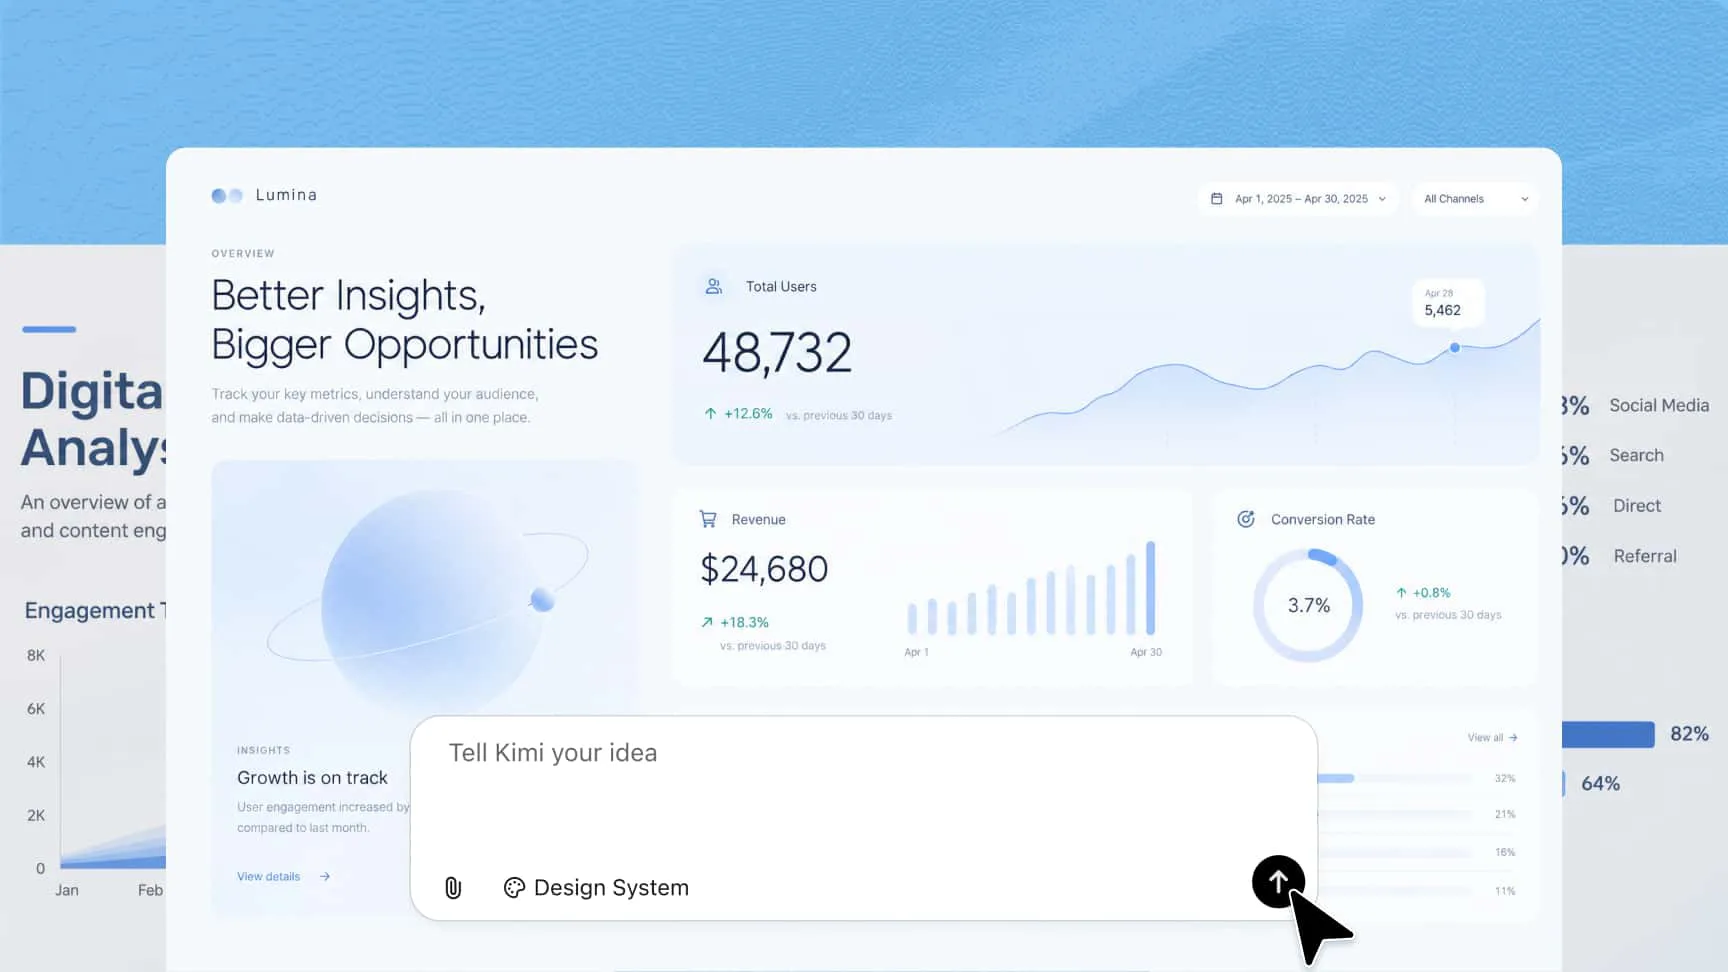
Visualize complex data with customizable charts
Transform raw data into easy-to-understand visuals using bar charts, line graphs, and pie charts. With this infographic chart creator, you can customize chart colors and styles to highlight key statistics, illustrate trends, and make data comparisons easier.
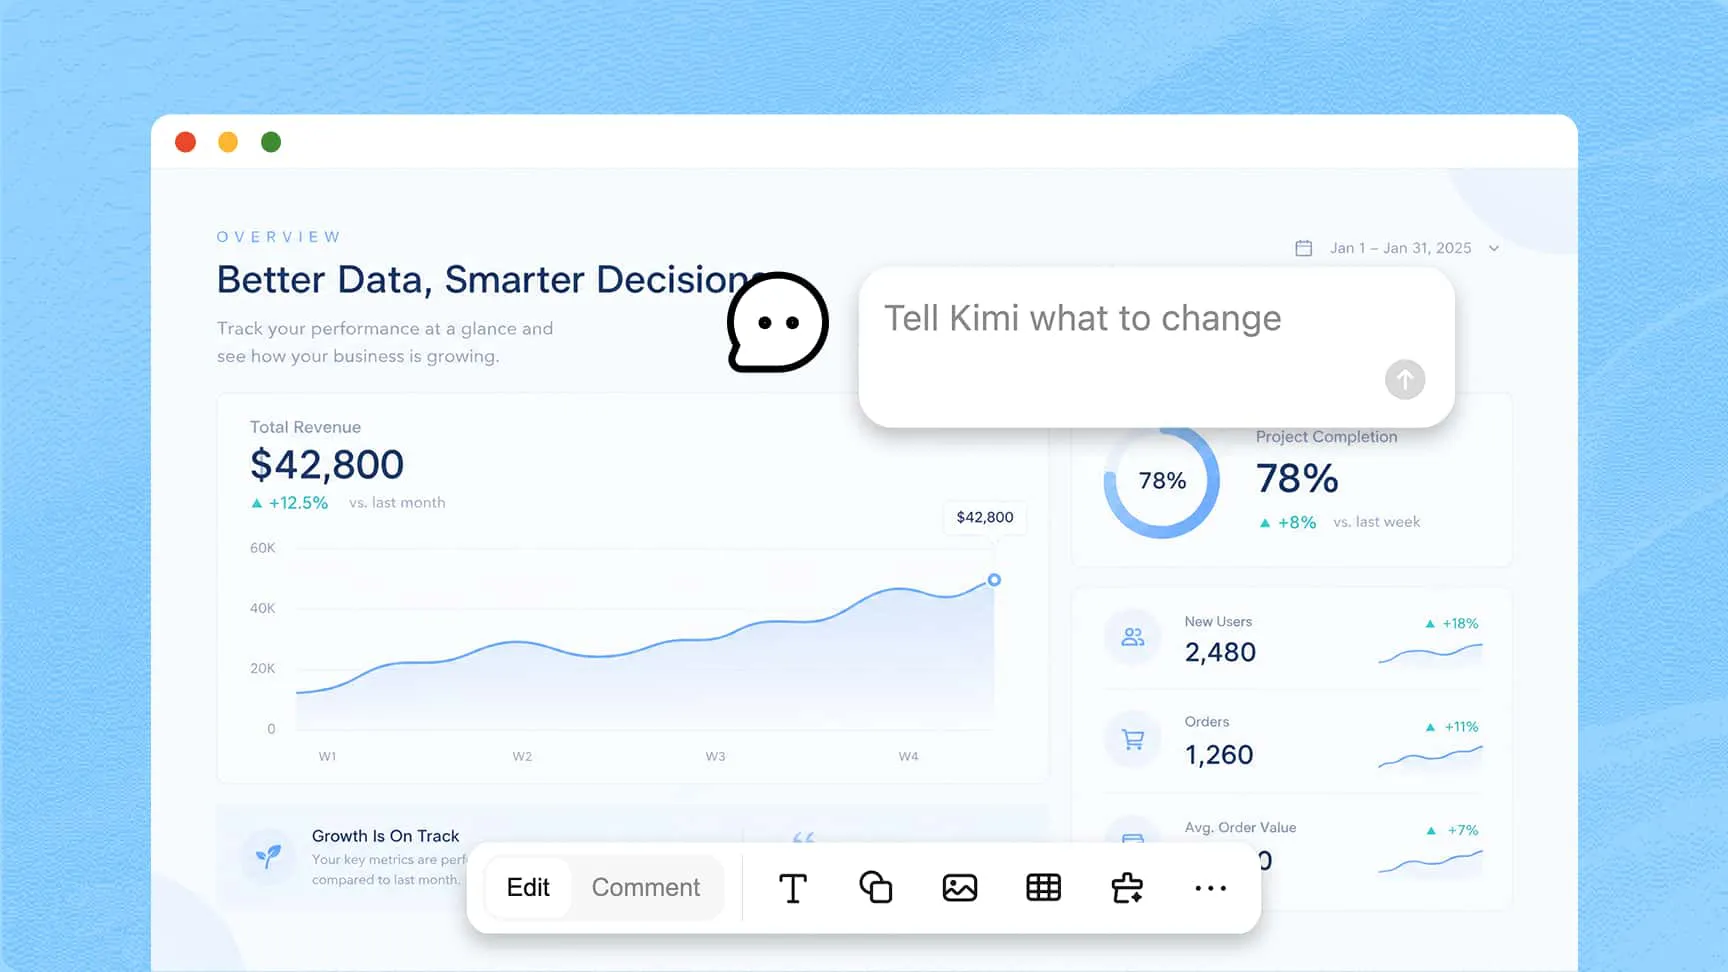
Refine infographic designs with flexible editing tools
Adjust generated designs through conversational prompts or direct canvas editing. Modify text, fonts, colors, images, icons, backgrounds, and element positions to create infographics that align with your content, visual preferences, and brand identity.
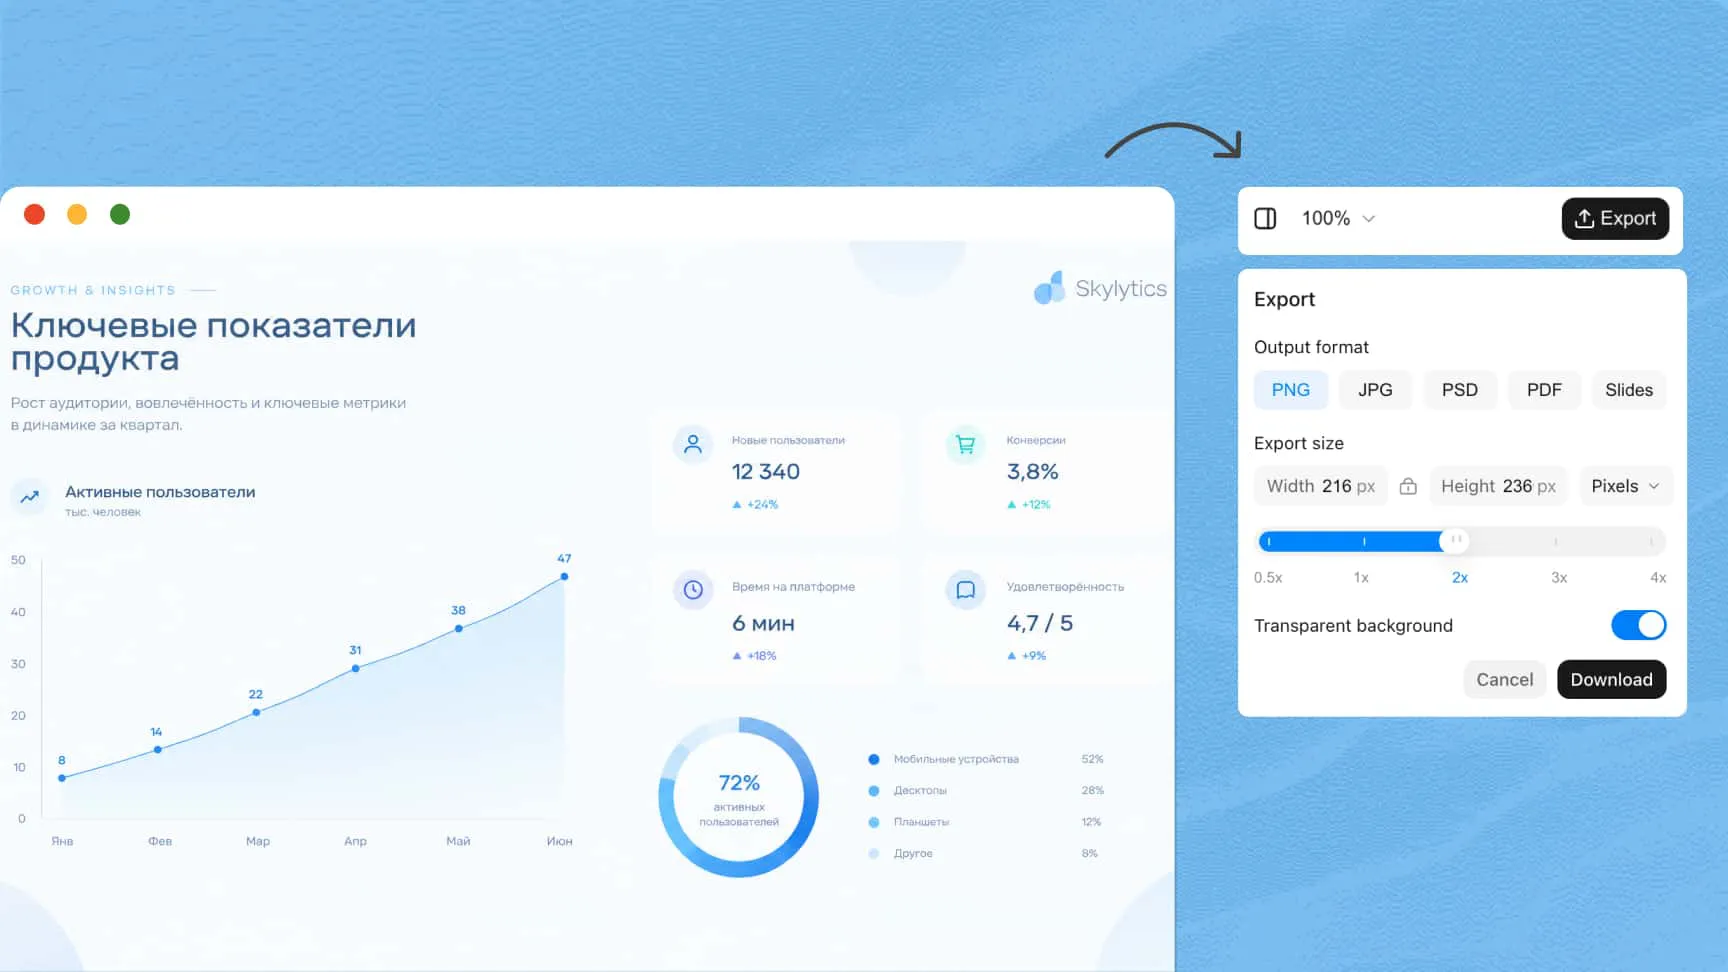
Multiple export formats for different uses
Export designs in PNG, JPG, PSD, PDF, or PPTX formats for different creative and professional needs. PNG and JPG support custom export sizes in pixels or centimeters, while PNG also offers a transparent background option. PSD keeps text and design elements as editable layers for easy sharing and further editing. PDF and PPTX are suitable for reports, presentations, and other professional materials.
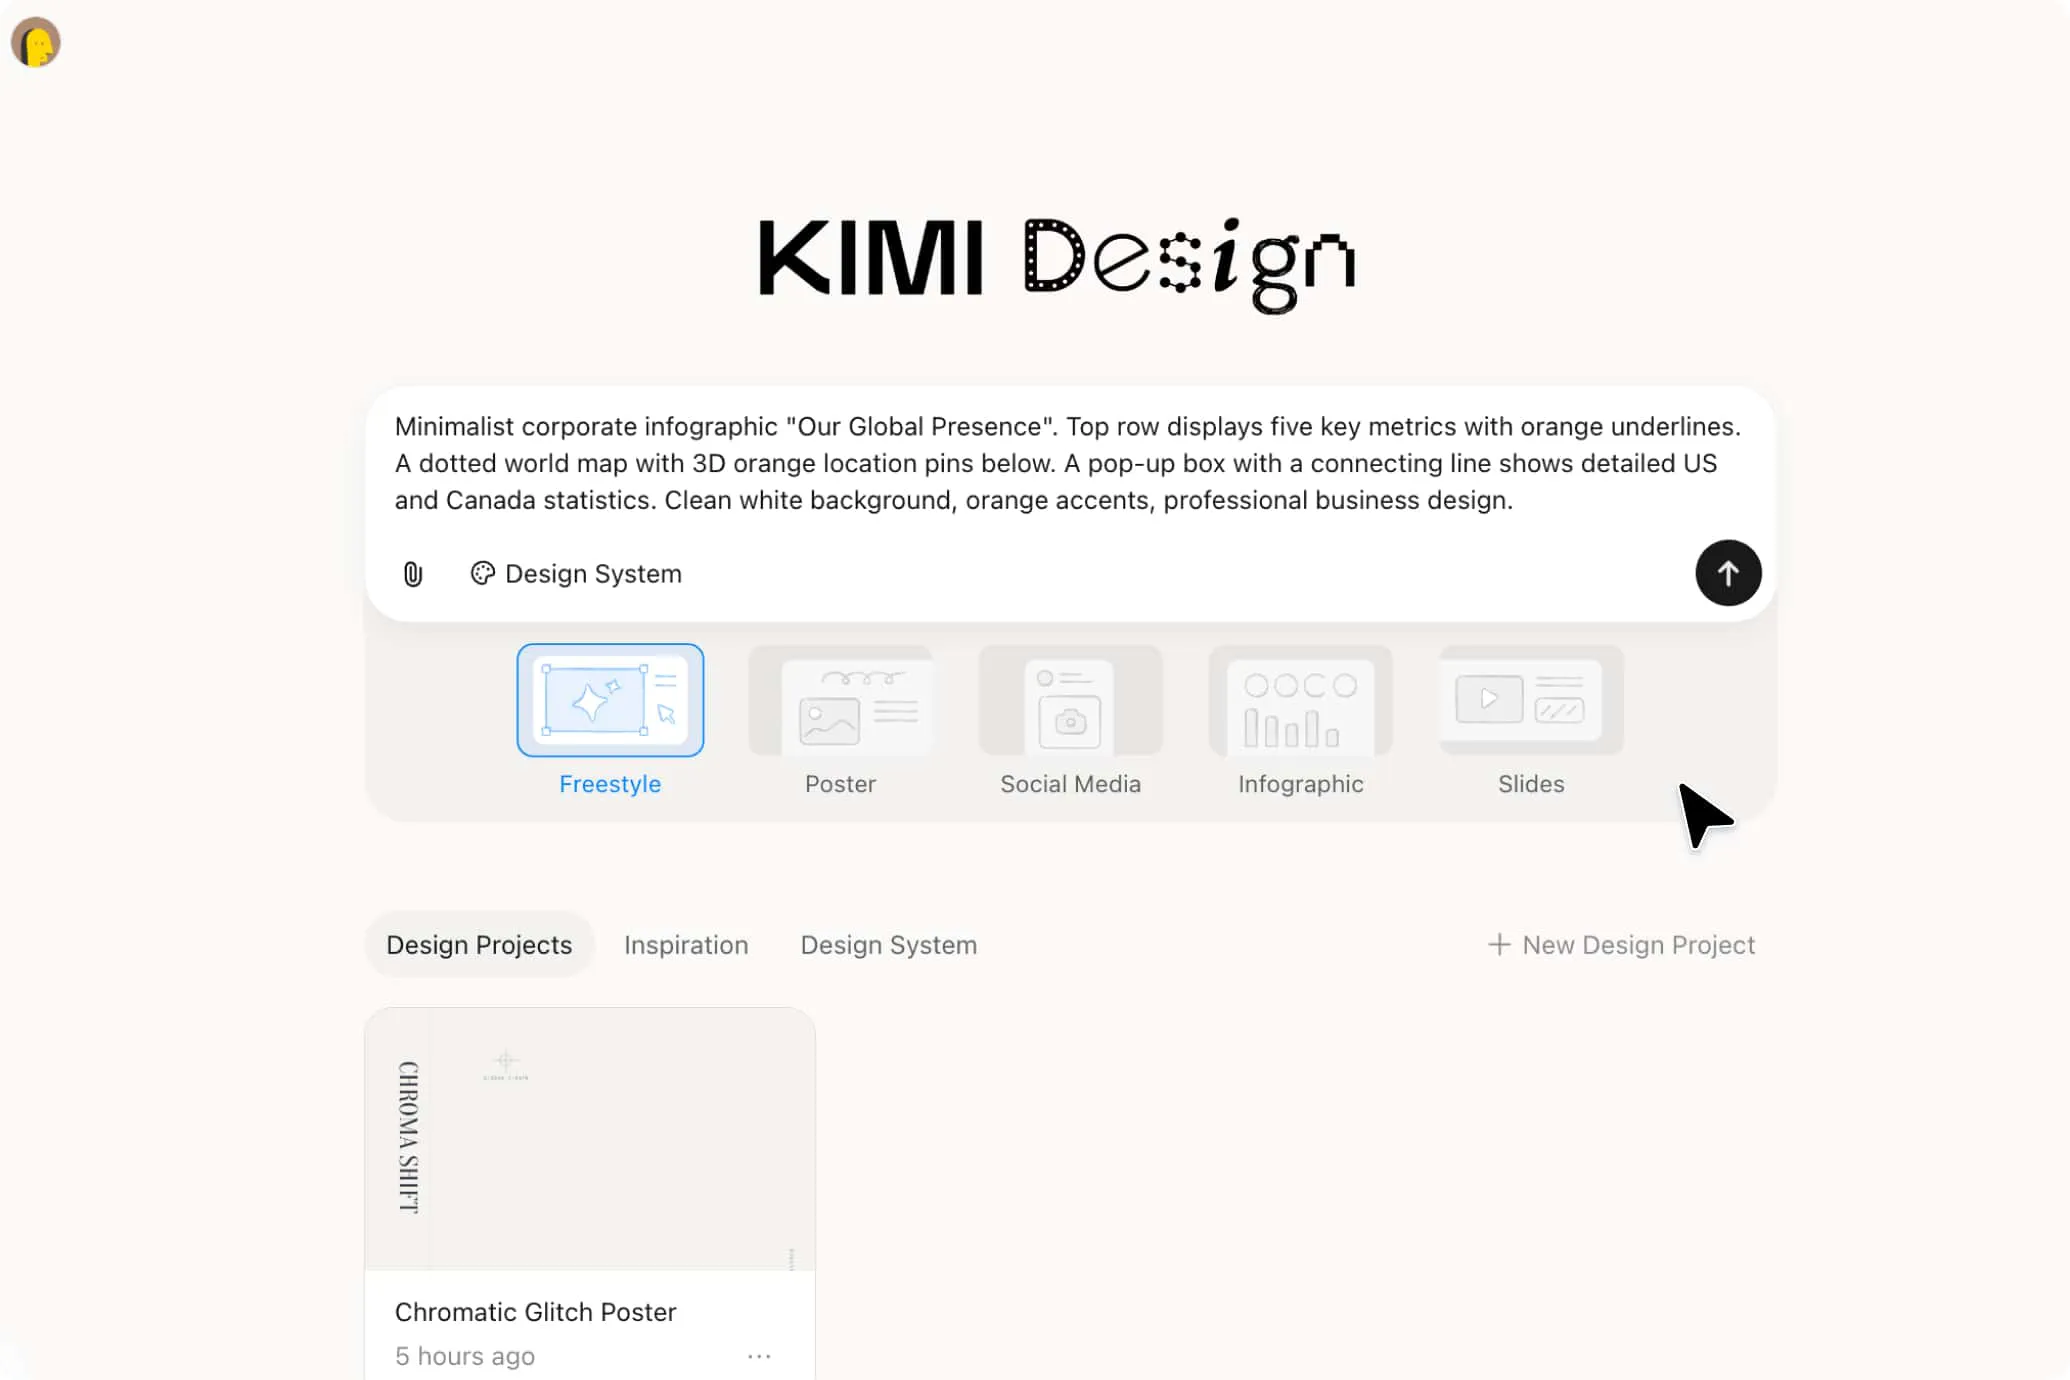
How to create an infographic with Kimi Design
Step 1: Upload your information content and describe your idea
Upload documents, images, or visual references, and enter a prompt describing your infographic topic and key message.
Step 2: Customize your infographic design flexibly
Refine the generated layout with prompts or canvas editing. Adjust text, charts, colors, images, and other elements to suit your needs.
Step 3: Download and share your infographic
Review the final design and export it in suitable format for use in social media, presentations, reports, newsletters, or print materials.
Use cases for infographic creation

Business reports
Present business metrics, performance results, and key findings in a clear visual format. An AI infographic creator helps turn complex figures into accessible graphics that make reports and presentations easier to understand.

Marketing campaigns
Showcase product features, promotions, and campaign results through engaging visuals. Infographics can be adapted for social media posts, promotional emails, and marketing presentations.

Educational materials
Break down complex subjects, summarize lessons, and highlight essential facts with visual learning resources. An infographic creator makes educational content easier to follow and helps learners retain key information.

Social media content
Share tips, statistics, announcements, and other useful information in a visually appealing format. Infographics are well suited to posts, stories, and content across different social platforms.

Research reports
Turn survey results, statistical findings, and research insights into charts and visual summaries. An infographic design maker helps readers identify key trends and understand complex data more easily.