Creating a flowchart in PowerPoint can be frustrating when you're unsure which shapes to use or how to connect them neatly, quickly turning a simple process into a cluttered slide. Fortunately, there are several simple ways to make the process easier. In this article, you will learn three methods for creating a flowchart in PowerPoint.
Overview of 3 methods to create flowcharts in PowerPoint
You can choose your approach based on how much control you want over the flowchart and how quickly you want to create it. If you want AI to handle the structure and design, start with the Kimi Slides method. If you prefer PowerPoint's own tools, continue with SmartArt for a ready-made layout or manual shapes for more control over each element.
| Kimi Slides | SmartArt | Manual Shapes | |
|---|---|---|---|
| How it works | Describe the process in natural language and let AI generate the flowchart | Choose a built-in layout and add your process steps | Add shapes, text, and connectors individually |
| Ease of use | Very easy | Easy | More difficult |
| Customization | High | Moderate | Very high |
| Time required | Short | Moderate | Long |
| Final result | Polished layout with consistent presentation design | Clean flowchart based on predefined layouts | Fully customized layout with more manual work |
| Suitable for | Quickly creating presentation-ready flowcharts | Simple, standard process diagrams | Complex flowcharts requiring precise control |
How to make a flowchart in PowerPoint using an AI tool
If you want a quicker way to build a flowchart, AI can take much of the manual work off your hands. Kimi Slides, an AI presentation maker, lets you describe the process you have in mind and turns it into a clear flowchart that fits naturally into a presentation. It is a simple option when you want to spend less time arranging shapes and more time refining your content. Follow the steps below to create your flowchart with Kimi Slides.
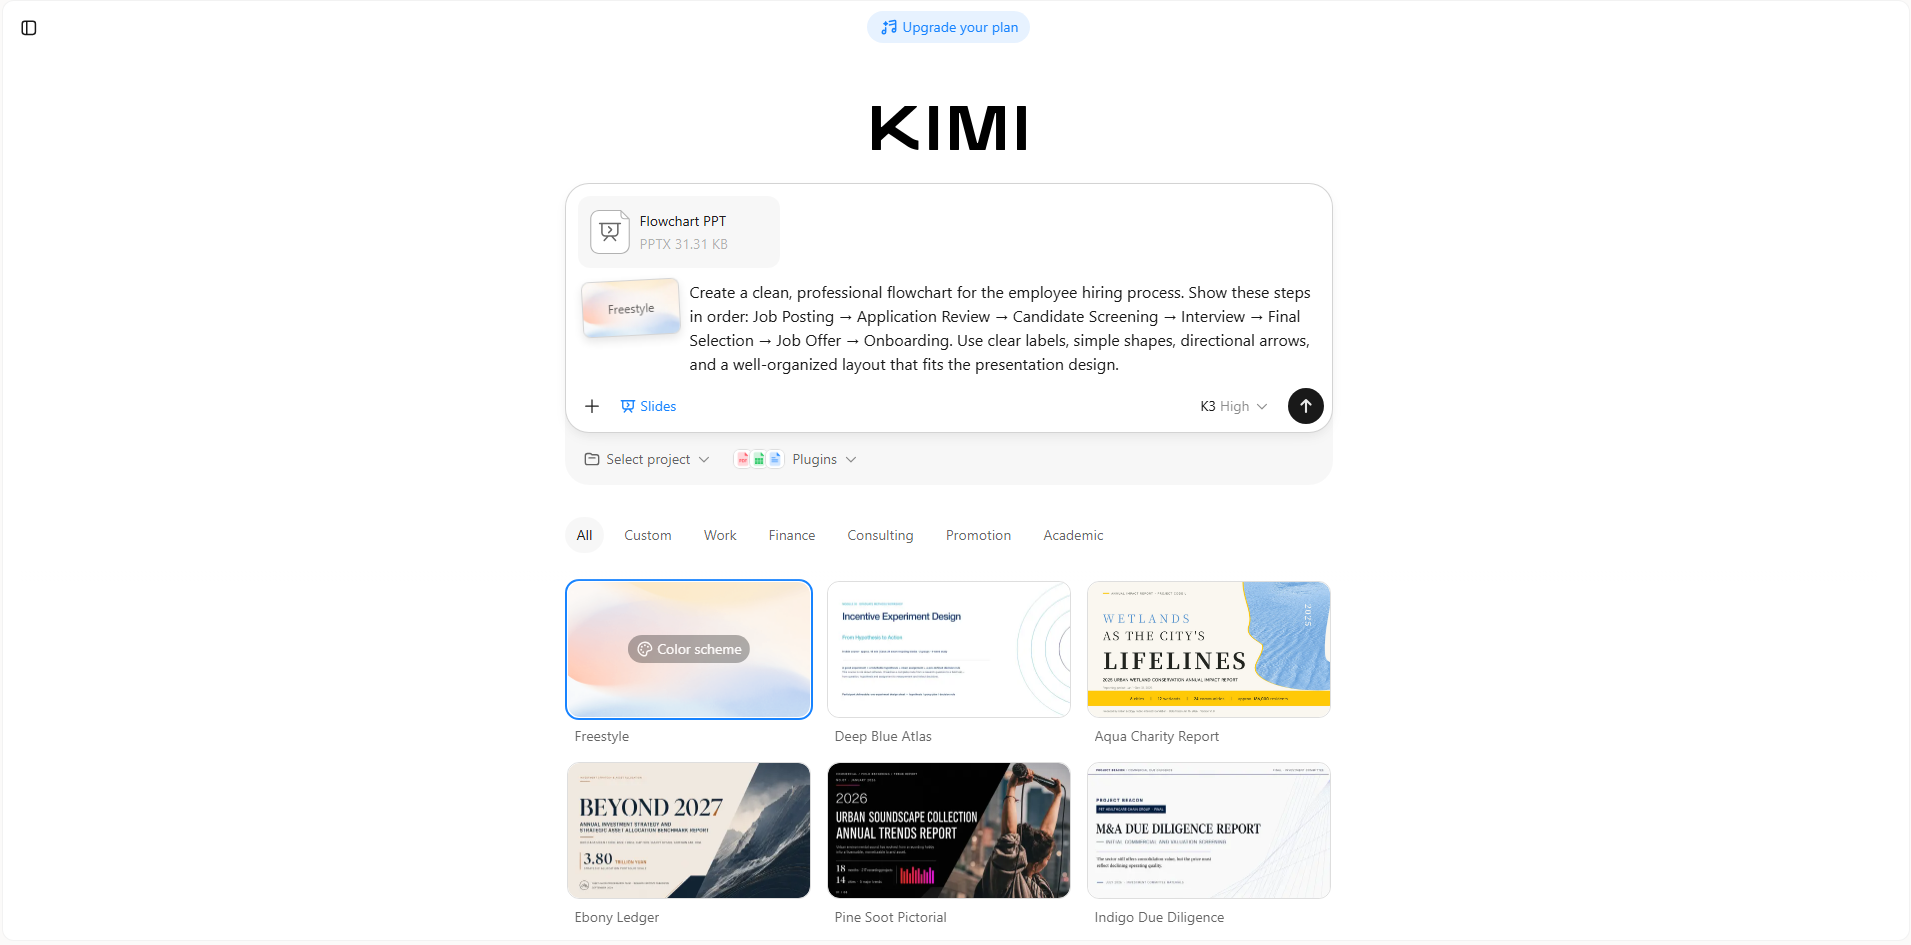
Step 1: Upload your PPT file and enter the prompt
Start by uploading your existing PowerPoint file to Kimi Slides. Then, enter a prompt that clearly describes the process you want to turn into a flowchart. For example, if you want to visualize a hiring process, you can use the following prompt:
Step 2: Let AI process and generate results
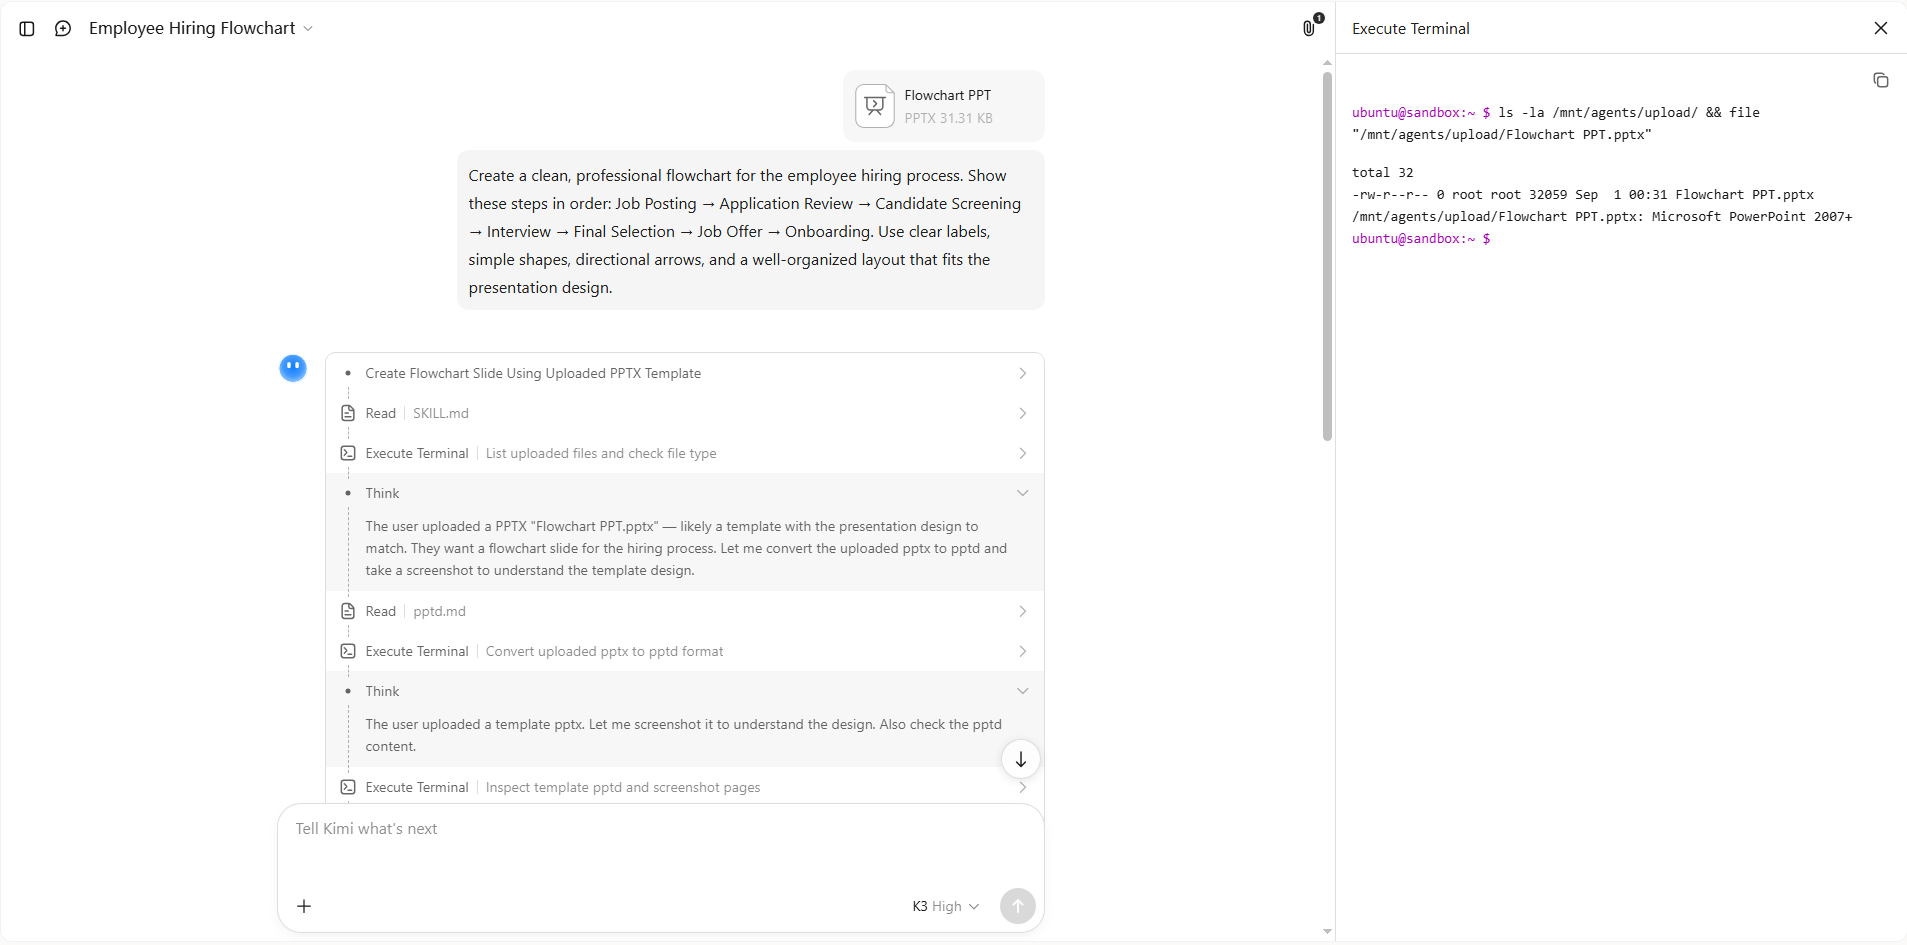
Once you submit the prompt, let Kimi Slides process your instructions and generate the flowchart. The AI will arrange the steps, shapes, and connections based on your description.
Step 3: Edit the PPT file
After the flowchart is generated, use "Edit" mode to manually adjust the text, layout, shapes, fonts, colors, and other design elements. You can also edit content directly in text boxes. For more specific changes, switch to "Comment" mode to leave feedback on individual elements and let Kimi make the corresponding edits.
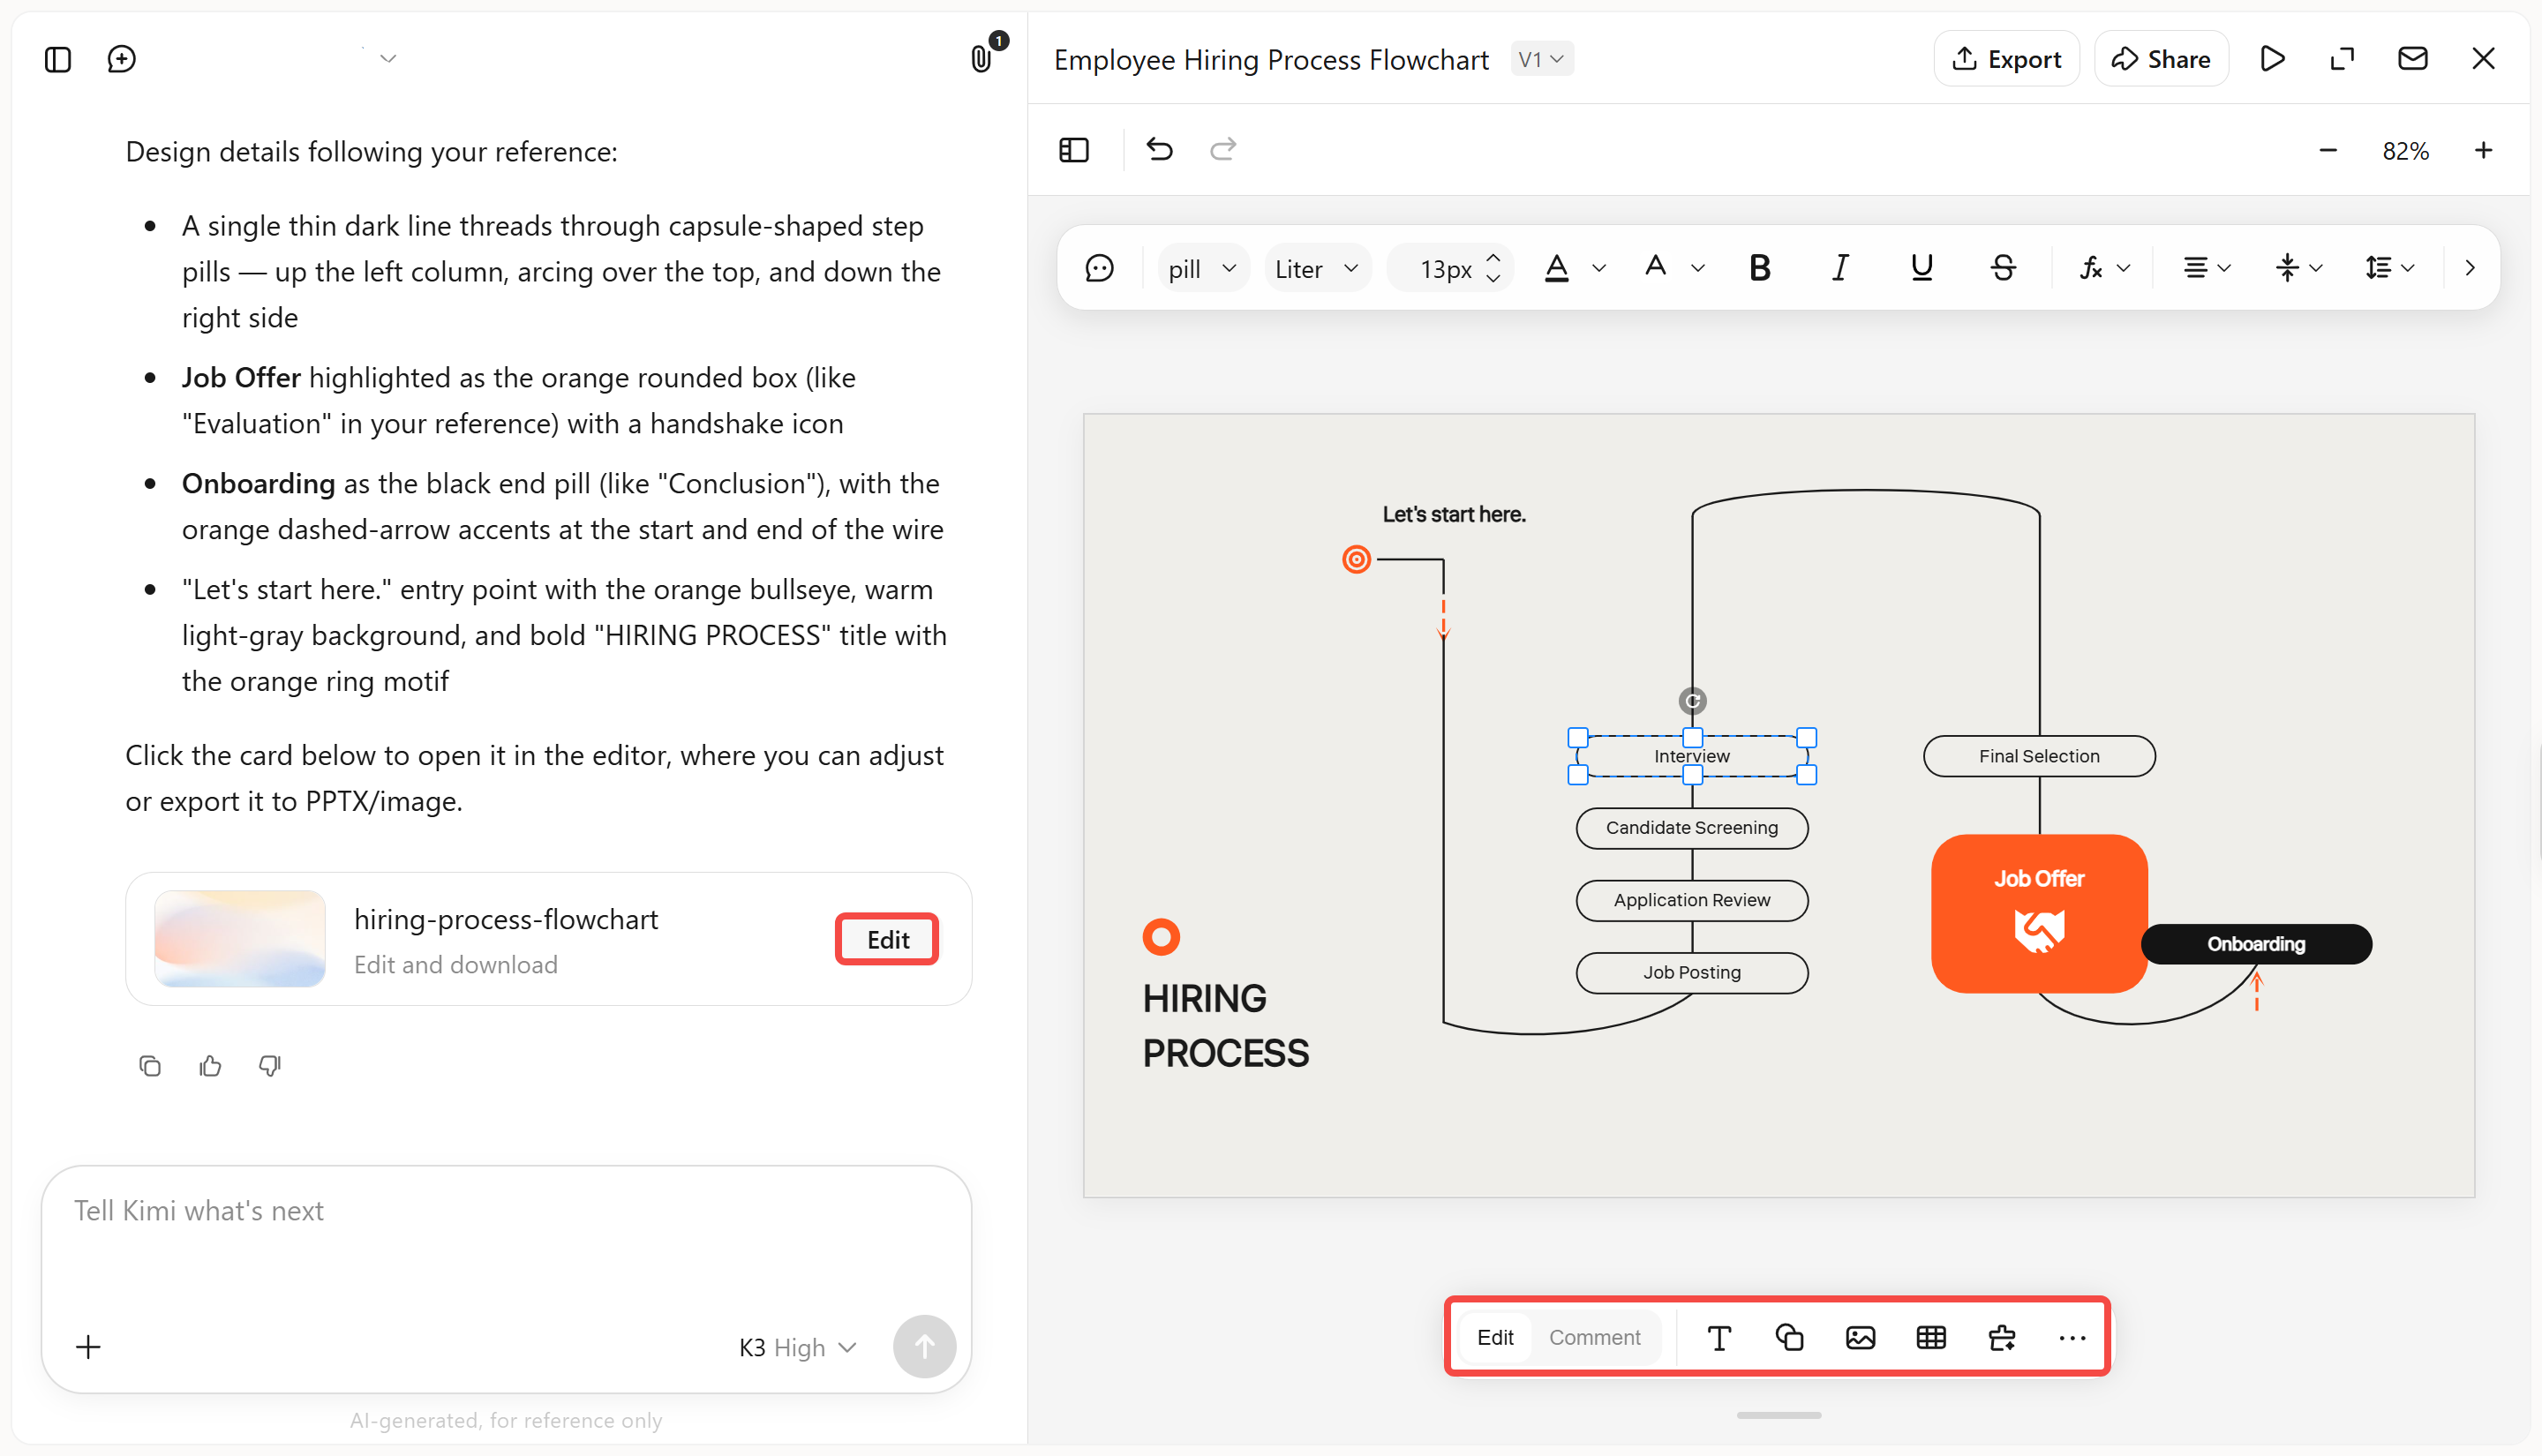
Step 4: Download the PPT file
Once you are satisfied with the final flowchart, download the presentation as a PowerPoint file and use it directly in your presentation.
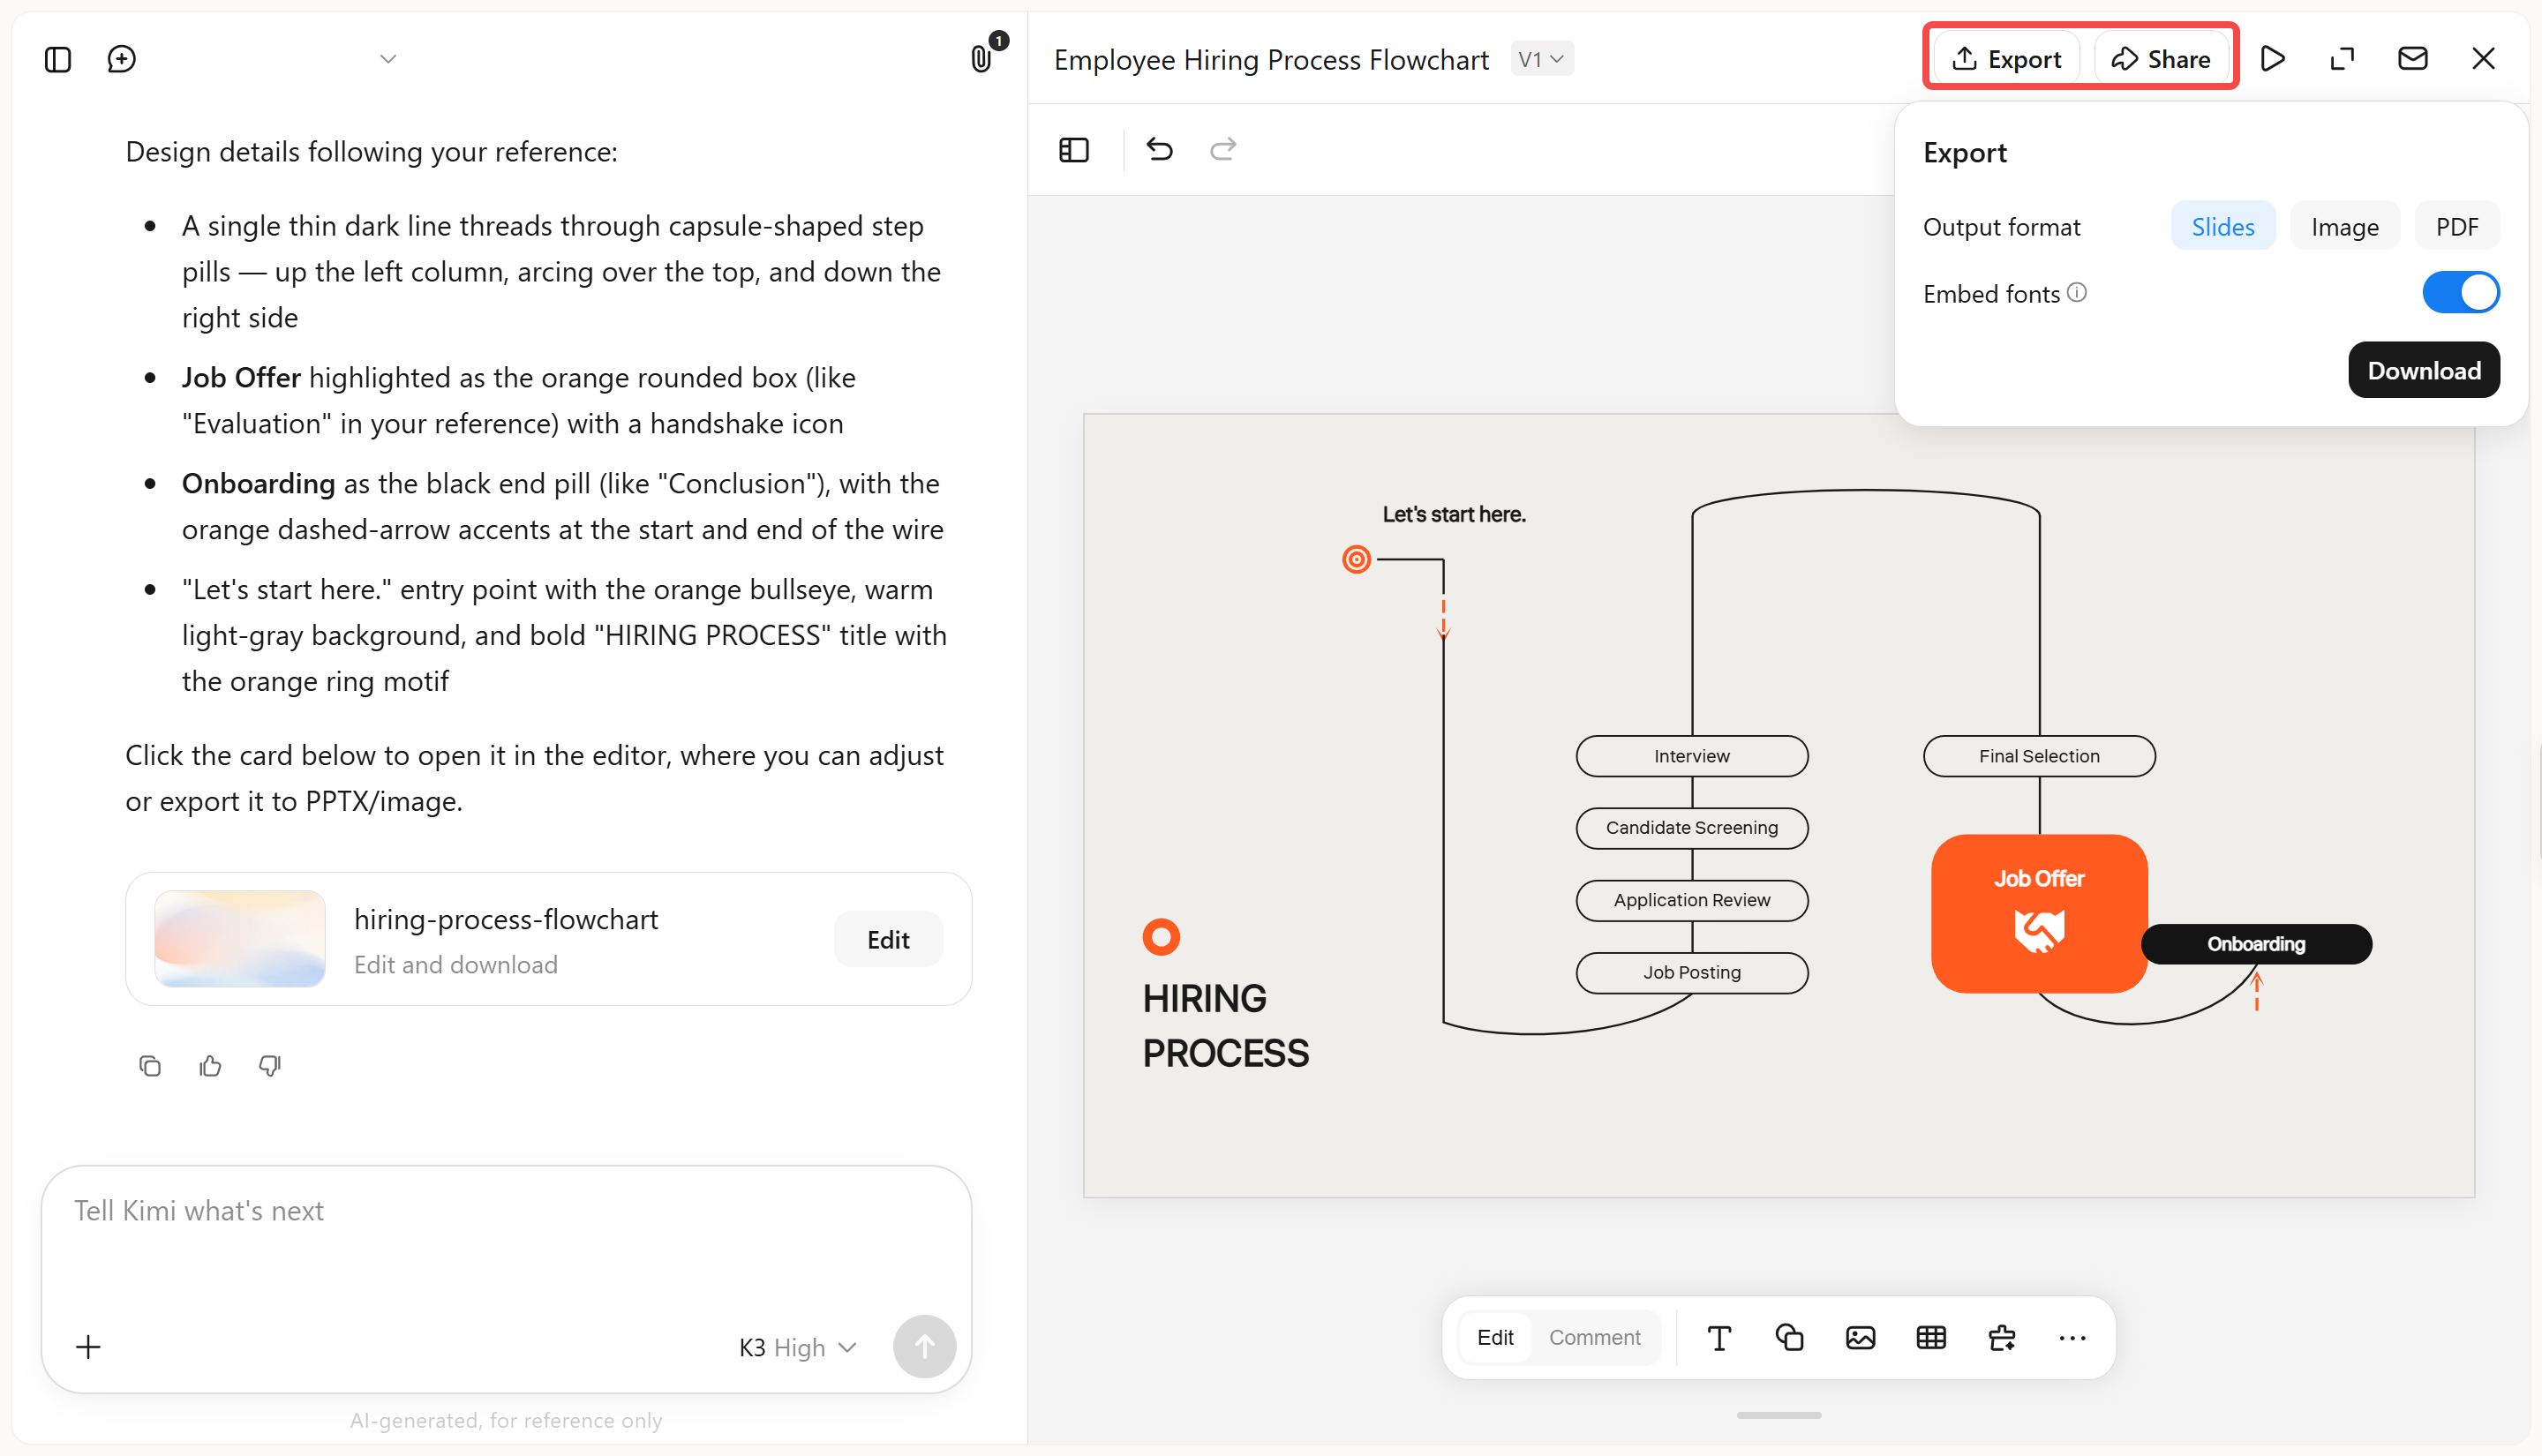
Main functions of Kimi Slides
Kimi Slides makes creating flowcharts easier by handling much of the structure and design for you. Whether you are starting with a simple idea or working from existing content, this AI PPT maker helps turn information into presentation-ready visuals. Here are some of its key features.
Turn instructions and existing content into flowcharts: Describe your process, steps, or decision points in natural language, or upload documents, images, and other references. Kimi Slides understands the information and transforms it into a structured flowchart directly in your presentation.
Create polished visual layouts automatically: Adapt flowchart styles to different PPT needs, from business processes and project workflows to timelines, decision trees, and organizational structures. Kimi Slides can also generate flowcharts with smooth, polished animations that make processes easier to follow step by step.
Edit SmartArt-style flowcharts with complete flexibility: Kimi Slides supports free and flexible editing of individual flowchart elements. Adjust shapes, text, connectors, layouts, and other components directly, or use comments and conversational editing when you want AI to make targeted changes.
Keep flowcharts consistent across your presentation: Use your flowchart alongside other slides while maintaining consistent typography, spacing, visual styles, and overall presentation design.
How to create a flowchart in PowerPoint using built-in features?
PowerPoint gives you a few built-in ways to create a flowchart without relying on an external tool. You can either use ready-made SmartArt layouts for a quicker setup or build the flowchart yourself with individual shapes. Below are two simple methods you can choose from based on the level of control you need:
Using SmartArt
PowerPoint's SmartArt feature is a simple way to build a flowchart without creating every shape from scratch. It gives you ready-made layouts that you can quickly adjust to match your process. You can also change the text, layout, shapes, and styles after adding the graphic. Here's how to build a flowchart in PowerPoint using SmartArt.
Step 1: Open SmartArt and choose a layout
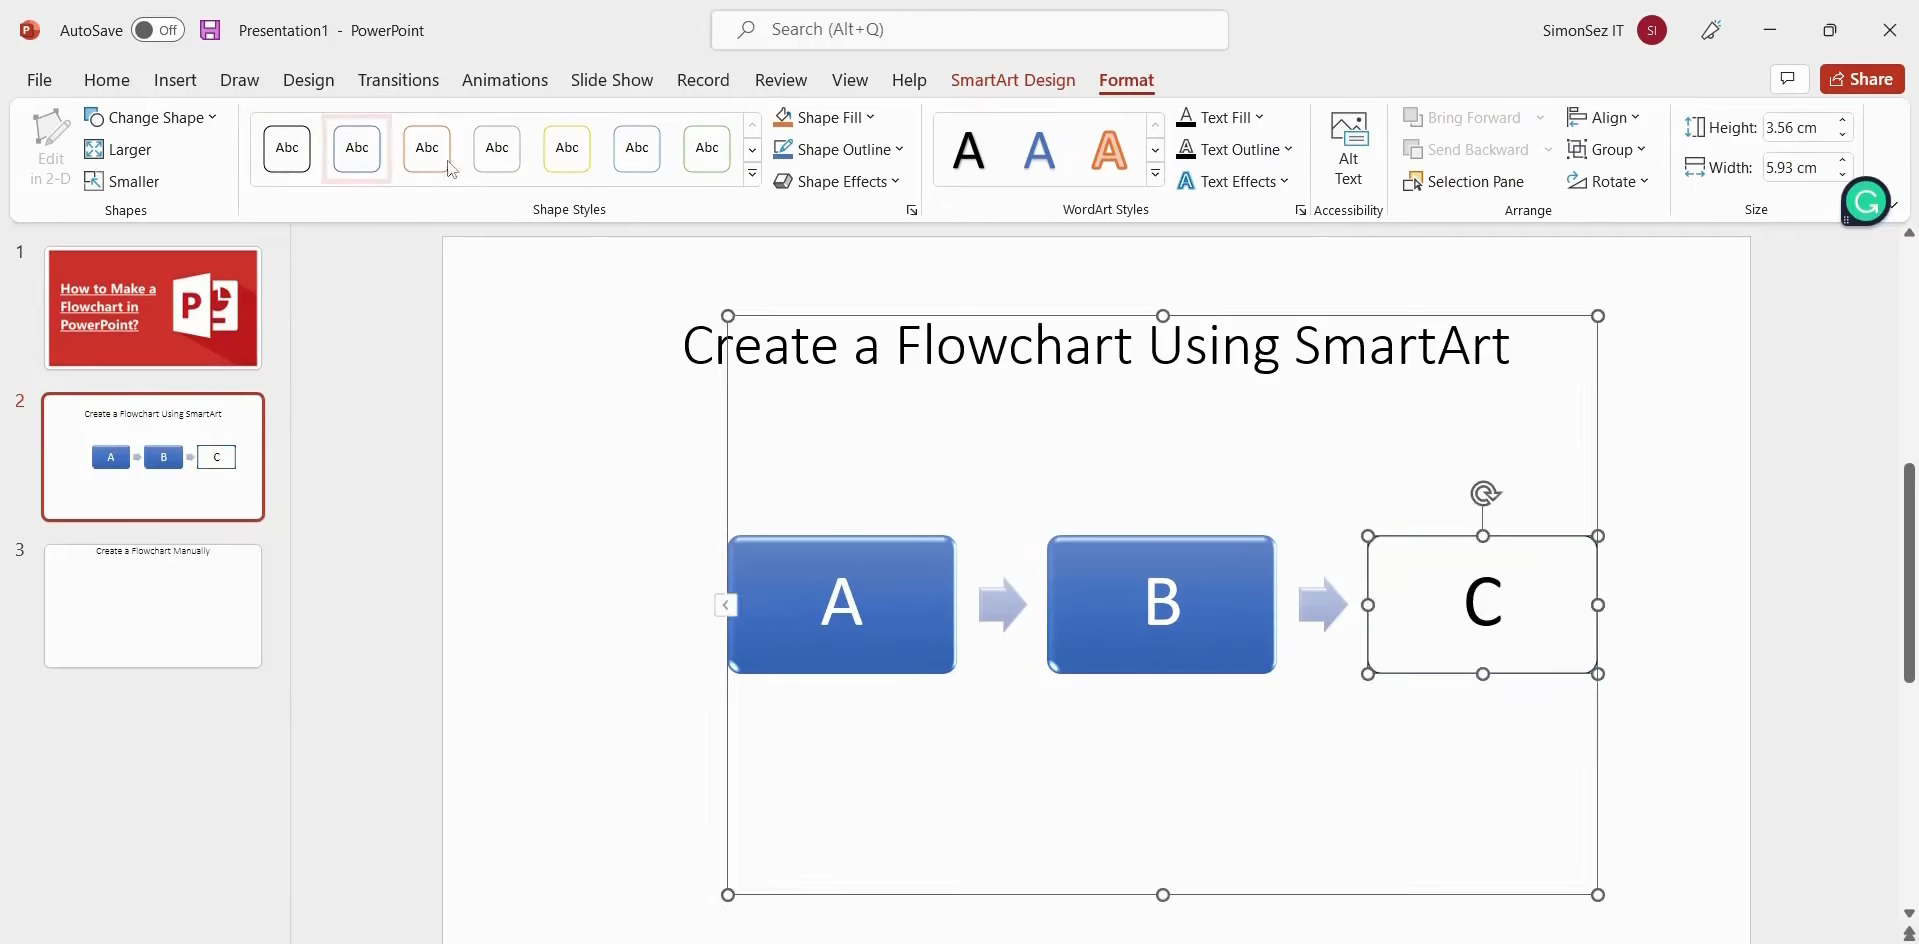
Open PowerPoint and select the slide where you want to create the flowchart. Go to "Insert" > "SmartArt", choose a suitable flowchart layout from the dialog box, and click "OK" to add it to the slide.
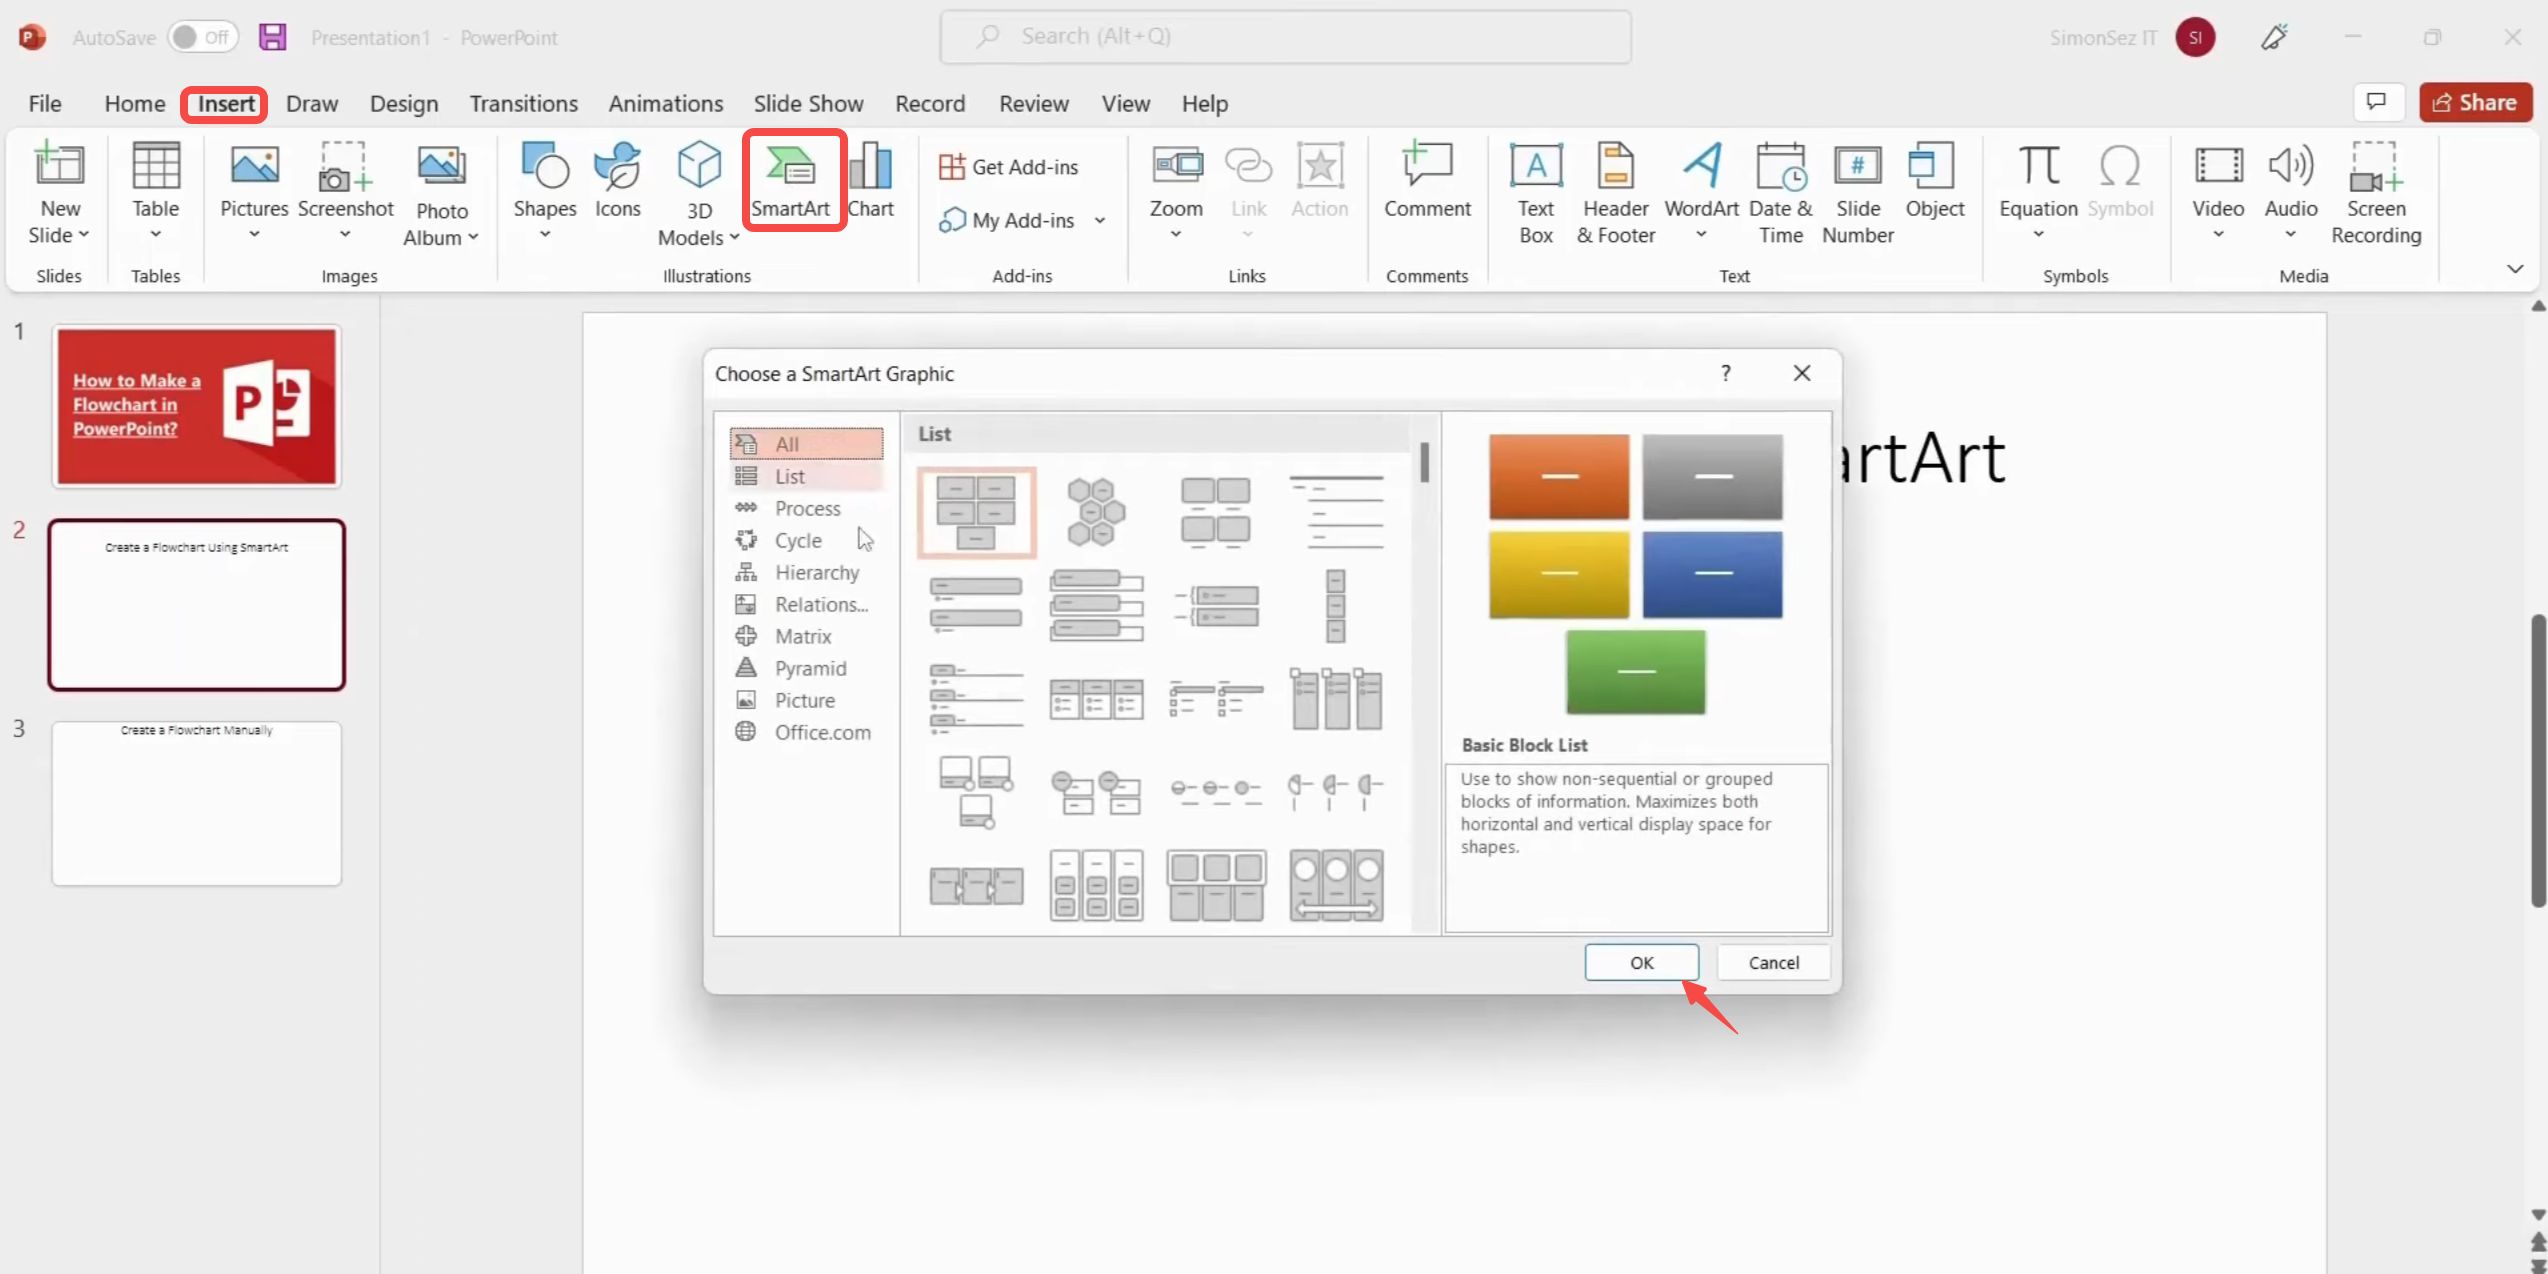
Step 2: Add and edit your content
Select the text areas in the SmartArt graphic and enter your information for each process step. You can also use "Add Text" to add more content and drag individual elements to adjust their position.
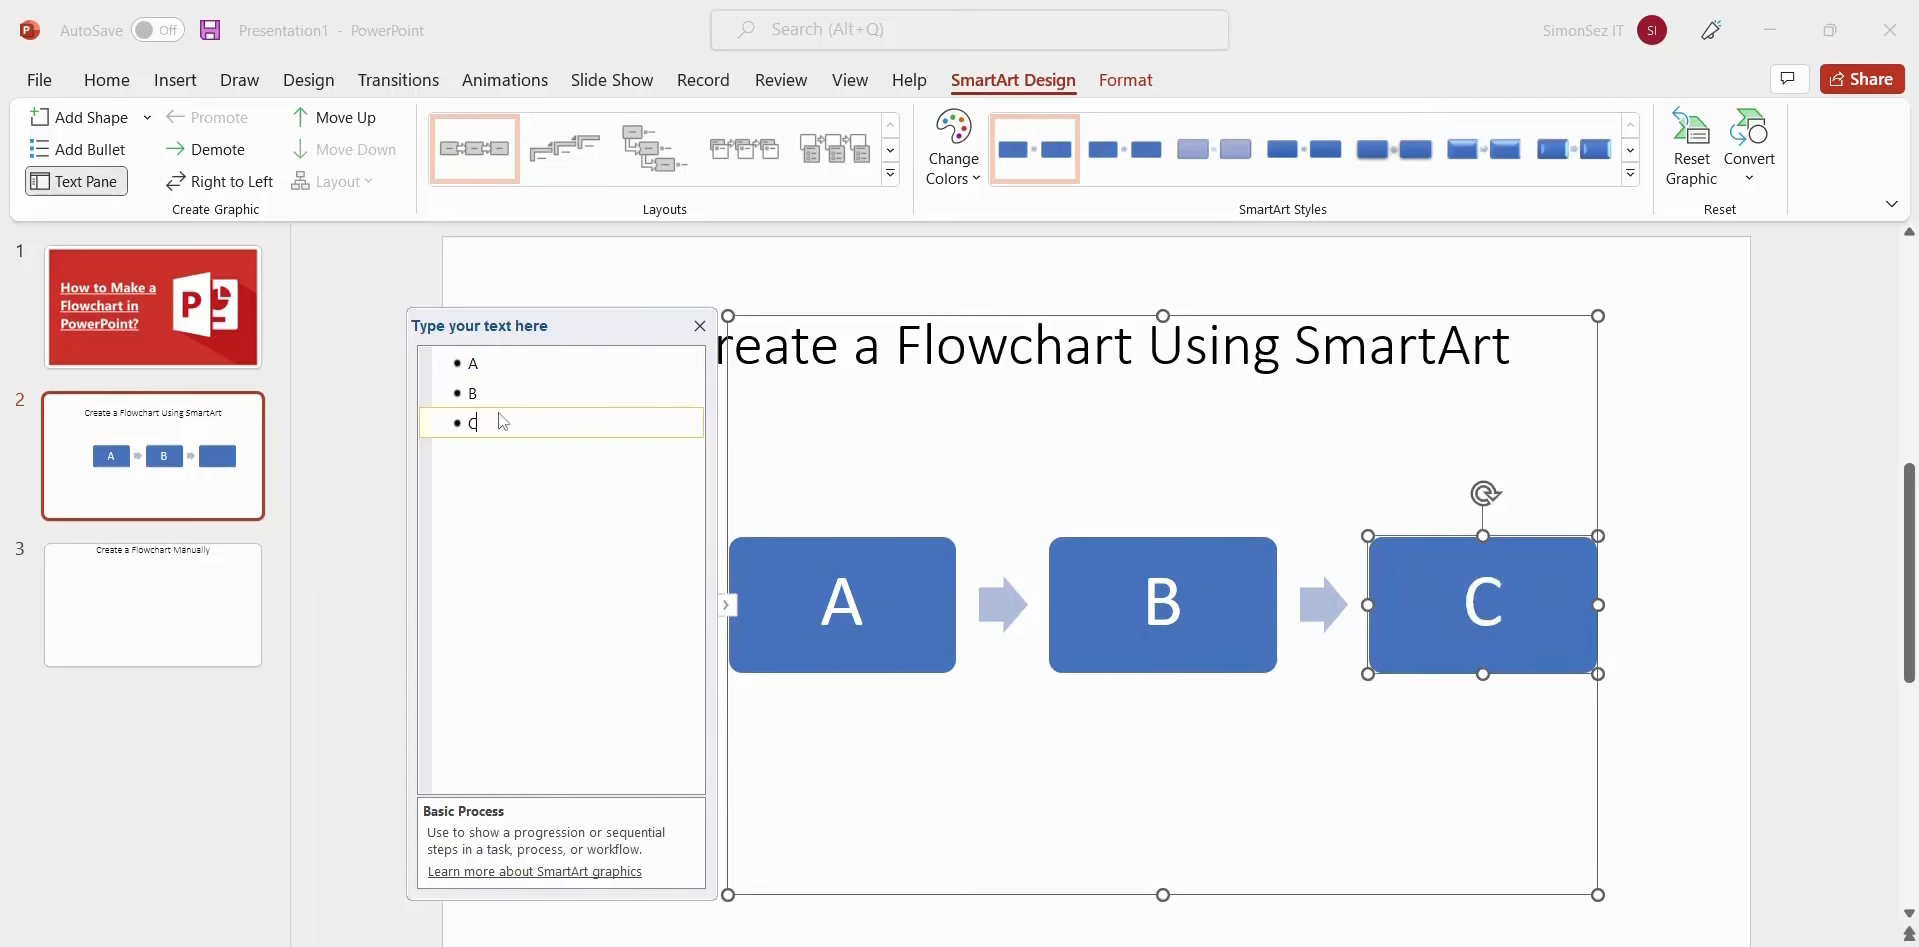
Step 3: Customize the flowchart
Use "SmartArt Design" to change the layout, graphics, and styles of your flowchart. You can also open "Format" to customize individual shapes, text styles, and their arrangement for a cleaner result.
Using manual shapes
When a suitable SmartArt layout is not available, you can build the flowchart yourself using PowerPoint's built-in shapes. This method gives you more control over the structure, placement, and appearance of each element. You can also use gridlines to keep the shapes and connecting lines properly aligned. Follow these steps to create a flowchart manually.
Step 1: Set Up the slide and grid
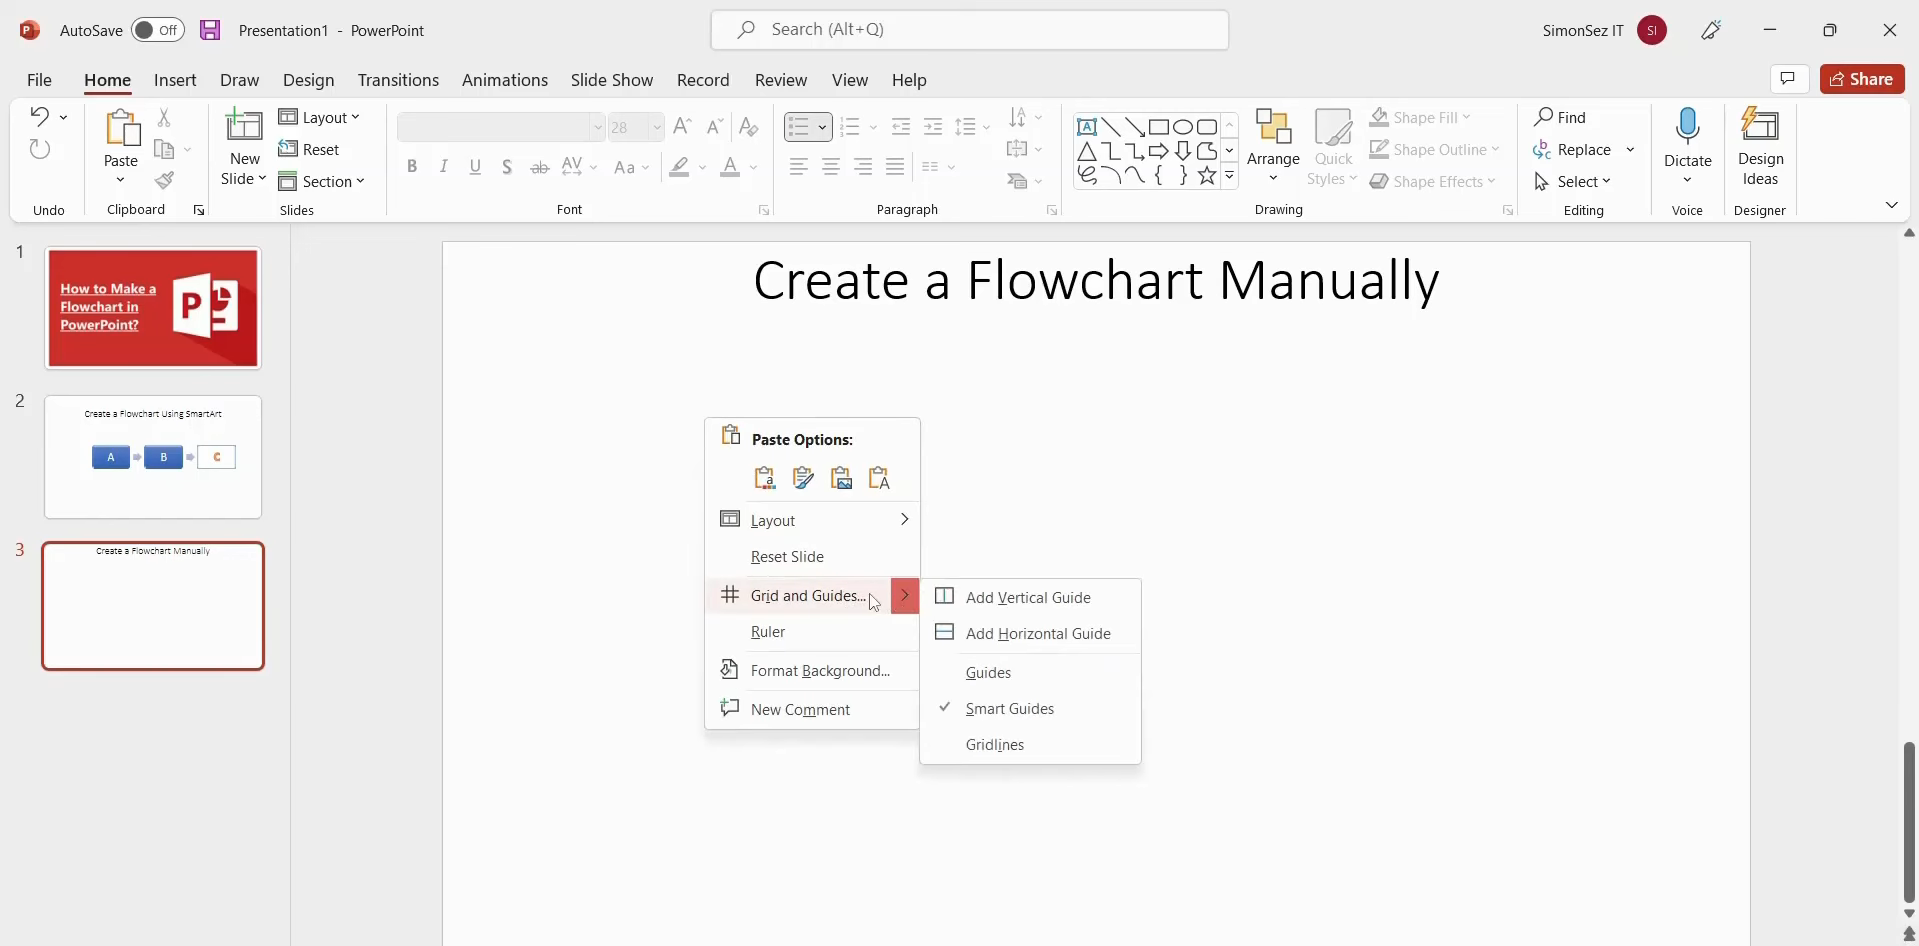
Remove the default title and content placeholders from the slide to create a blank workspace. Right-click the slide, select "Grid and Guides", set your preferred grid spacing, and enable "Display grid on screen".
Step 2: Add Shapes and text
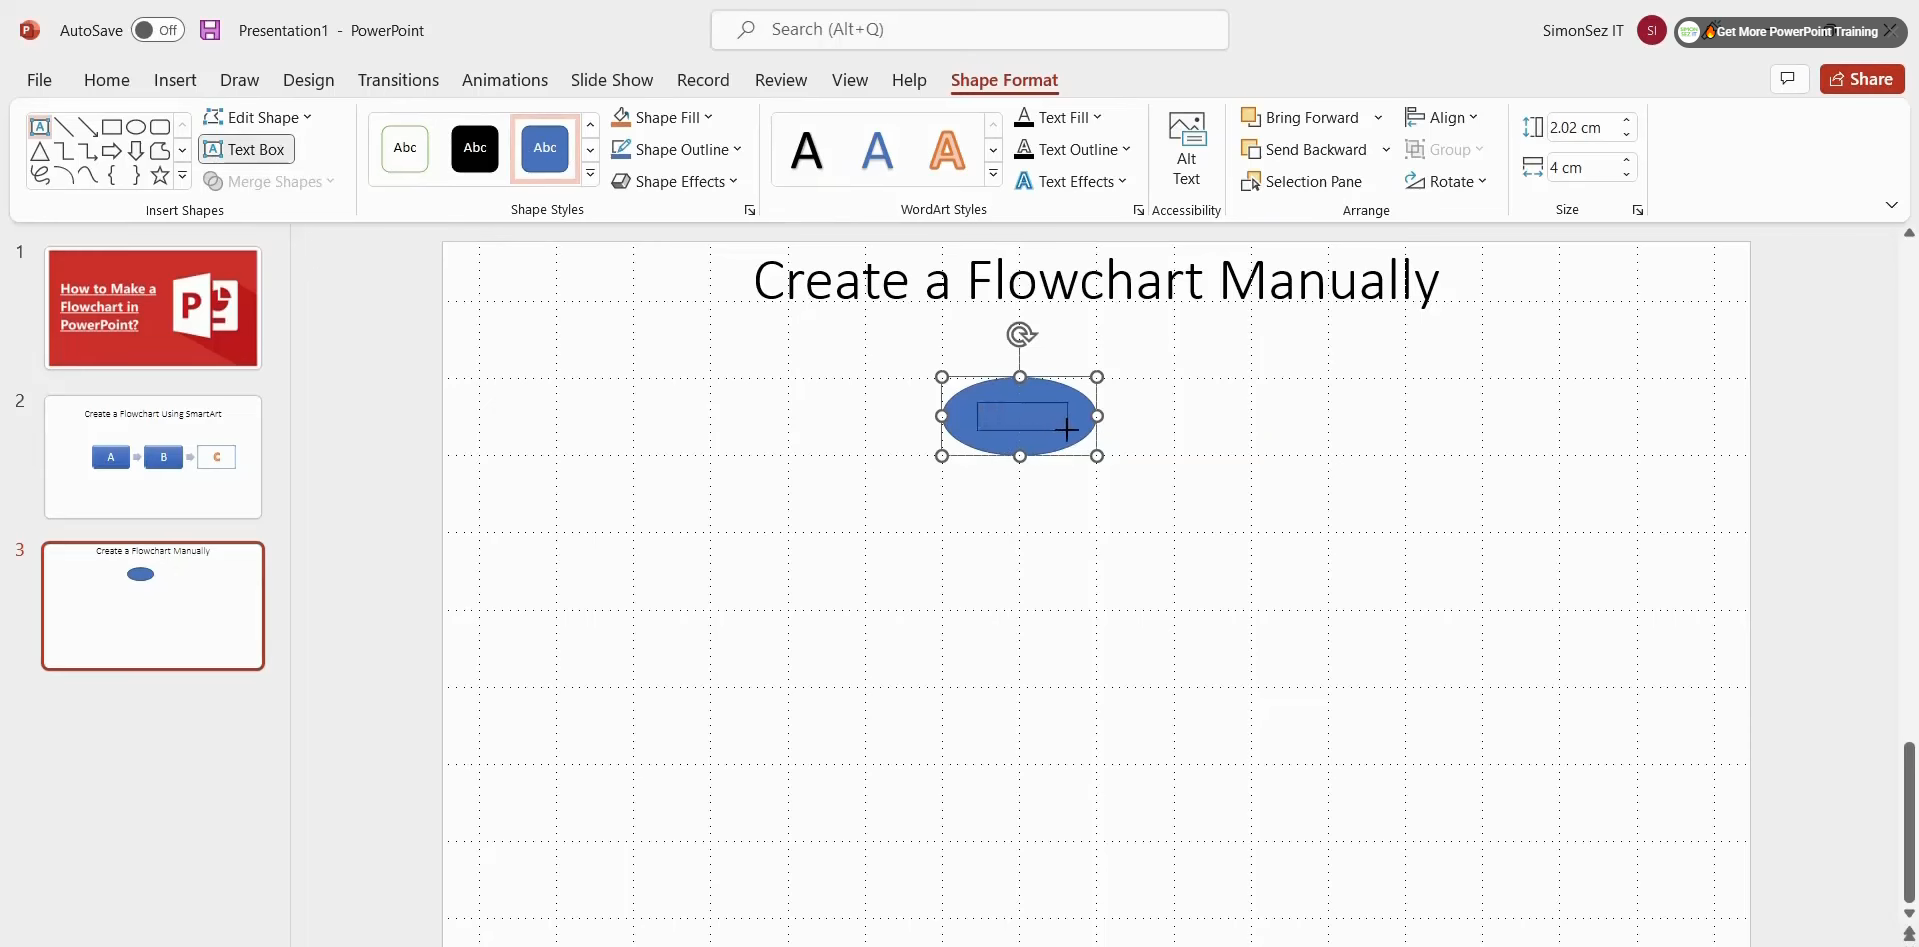
Go to "Home" > "Shapes" and choose the shapes you need for your flowchart. Drag them onto the slide using the grid as a guide, then use "Shape Format" > "Text Box" to add text inside or around the shapes.
Step 3: Connect and customize the flowchart
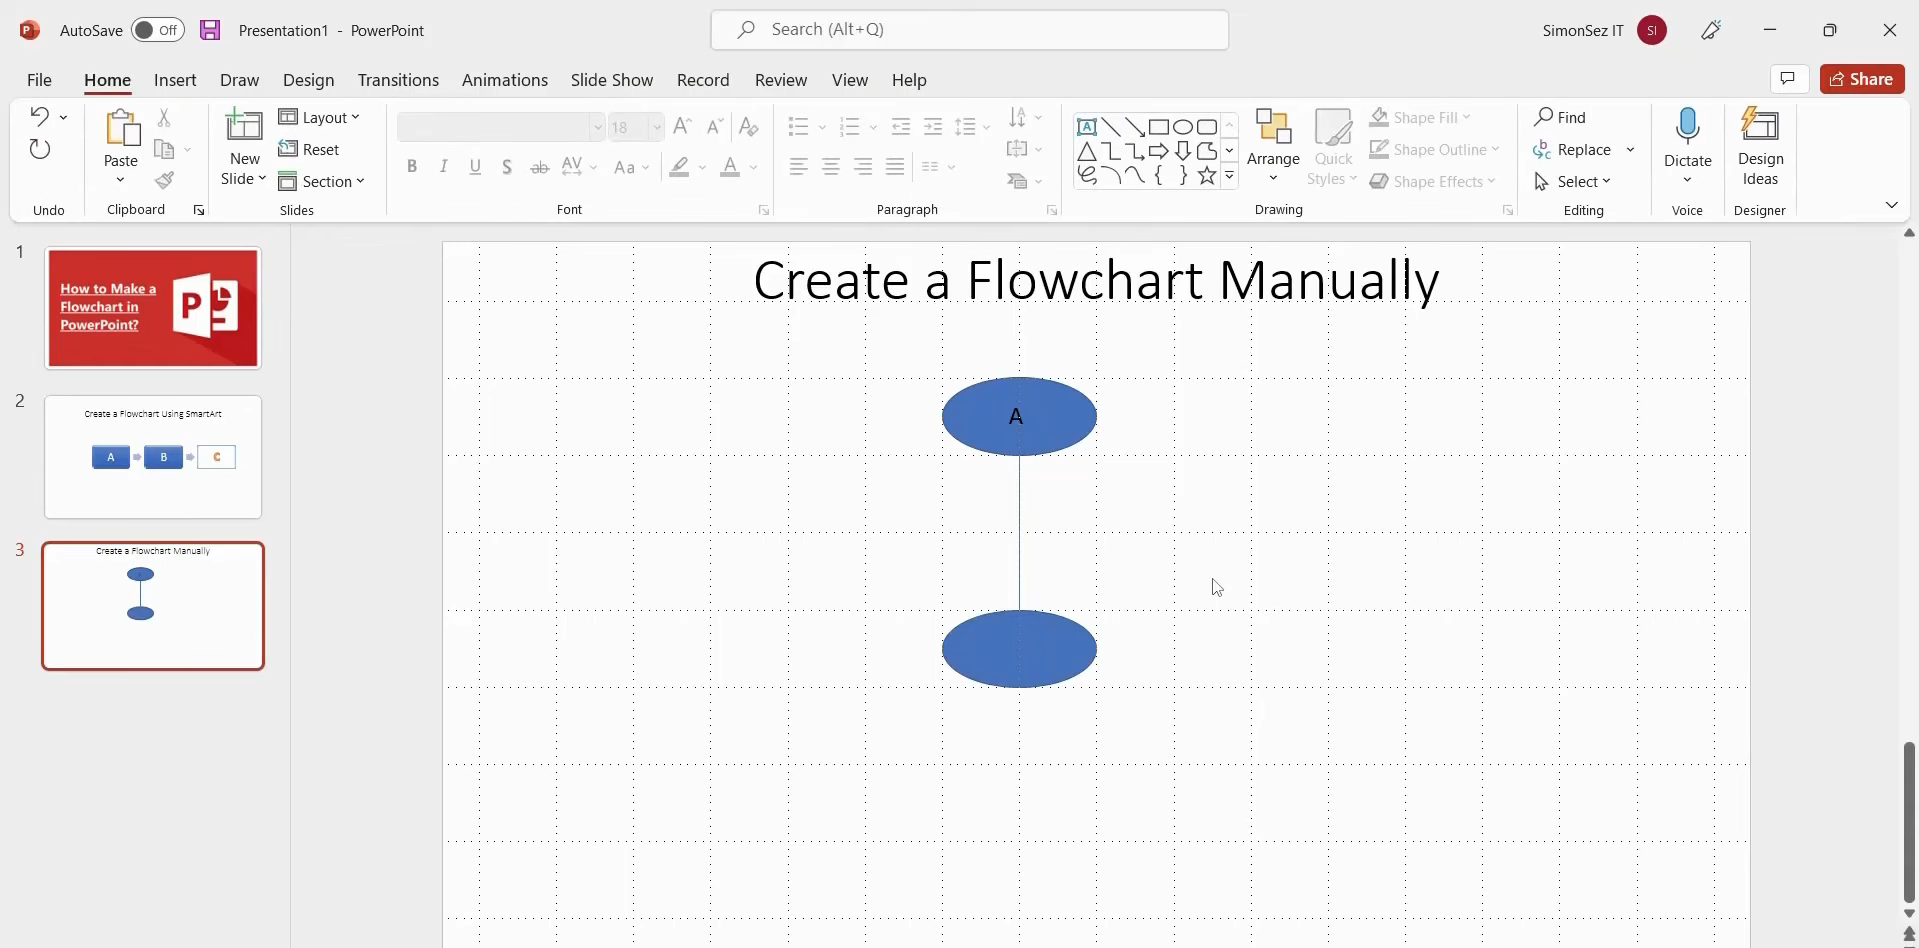
Use connecting lines to link the shapes and show the direction of your process. Once everything is connected, customize the shapes, text, lines, and arrangement to create a clear and organized flowchart.
Why you need to use a flowchart
Flowcharts are useful when you need to turn a complicated process into something people can understand at a glance. They show how each step connects, making it easier to spot problems and explain ideas clearly. Here are some key reasons to use them.
Make complex processes easier to understand
A flowchart breaks a complicated process into simple, connected steps. Instead of reading long explanations, people can follow the process visually from start to finish. This makes information easier to understand, remember, and explain to others.
Identify gaps and bottlenecks
Mapping out each step can reveal where a process slows down or where something important is missing. You can quickly spot repeated tasks, unnecessary steps, or areas that need improvement. This makes flowcharts useful for reviewing and improving workflows more efficiently.
Improve team communication
A flowchart gives everyone a shared view of how a process works. Team members can use it to discuss responsibilities, explain tasks, and avoid misunderstandings during projects. It can also make meetings and project discussions more focused, clear, and productive.
Support better decision-making
Flowcharts can show different choices and what happens after each decision. This helps people compare possible outcomes before taking the next step or choosing a solution. A clear visual process can make important decisions easier to discuss and understand.
Common mistakes when creating a flowchart in PowerPoint
A flowchart should make a process easier to understand, not make the slide harder to read. Small design choices can affect how quickly people understand the steps and follow the process. Keep these common mistakes in mind when you create flowcharts in PowerPoint.
Overcrowded shapes and lengthy labels
Adding too much text inside each shape can make your flowchart look crowded and difficult to scan. Keep labels short and focus on the key action or idea for each step. If more explanation is needed, place it outside the flowchart.
Inconsistent symbols and colors
Using different symbols for similar steps can make the flowchart confusing. Stick to a consistent set of shapes and use colors with a clear purpose, such as highlighting decisions or important stages. This gives the flowchart a more organized appearance.
Unclear flow and crossing lines
Lines that cross each other or point in different directions can make the process difficult to follow. Keep the flow moving in a clear direction, such as left to right or top to bottom. When you create an interactive flowchart in PowerPoint, use simple connectors and avoid unnecessary line crossings.
Poor alignment and spacing
Uneven shapes and inconsistent gaps can make even a well-planned flowchart look messy. Use PowerPoint's alignment and spacing tools to keep elements evenly positioned. Leave enough space between shapes and connectors, so each step remains easy to identify.
Conclusion
Learning how to create a process flowchart in PowerPoint can make it easier to present steps, ideas, and workflows clearly. The right method depends on your needs, whether you want simplicity, control, or speed. Once you know the basics, you can create clear flowcharts efficiently or use Kimi Slides to turn your ideas into flowcharts with less manual work using AI.