Global Operations Command Center
A dark group-performance command wall: a 3D globe of trade routes, five headline metrics, drill-down regions, and a live business alert feed.
Loading preview...
12393 views
Start with this prompt
A dark group-performance command wall: a 3D globe of trade routes, five headline metrics, drill-down regions, and a live business alert feed.
Try Websites AgentBuild a dark group-performance command wall for a business operations team. In the center, a 3D globe shows live trade routes arcing from Chinese hubs to cities around the world, each route carrying its volume and trend, while an AUTO TOUR mode slowly orbits the scene on its own. Across the top, five headline cards track annual revenue, target attainment, gross margin, collection rate, and inventory turns in days, ticking as new data arrives. On the left, seven regions — East, South, North, West, Central, Northeast, and Northwest — each show status with mini trend charts, and clicking one drills down to its cities and stores, with a way back up one level. On the right, a live alert feed scrolls business events — attainment warnings, overdue receivables, store sales records — tagged HIGH or MED. Along the bottom, a category mix pie, collections bars, and an operating cash-flow curve. All data comes from a built-in simulated source that keeps updating, so the screen never sits still. The layout fits a 16:9 wall screen, readable from a distance. Single-file static page.
Add Alert Escalation
Anything left unacknowledged for thirty seconds escalates in color and pins to the top of the feed.
Try Websites AgentBuild a dark group-performance command wall for a business operations team. In the center, a 3D globe shows live trade routes arcing from Chinese hubs to cities around the world, each route carrying its volume and trend, while an AUTO TOUR mode slowly orbits the scene on its own. Across the top, five headline cards track annual revenue, target attainment, gross margin, collection rate, and inventory turns in days, ticking as new data arrives. On the left, seven regions — East, South, North, West, Central, Northeast, and Northwest — each show status with mini trend charts, and clicking one drills down to its cities and stores, with a way back up one level. On the right, a live alert feed scrolls business events — attainment warnings, overdue receivables, store sales records — tagged HIGH or MED. Along the bottom, a category mix pie, collections bars, and an operating cash-flow curve. All data comes from a built-in simulated source that keeps updating, so the screen never sits still. The layout fits a 16:9 wall screen, readable from a distance. Single-file static page.
Studio-Light Theme
Swap the dark command wall for a bright studio-light theme, all panels kept.
Try Websites AgentBuild a dark group-performance command wall for a business operations team. In the center, a 3D globe shows live trade routes arcing from Chinese hubs to cities around the world, each route carrying its volume and trend, while an AUTO TOUR mode slowly orbits the scene on its own. Across the top, five headline cards track annual revenue, target attainment, gross margin, collection rate, and inventory turns in days, ticking as new data arrives. On the left, seven regions — East, South, North, West, Central, Northeast, and Northwest — each show status with mini trend charts, and clicking one drills down to its cities and stores, with a way back up one level. On the right, a live alert feed scrolls business events — attainment warnings, overdue receivables, store sales records — tagged HIGH or MED. Along the bottom, a category mix pie, collections bars, and an operating cash-flow curve. All data comes from a built-in simulated source that keeps updating, so the screen never sits still. The layout fits a 16:9 wall screen, readable from a distance. Single-file static page.
Add Region Compare
Pick any two regions and compare them side by side: revenue, attainment, and alerts.
Try Websites AgentBuild a dark group-performance command wall for a business operations team. In the center, a 3D globe shows live trade routes arcing from Chinese hubs to cities around the world, each route carrying its volume and trend, while an AUTO TOUR mode slowly orbits the scene on its own. Across the top, five headline cards track annual revenue, target attainment, gross margin, collection rate, and inventory turns in days, ticking as new data arrives. On the left, seven regions — East, South, North, West, Central, Northeast, and Northwest — each show status with mini trend charts, and clicking one drills down to its cities and stores, with a way back up one level. On the right, a live alert feed scrolls business events — attainment warnings, overdue receivables, store sales records — tagged HIGH or MED. Along the bottom, a category mix pie, collections bars, and an operating cash-flow curve. All data comes from a built-in simulated source that keeps updating, so the screen never sits still. The layout fits a 16:9 wall screen, readable from a distance. Single-file static page.
You Might Also Like

Elena Voss Photography
A full magazine-cover wall and eight complete shoots: the portfolio of an independent fashion photographer.
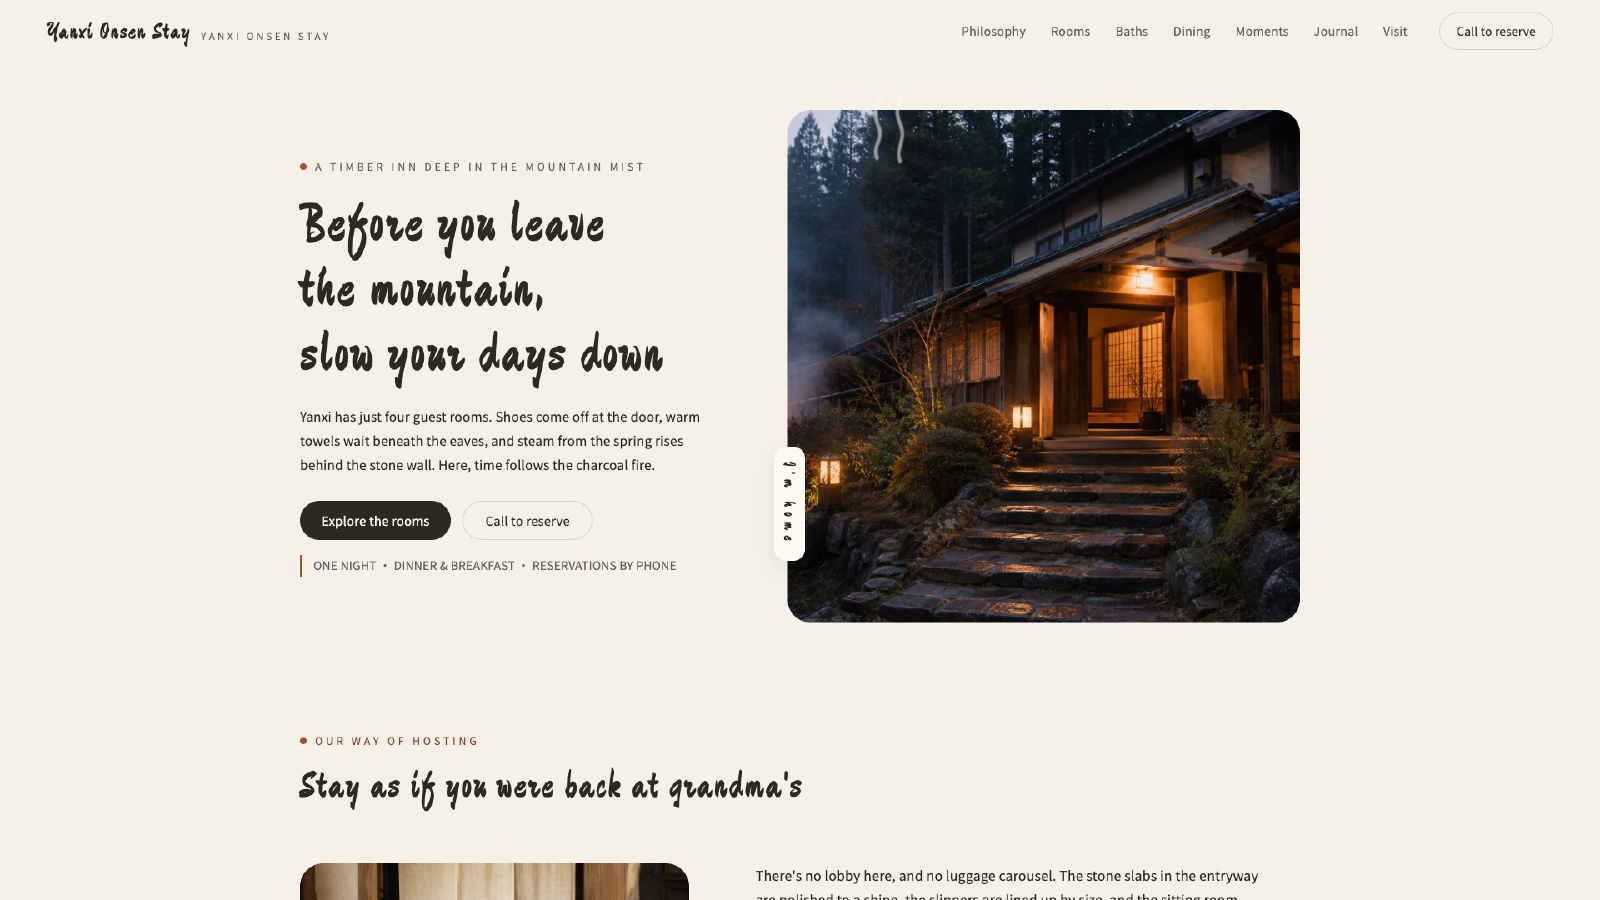
Yanxi Onsen Stay
Four rooms each facing their own mountain, one open-air stone bath: a quiet onsen inn in the mist.