Inventory Blueprint
A garment warehouse drawn as one engineering sheet: rack elevations, a red safety-stock line, and picking paths traced on the drawing.
A garment warehouse drawn as one engineering sheet: rack elevations, a red safety-stock line, and picking paths traced on the drawing.
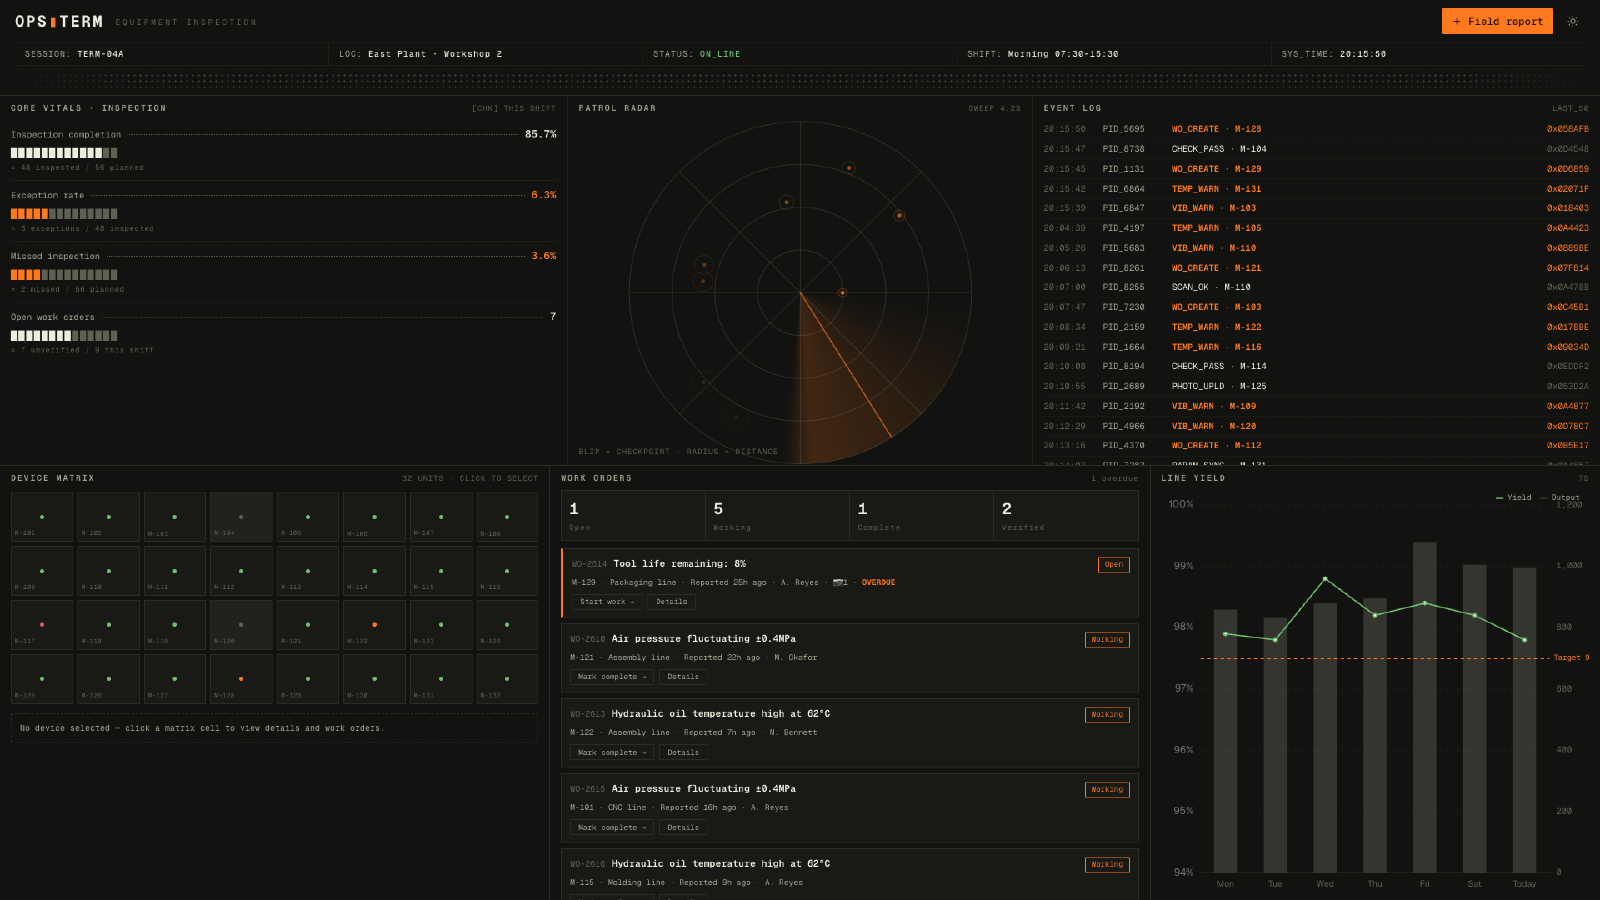
Try Websites AgentBuild an inventory blueprint for a finished-garment warehouse, titled Inventory Blueprint. The whole page is a single engineering drawing, labeled with the drawing number WH-A-EL-01, a 1:50 scale and a revision mark. Inventory readings sit at the top: total stock, in-stock SKUs, capacity utilization and the alert count. The safety-stock threshold is computed as the trailing thirty-day average daily sales multiplied by the coverage days, and any rack position below the red dashed line is flagged for replenishment and listed in the alert list. At the center of the sheet is a rack elevation view that can be colored by color, by size or by category, and that can generate picking paths. Around it sit charts for the raw-material price trend, grouped inventory comparison, trailing thirty-day sales, the supplier on-time arrival rate and the inbound and outbound flow, and the page supports importing detail files and exporting Excel. Single-file static page.
Positions under the red dashed line still appear in the alert list, and each now gets a suggested purchase quantity generated automatically from its own shortfall.
Try Websites AgentBuild an inventory blueprint for a finished-garment warehouse, titled Inventory Blueprint. The whole page is a single engineering drawing, labeled with the drawing number WH-A-EL-01, a 1:50 scale and a revision mark. Inventory readings sit at the top: total stock, in-stock SKUs, capacity utilization and the alert count. The safety-stock threshold is computed as the trailing thirty-day average daily sales multiplied by the coverage days, and any rack position below the red dashed line is flagged for replenishment and listed in the alert list. At the center of the sheet is a rack elevation view that can be colored by color, by size or by category, and that can generate picking paths. Around it sit charts for the raw-material price trend, grouped inventory comparison, trailing thirty-day sales, the supplier on-time arrival rate and the inbound and outbound flow, and the page supports importing detail files and exporting Excel. Single-file static page.
The sheet keeps its drawing number, scale and revision marks, but the drawing surface switches from blueprint blue to black lines on white paper.
Try Websites AgentBuild an inventory blueprint for a finished-garment warehouse, titled Inventory Blueprint. The whole page is a single engineering drawing, labeled with the drawing number WH-A-EL-01, a 1:50 scale and a revision mark. Inventory readings sit at the top: total stock, in-stock SKUs, capacity utilization and the alert count. The safety-stock threshold is computed as the trailing thirty-day average daily sales multiplied by the coverage days, and any rack position below the red dashed line is flagged for replenishment and listed in the alert list. At the center of the sheet is a rack elevation view that can be colored by color, by size or by category, and that can generate picking paths. Around it sit charts for the raw-material price trend, grouped inventory comparison, trailing thirty-day sales, the supplier on-time arrival rate and the inbound and outbound flow, and the page supports importing detail files and exporting Excel. Single-file static page.
Adds a capacity occupancy forecast chart alongside the raw-material price trend, the grouped inventory comparison and the thirty-day sales views.
Try Websites AgentBuild an inventory blueprint for a finished-garment warehouse, titled Inventory Blueprint. The whole page is a single engineering drawing, labeled with the drawing number WH-A-EL-01, a 1:50 scale and a revision mark. Inventory readings sit at the top: total stock, in-stock SKUs, capacity utilization and the alert count. The safety-stock threshold is computed as the trailing thirty-day average daily sales multiplied by the coverage days, and any rack position below the red dashed line is flagged for replenishment and listed in the alert list. At the center of the sheet is a rack elevation view that can be colored by color, by size or by category, and that can generate picking paths. Around it sit charts for the raw-material price trend, grouped inventory comparison, trailing thirty-day sales, the supplier on-time arrival rate and the inbound and outbound flow, and the page supports importing detail files and exporting Excel. Single-file static page.

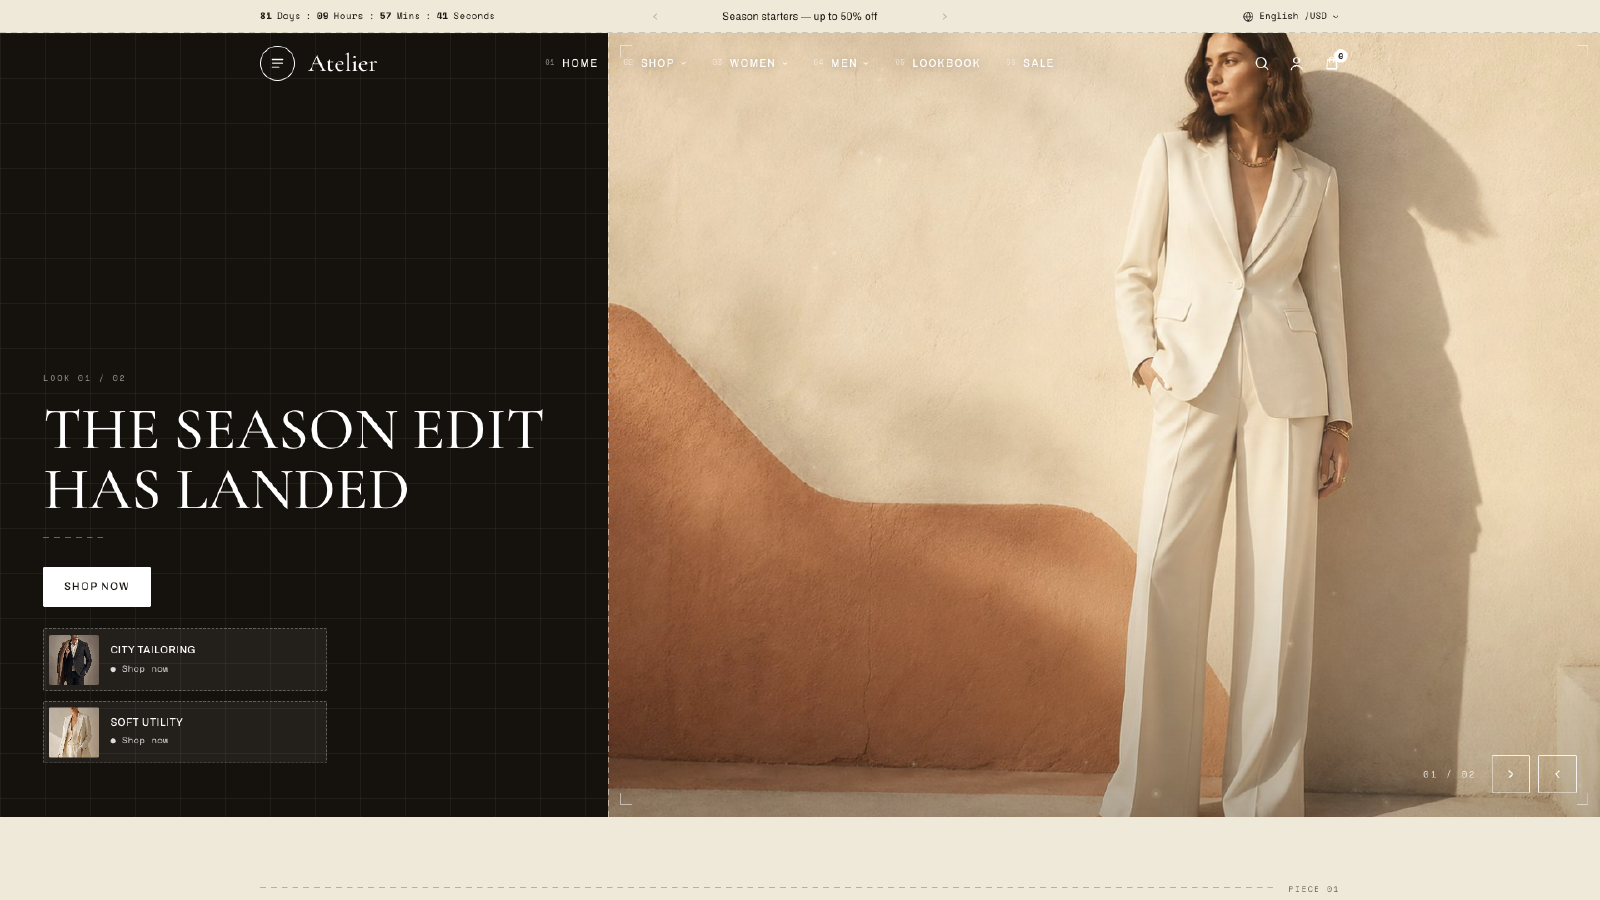
A full magazine-cover wall and eight complete shoots: the portfolio of an independent fashion photographer.
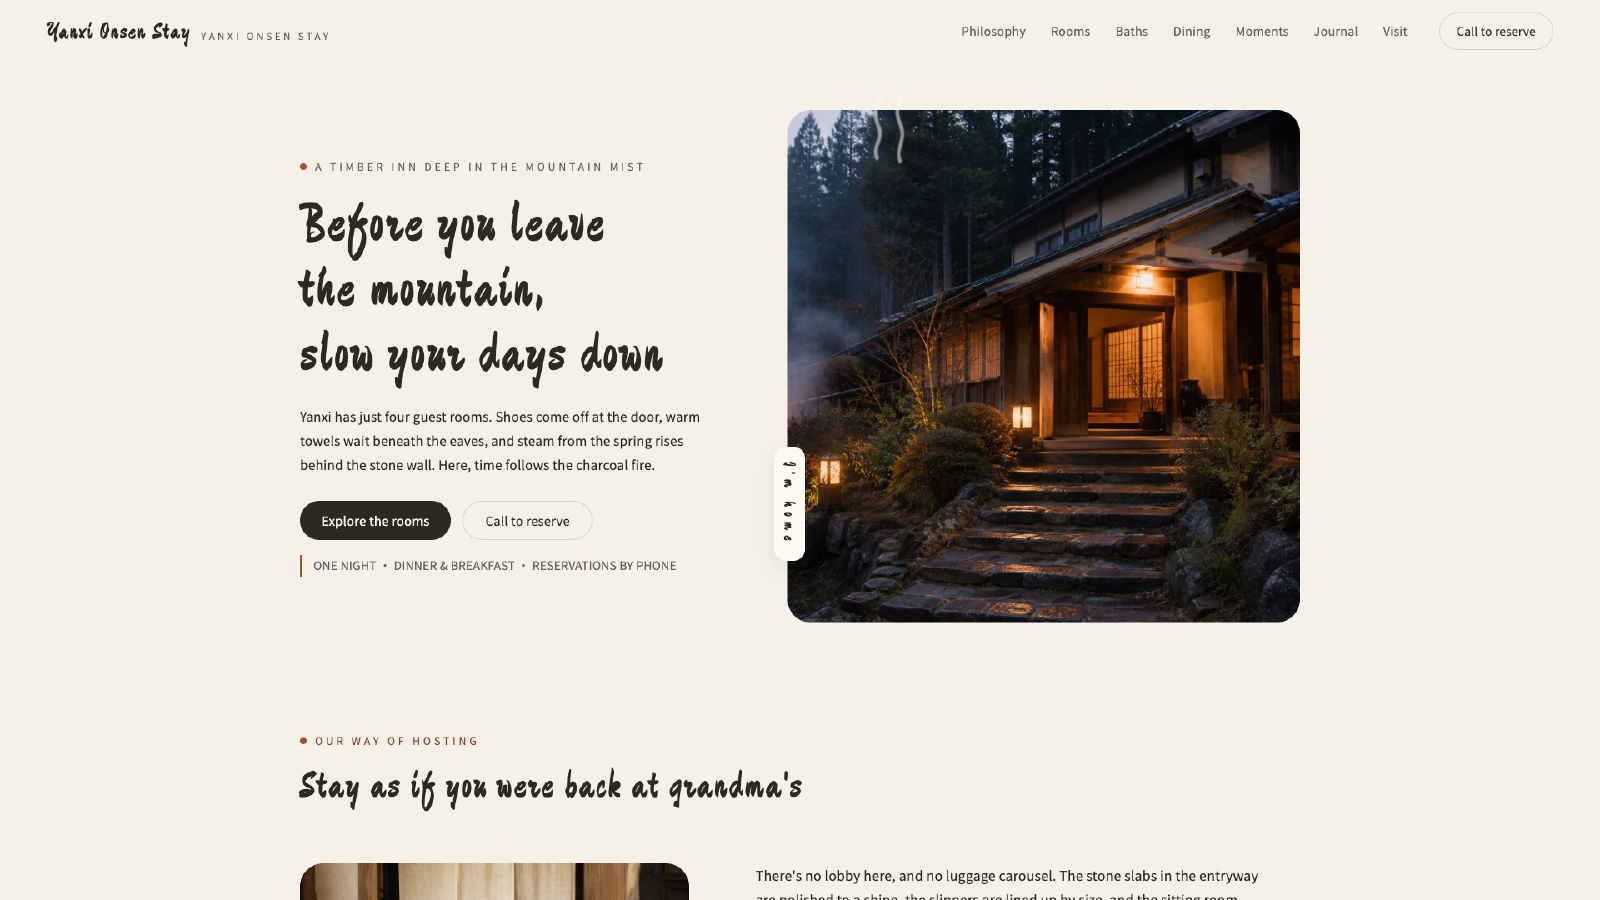
Four rooms each facing their own mountain, one open-air stone bath: a quiet onsen inn in the mist.