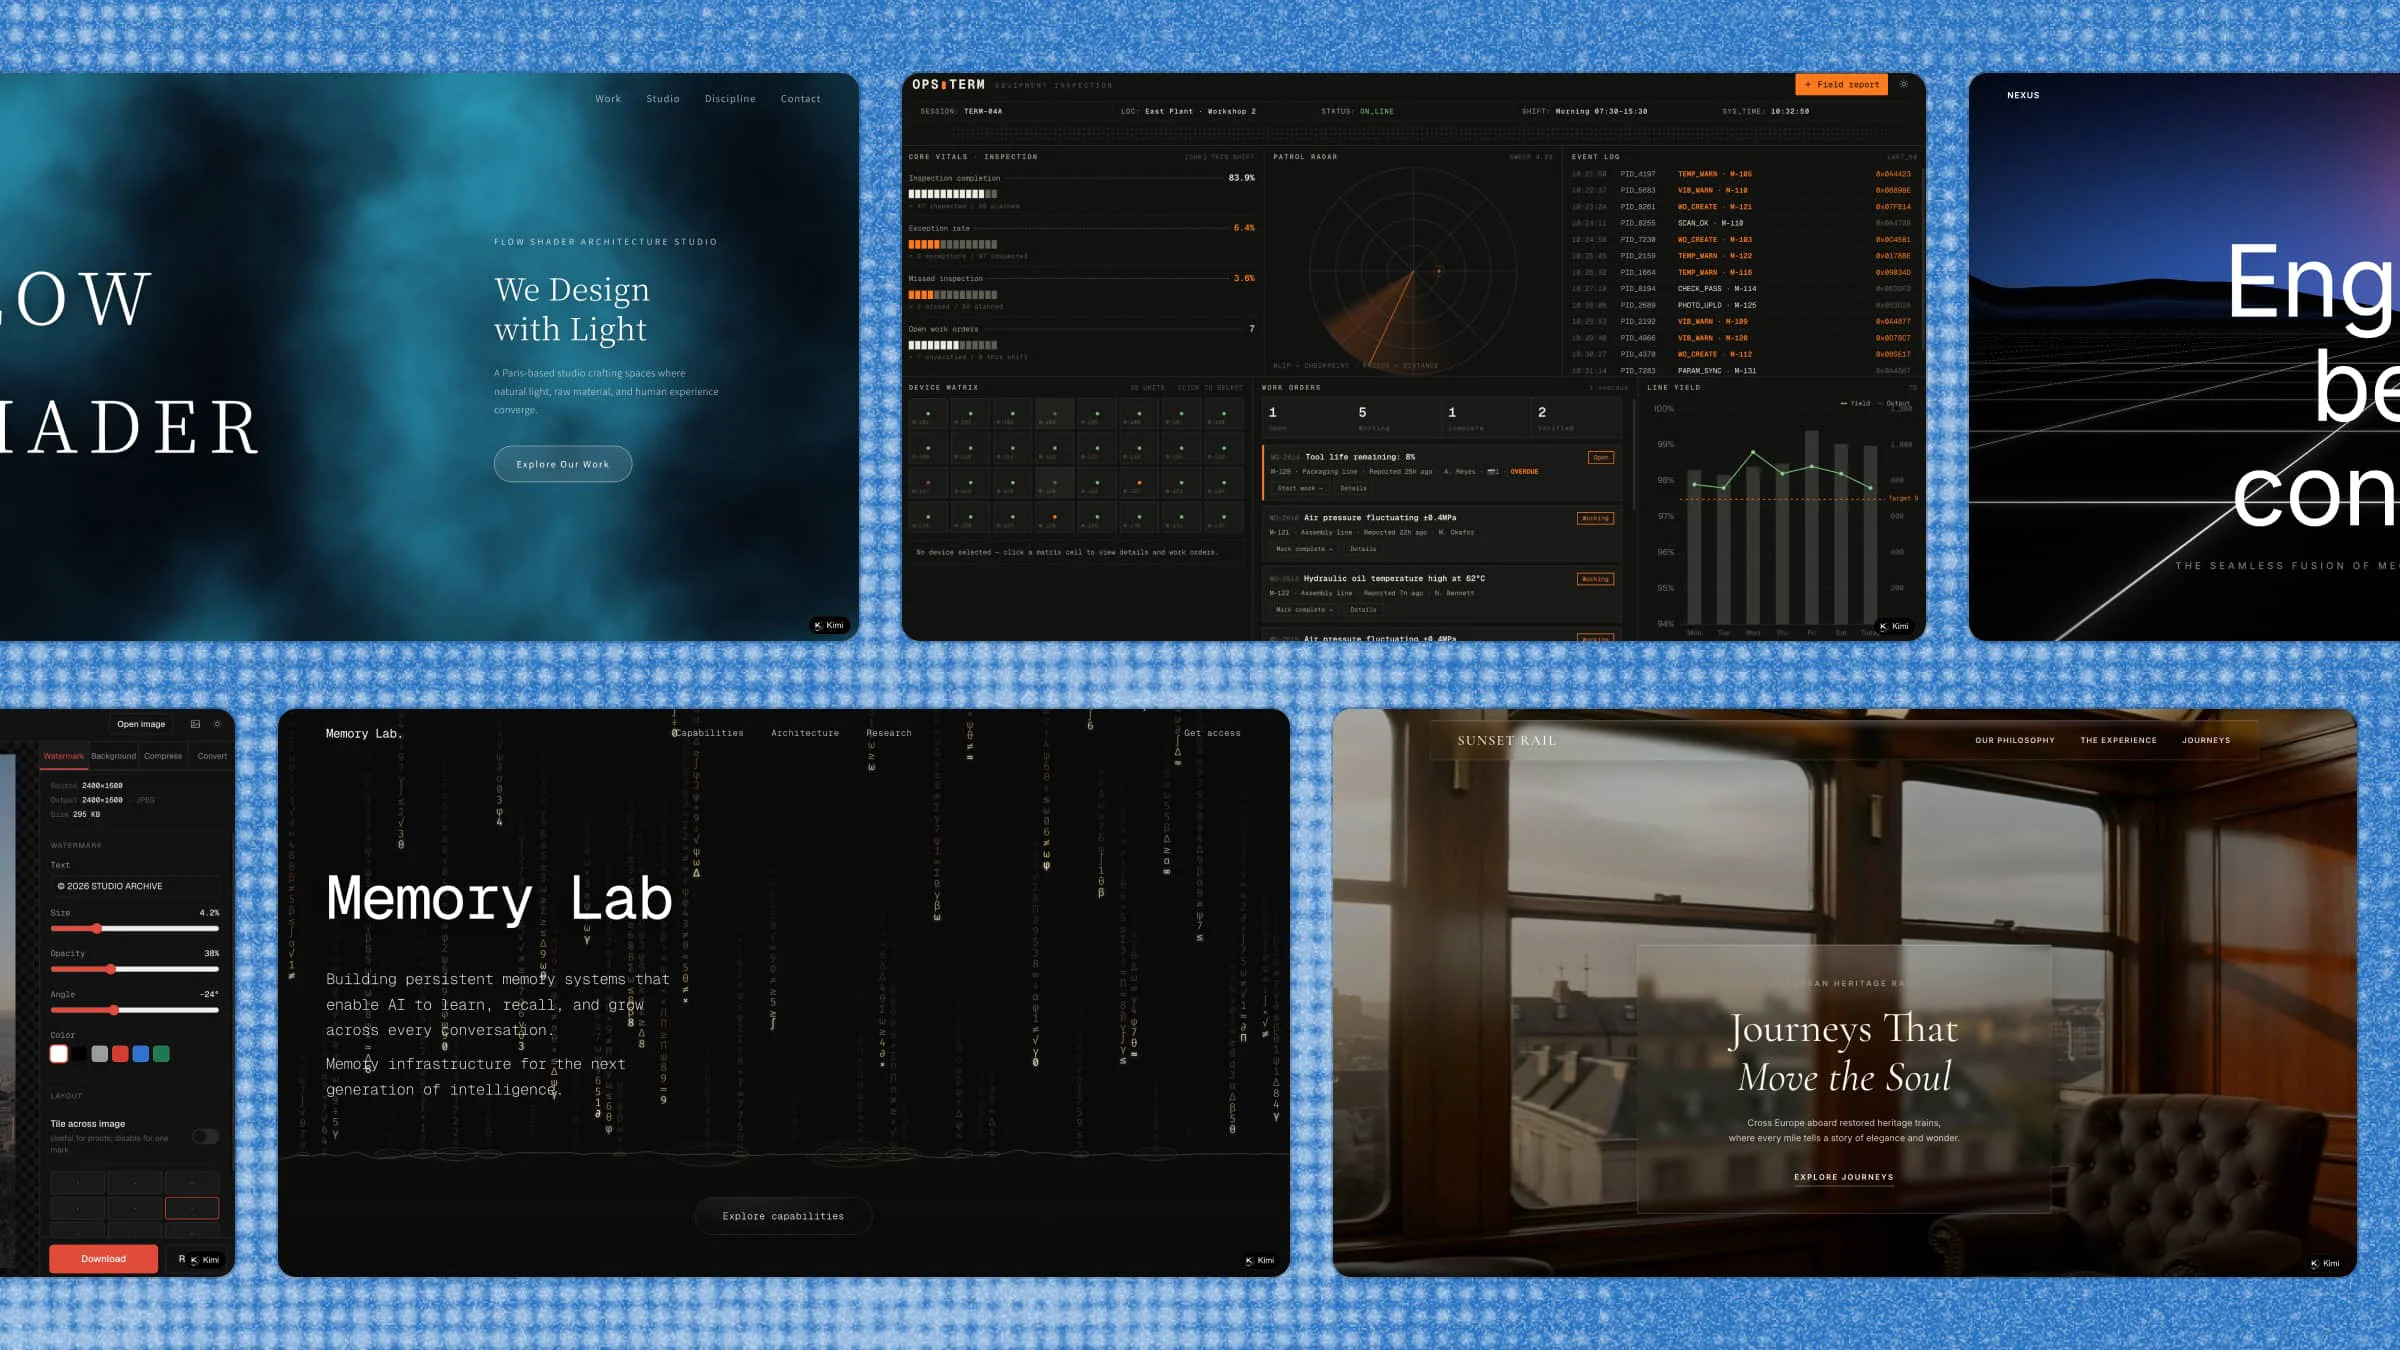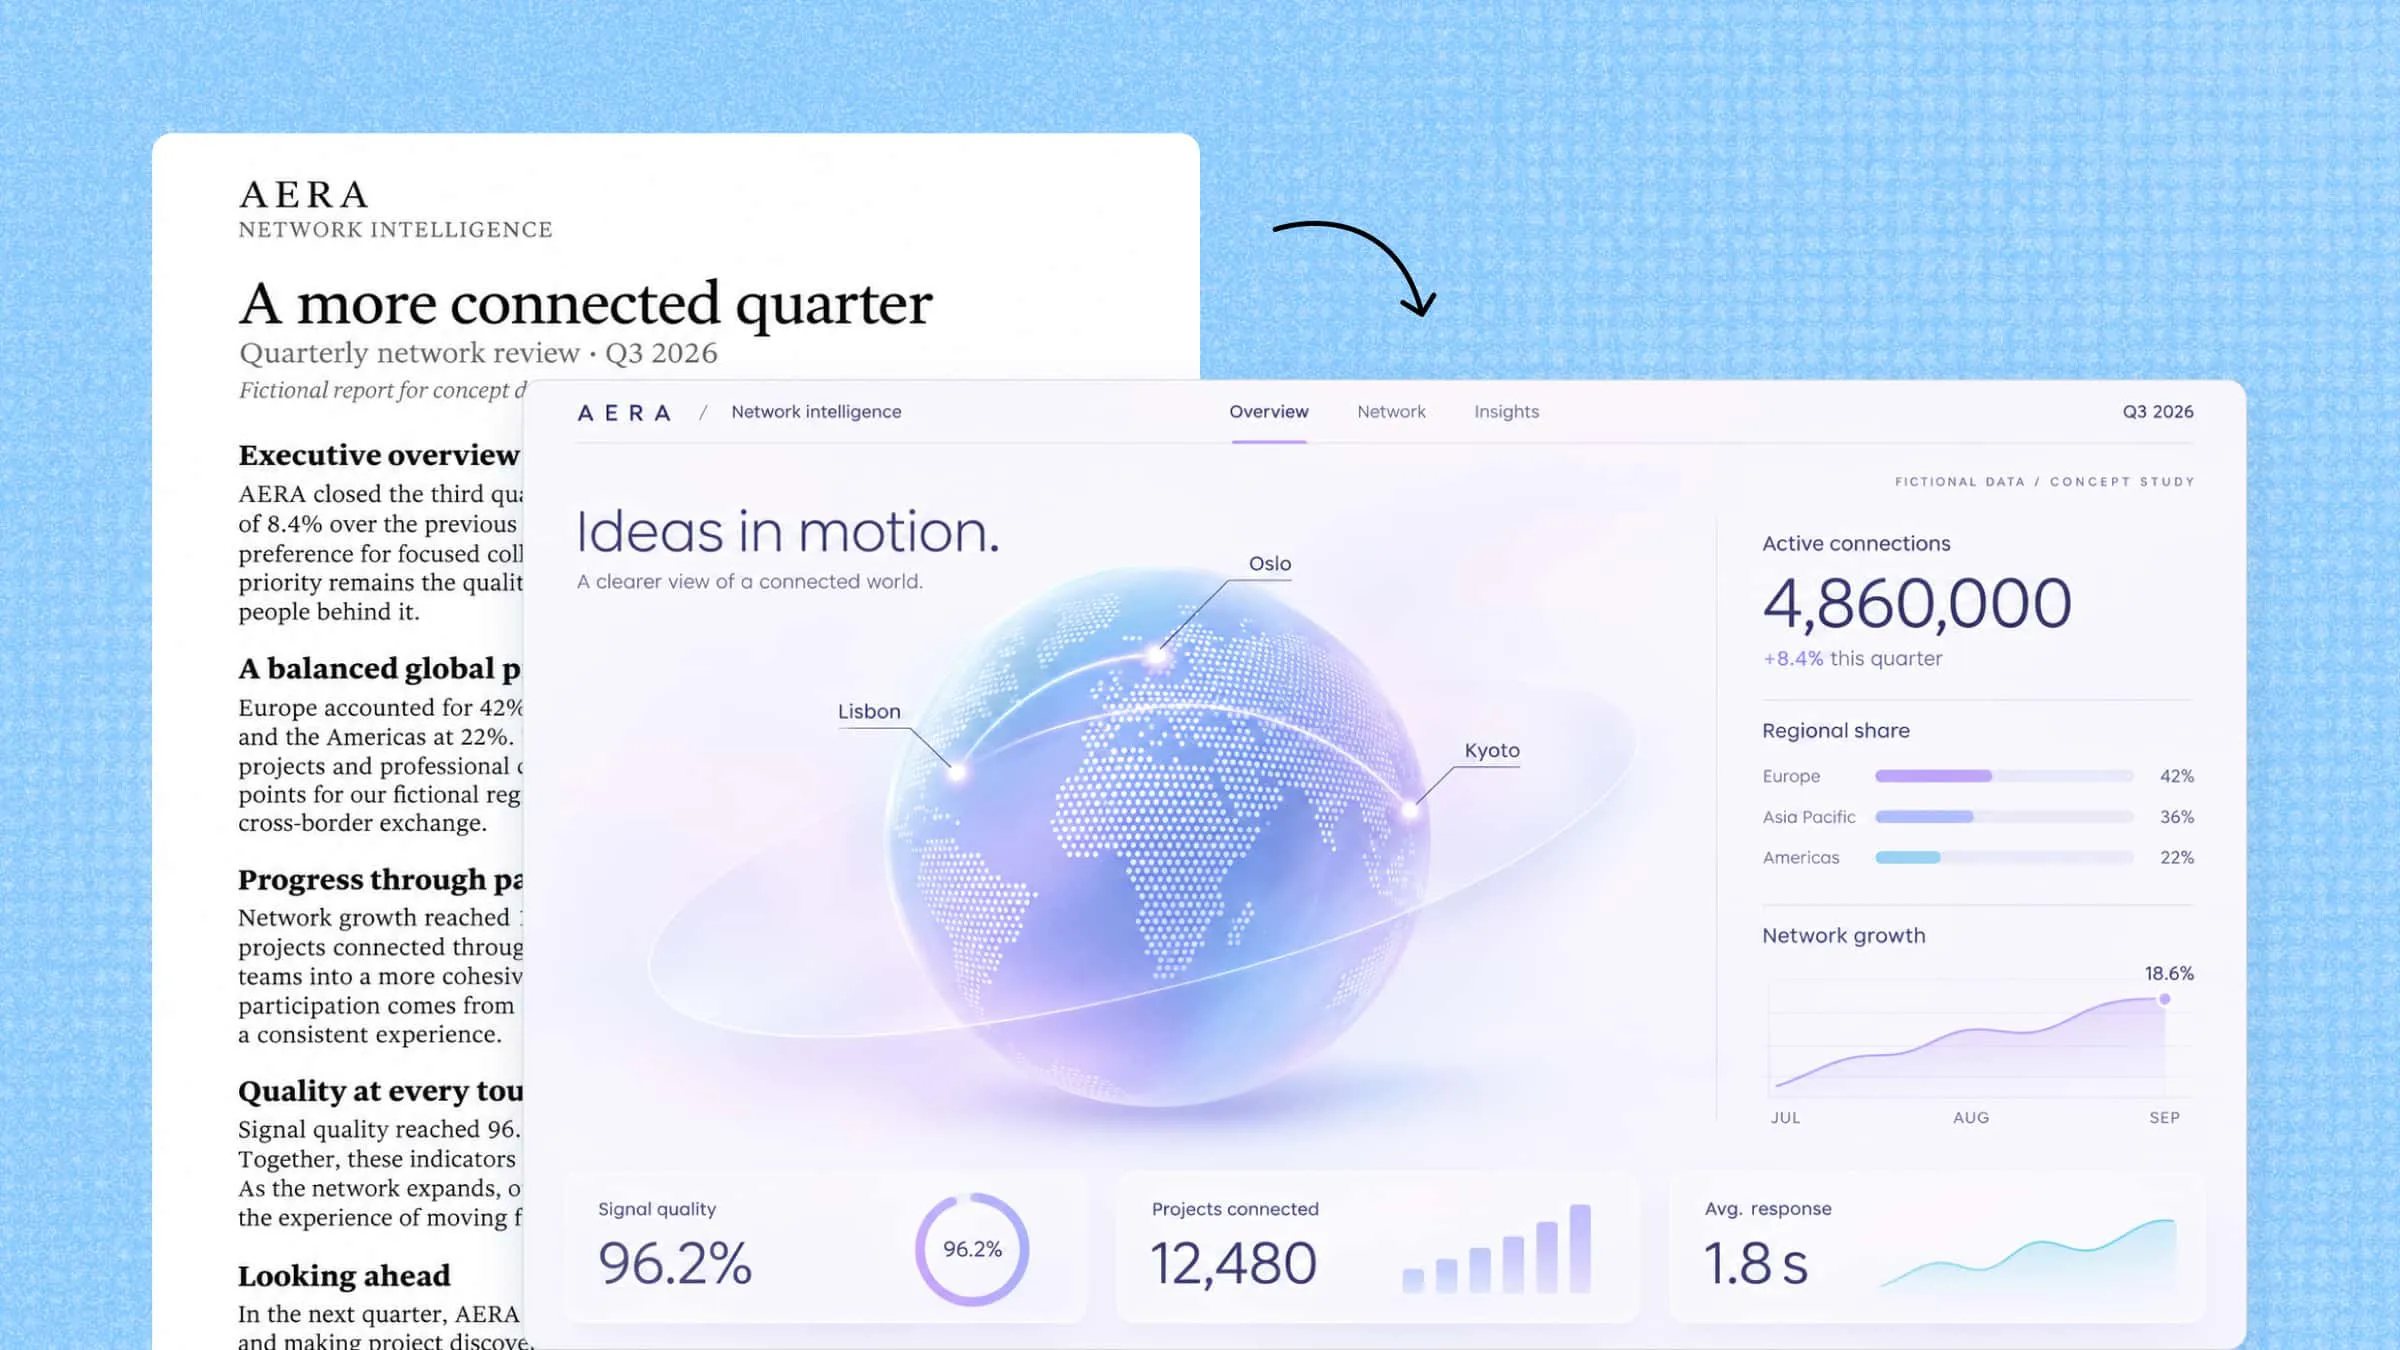
Raw data often contains useful answers, but finding them is not always easy when everything is spread across rows, columns, and spreadsheets. AI-powered data visualization tools help bring those details together through clear charts, interactive dashboards, and visual reports. Some can even create complete dashboards from simple text prompts or uploaded files. In this article, we'll explore 10 tools that make working with data easier.
Overview of 10 AI tools for data visualization
AI data visualization tools vary in how they process data and present insights. Understanding these differences can help you choose a tool based on your data sources, technical experience, and intended output. The table below provides an overview of 10 options and their primary use cases.
| Tool | How you work with it | Main focus | Suitable for |
|---|---|---|---|
| Kimi Build | Text prompts, uploaded files, and visual references | Generating interactive webpages and data visualizations | Creating custom interactive dashboards and visualization webpages |
| Julius AI | Natural-language questions and uploaded datasets | Conversational data analysis and chart generation | Exploring datasets, identifying trends, and generating reports |
| ChatGPT | File uploads and natural-language prompts | Data analysis, visualization, and code generation | Analyzing datasets and creating custom charts |
| Tableau Cloud | Connected data sources and visual analytics tools | Interactive dashboards and enterprise data analytics | Exploring business data and sharing analytics across teams |
| Microsoft Power BI | Data connections, data models, and report-building tools | Business intelligence and interactive reporting | Monitoring business performance and analyzing operational metrics |
| Zoho Analytics | Connected data sources, reports, and natural-language queries | Business analytics and automated reporting | Building dashboards and tracking business metrics |
| Google Gemini | Natural-language prompts and Google Workspace integrations | AI-assisted analysis and insights within Google Workspace | Working with spreadsheet data and supporting data-related tasks in Google Workspace |
| ThoughtSpot | Natural-language searches and connected data sources | Search-driven analytics and business intelligence | Exploring business data and answering questions with analytics |
| Polymer | Uploaded spreadsheets and connected data sources | AI-assisted dashboard and chart creation | Turning spreadsheet data into interactive dashboards |
| Venngage | Templates, uploaded data, and AI-assisted design tools | Infographics and visual reports | Presenting data through visual storytelling and business reports |
Explore 10 AI-powered data visualization tools
From creating quick charts to exploring complex datasets, the right tool can make a real difference in how you work with information. Some focus on advanced analysis, while others keep things simple with AI-powered features. Here is a list of 10 data visualization tools to consider for your needs.
Kimi Build
Kimi Build is an AI-powered tool for creating interactive data visualizations and dashboards from text prompts, uploaded files, or screenshots. It converts raw information into clear charts, graphs, and visual reports without requiring coding skills. Users can also make changes through chat instructions, customize dashboard elements, and share their finished visualizations easily.

Main features
Turn data visualization ideas into interactive webpages: Describe the data you want to present, your target audience, and the information visitors should be able to explore. Kimi Build can turn these requirements into a structured visualization webpage with charts, data sections, and interactive elements. You can create dedicated pages for sales performance, market trends, survey results, financial statistics, and other data-driven topics without building the frontend from scratch.
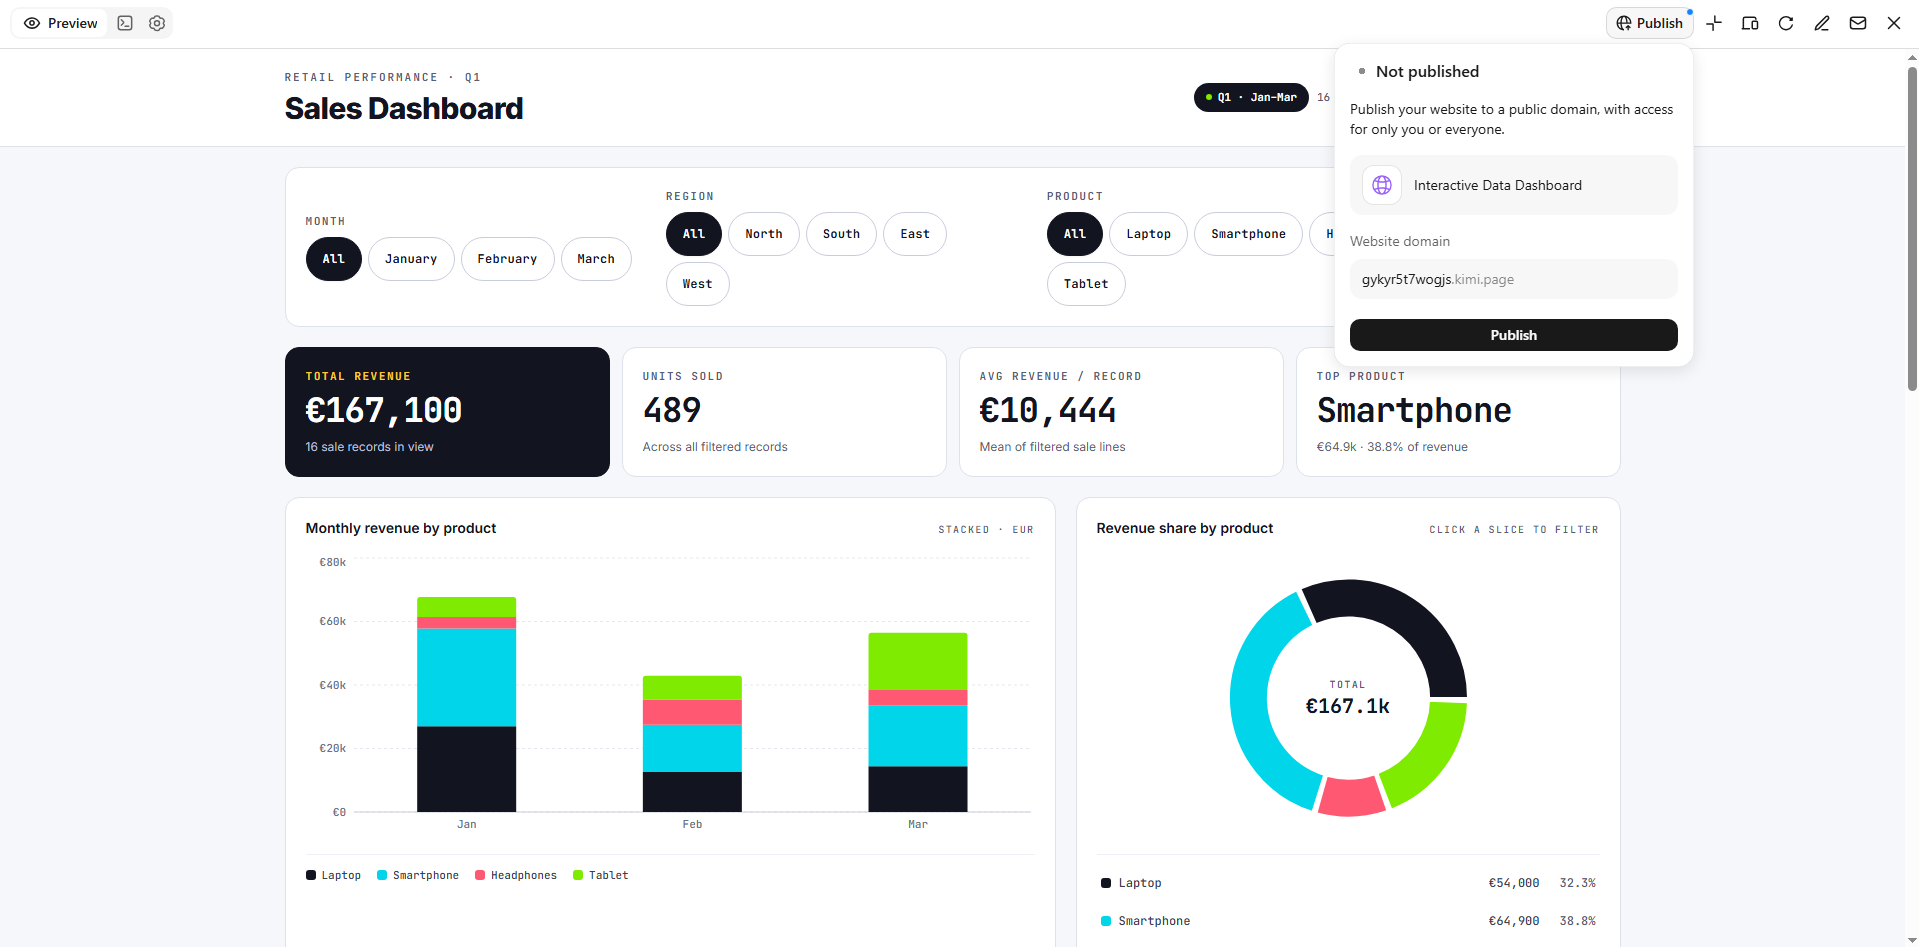
Create customized and interactive data visualizations: Combine charts, statistics, explanatory text, comparison sections, and supporting visuals into structured webpages. Kimi Build lets you customize page layouts and visual styles while adding interactive elements such as filters and selectable components. For example, you can create a sales dashboard where visitors filter data by region or product category to explore specific results.
Refine charts and page components through natural-language instructions: If a chart is difficult to read or a section does not present information as intended, describe the changes you want. You can adjust page layouts, chart presentation, colors, typography, labels, and other visual details through conversational instructions. You can also select specific webpage elements and leave comments for more targeted edits.
Manage versions and publish visualization projects: Refine your data visualization webpage through multiple rounds of edits while keeping track of previous versions. Kimi Build allows you to revisit earlier designs and restore previous versions when needed, so you can experiment with different layouts, visual styles, and interactive elements. Once the project is ready, preview it across desktop and mobile views, publish it to generate a shareable link, or access the project code for further development.
Suitable for
Creating interactive sales and business performance dashboards
Building visual reports to present market research and survey results
Developing data-driven webpages to track financial trends and statistics
Designing interactive dashboards to compare products, regions, or business performance
How to visualize data with AI
Creating a data visualization with Kimi Build is simple, even if you have no coding experience. You can describe what you want to create and refine the results through chat instructions. Follow these steps to get started.
Step 1: Upload the file and write a prompt
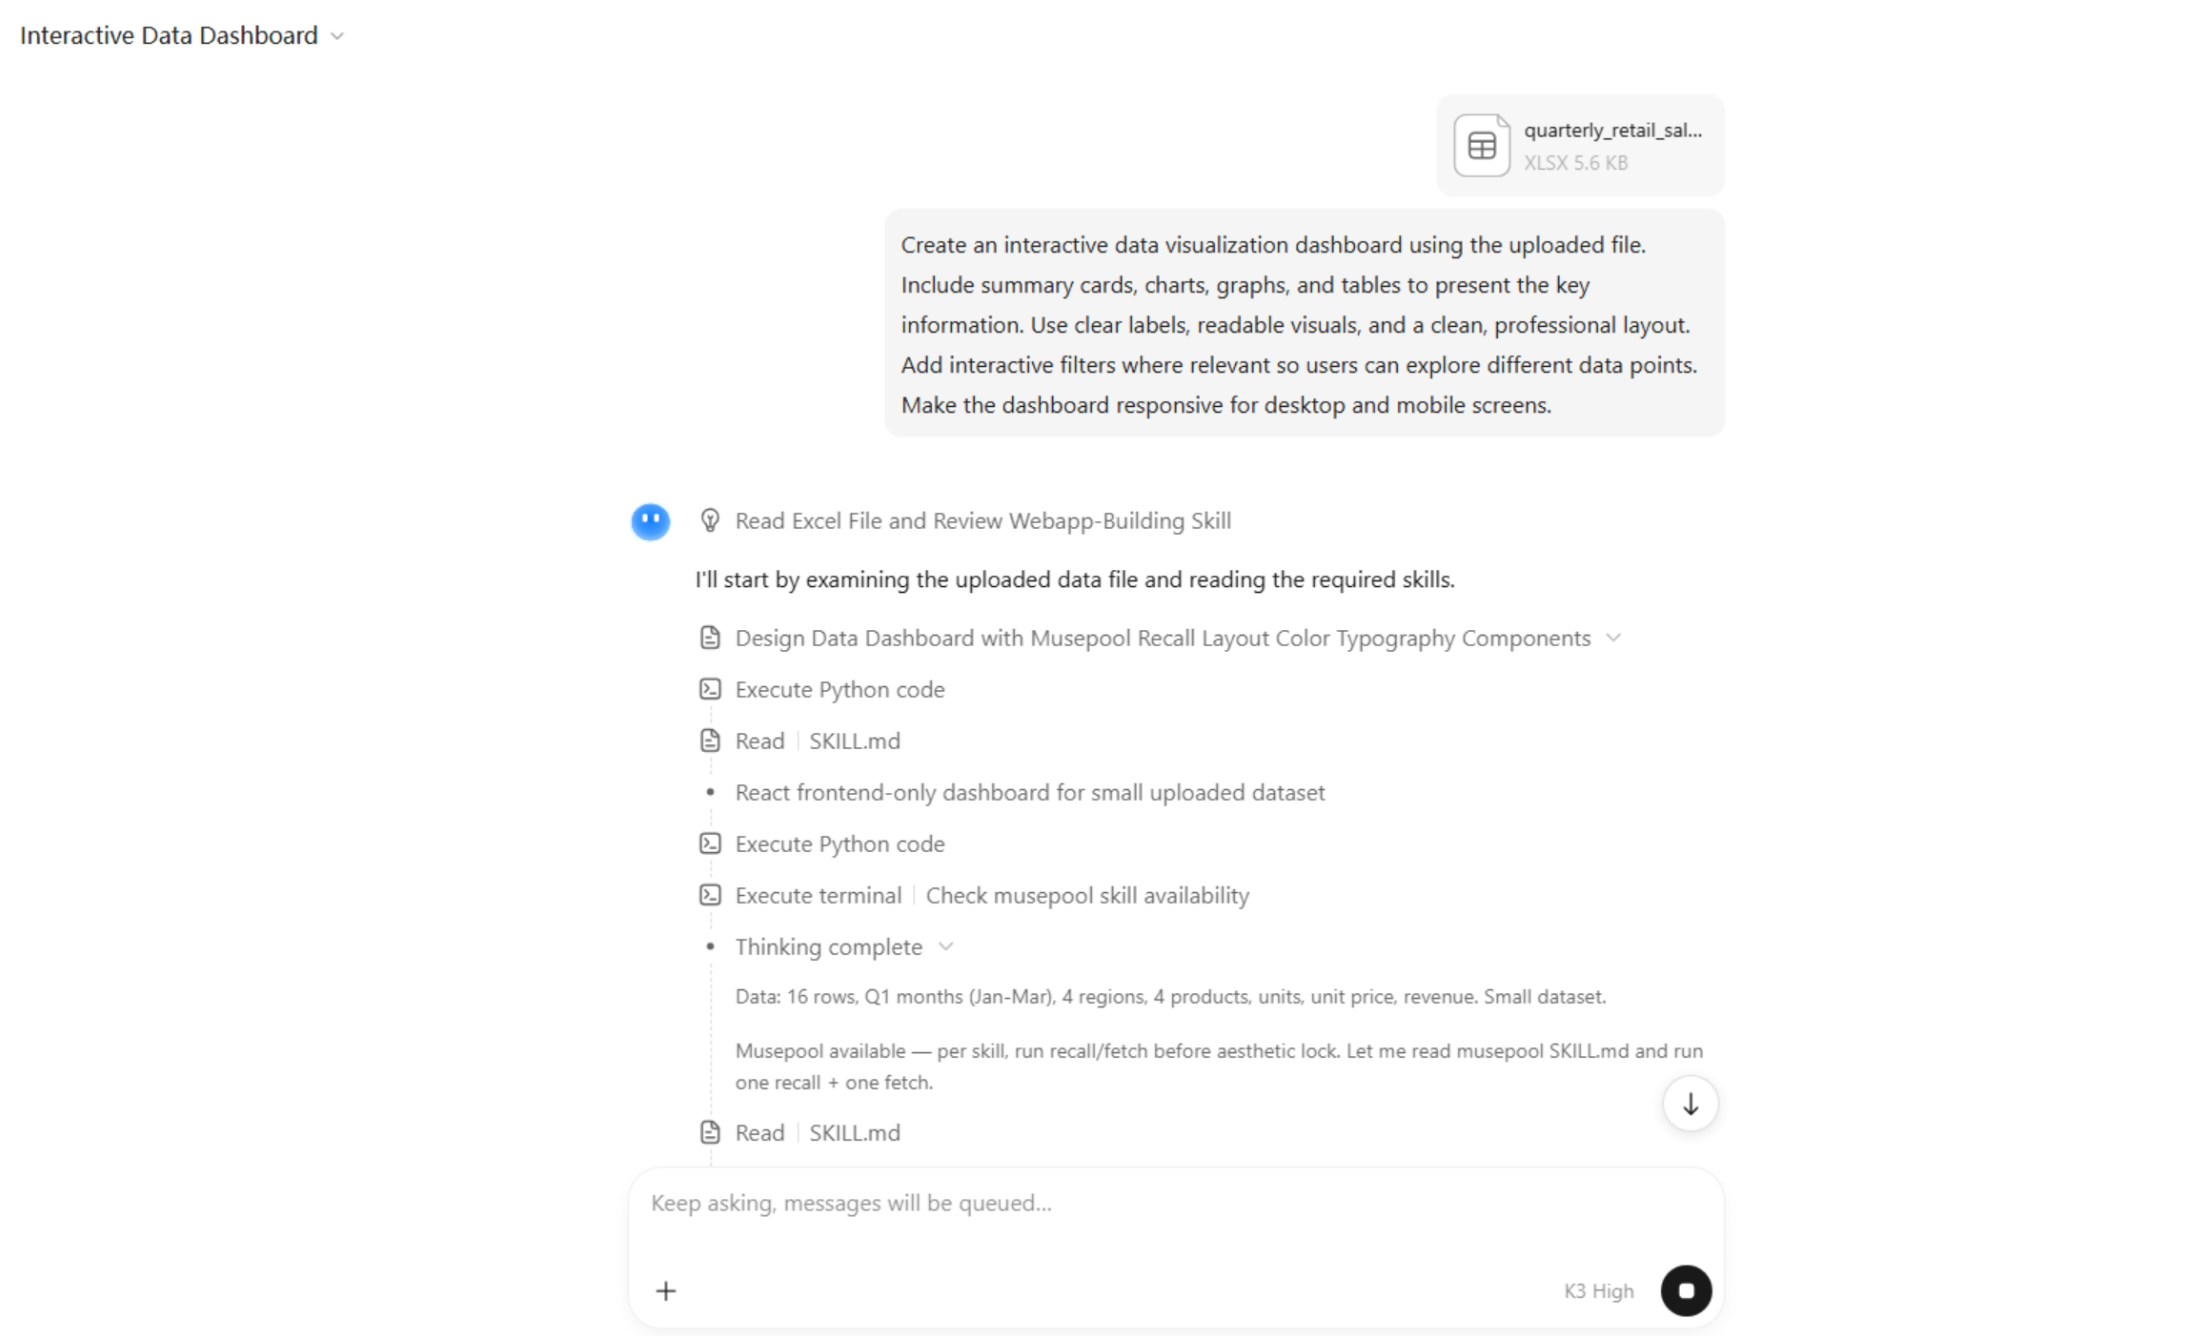
Open Kimi Build, upload your data file, and describe the type of visualization you want to create. Include details about the charts, layout, visual style, and interactive elements you need.
Example prompt:

Step 2: Let AI generate output
Kimi Build analyzes the provided information and generates a visualization based on your instructions. Wait for it to create the charts, layout, and interactive elements, then explore the generated result.
Step 3: Review and publish
Review the generated visualization and check whether it presents the information clearly. Use chat instructions to adjust the design, update chart styles, or refine individual elements. Once everything looks right, preview the final result and publish it to create a shareable link.
Julius AI
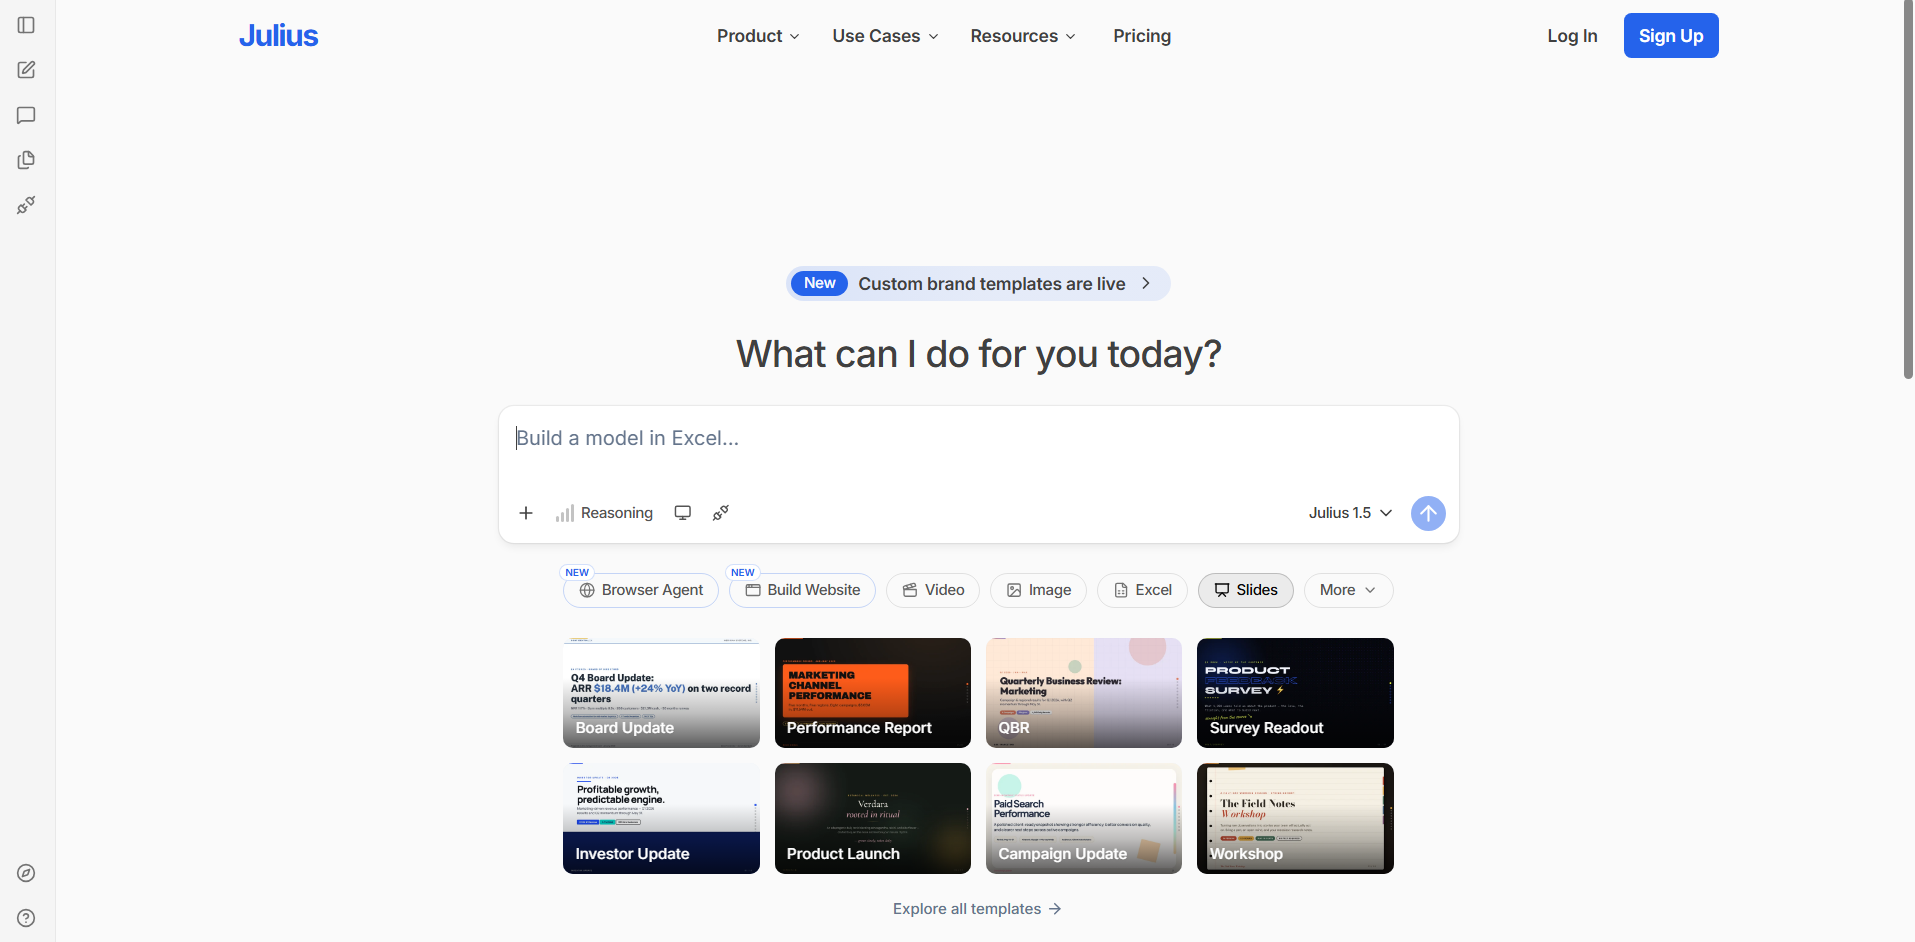
Julius AI is an AI-powered data analysis platform that helps users explore datasets and create visual reports through natural language prompts. It allows you to upload spreadsheets and other data files, ask questions about their contents, and generate charts based on the results. The platform combines data analysis, visualization, and reporting in one workspace.
Main features
Analyze data using natural language: Ask questions about your datasets in plain English. Julius AI interprets your requests and provides relevant answers.
Generate charts and graphs: Create visual representations of your data by describing what you want to see. Choose suitable chart types to present your findings.
Work with multiple data formats: Upload spreadsheets, CSV files, and other supported formats. Analyze information without manually restructuring every dataset.
Create reports and summaries: Turn analysis results into written explanations and visual reports. This makes important findings easier to communicate.
Suitable for
Exploring and analyzing spreadsheet data
Creating charts from business datasets
Summarizing research and survey results
Preparing visual reports for presentations
ChatGPT
ChatGPT is a conversational AI assistant that can help users analyze data and create visualizations through natural language instructions. It supports file uploads, data interpretation, chart generation, and Python-based analysis. Users can ask questions about their datasets, explore trends, and refine visual outputs through follow-up prompts. This makes it a flexible option for combining data analysis with interactive problem-solving.
Main features
Analyze uploaded datasets: Upload supported files and ask questions about their contents. ChatGPT can identify patterns, calculate values, and explain results.
Create data visualizations: Request charts, graphs, and other visual representations. Describe the information you want to highlight.
Generate Python code: Create code for more advanced data analysis and customized charts. You can also request changes to the generated code.
Explain complex findings: Turn technical results into simple explanations. This helps make data easier to understand and present.
Suitable for
Analyzing business and financial datasets
Creating customized charts and graphs
Exploring trends in research data
Explaining statistical results in simple language
Tableau Cloud
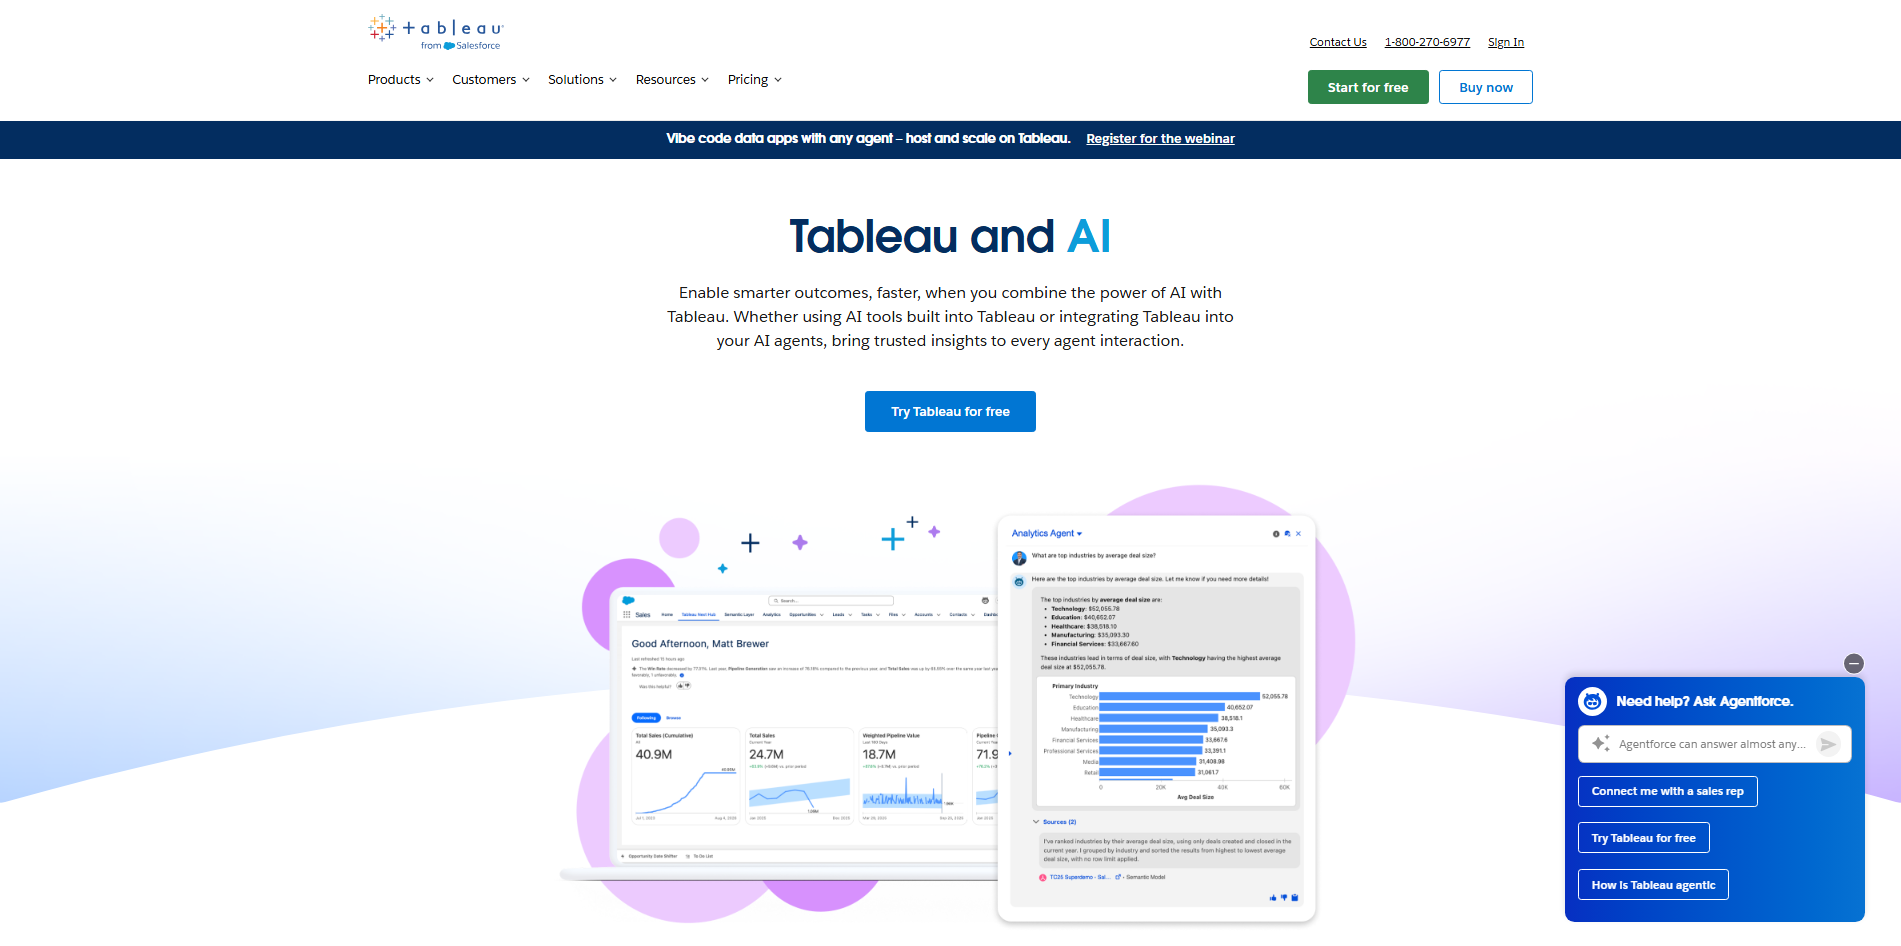
Tableau Cloud is a cloud-based analytics and business intelligence platform that helps organizations visualize and explore data. It provides interactive dashboards, visual analytics, and AI-assisted capabilities through its Tableau ecosystem. Users can connect different data sources and create visual reports that can be shared across teams.
Main features
Build interactive dashboards: Combine charts, tables, and other visual elements into one dashboard. Allow users to explore information through interactive controls.
Connect multiple data sources: Bring information together from different supported platforms. Analyze data without keeping everything in separate reports.
Explore data with AI assistance: Use Tableau's AI capabilities to understand trends and generate insights. Get additional context while exploring business information.
Share analytics with teams: Publish dashboards to a shared cloud environment. Give team members access to relevant reports and insights.
Suitable for
Monitoring business performance across departments
Creating interactive executive dashboards
Combining information from multiple data sources
Sharing analytics with distributed teams
Microsoft Power BI
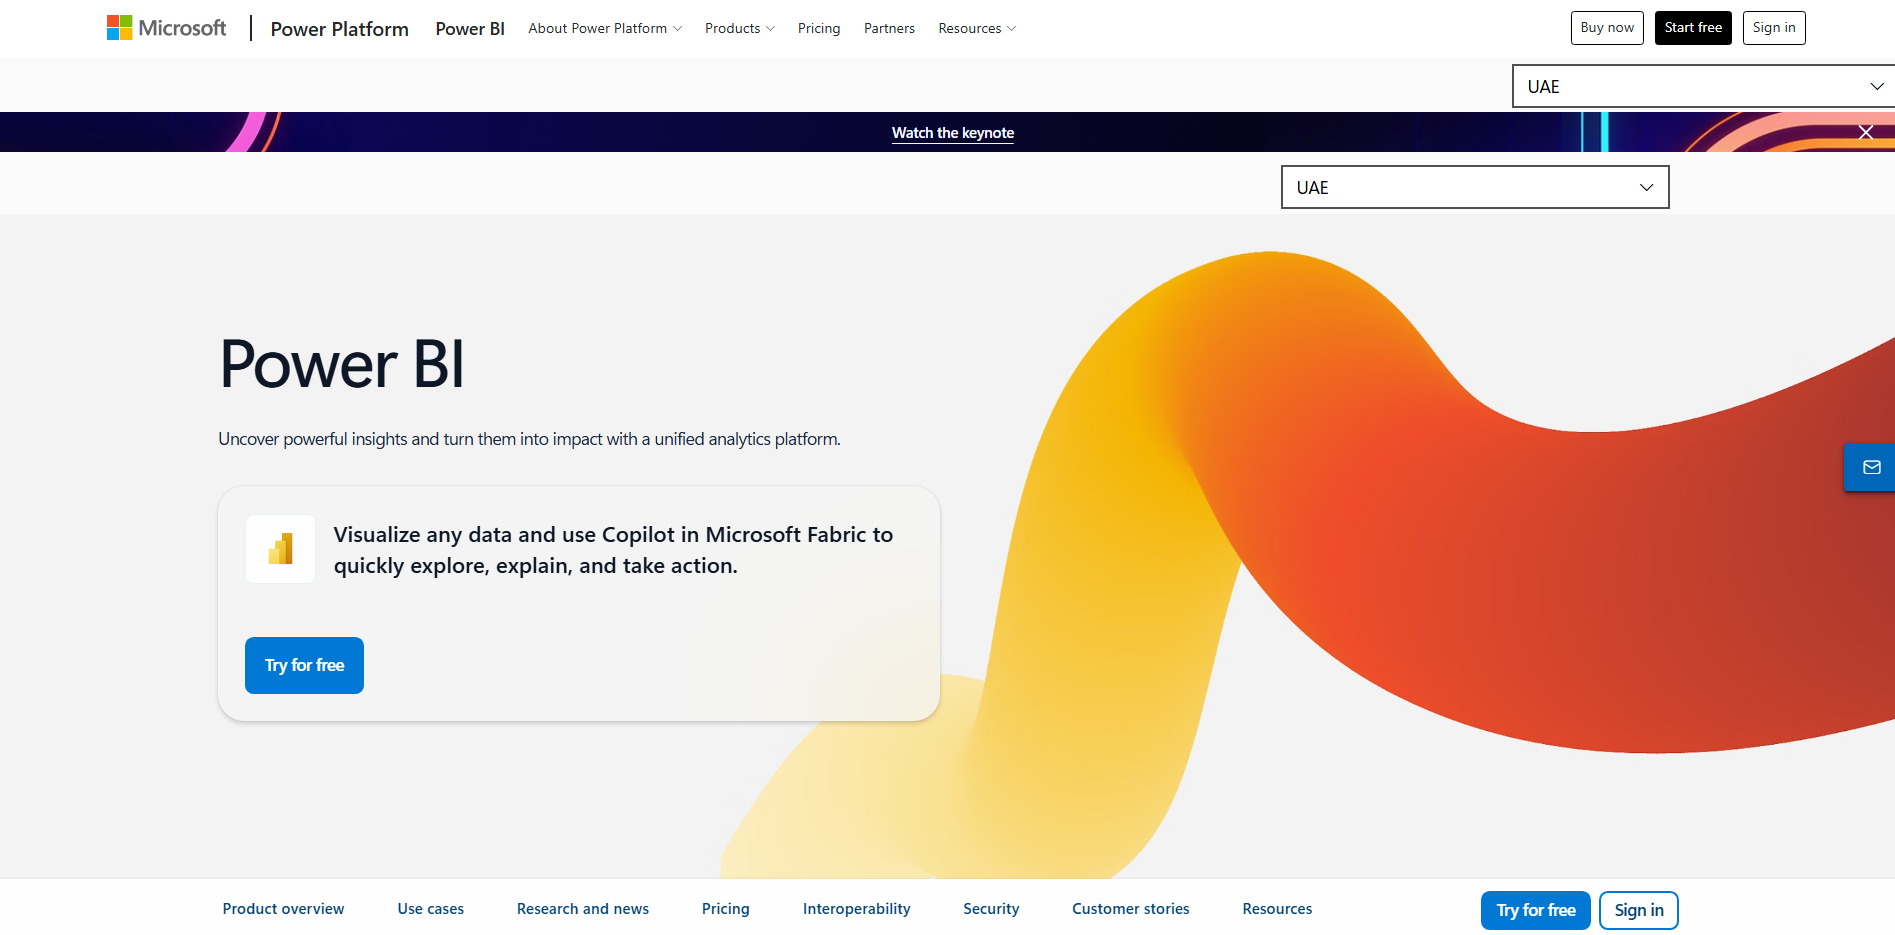
Microsoft Power BI is a business intelligence platform designed to transform organizational data into interactive reports and dashboards. It connects with Microsoft applications and various external data sources to support data preparation, modeling, and visualization. Its AI-powered capabilities help users explore information, identify patterns, and understand business performance.
Main features
Create interactive reports: Build dashboards using charts, maps, tables, and other visual elements. Add filters to explore specific information.
Use AI-powered insights: Identify trends, unusual changes, and patterns in datasets. Explore findings with built-in analytical capabilities.
Connect Microsoft services: Work with data from Excel, Azure, and other supported sources. Bring business information into a common reporting environment.
Prepare and model data: Clean, transform, and organize information before visualization. Create relationships between datasets for deeper analysis.
Suitable for
Tracking sales and financial performance
Building organizational reporting dashboards
Monitoring business operations and KPIs
Analyzing data from Microsoft applications
Zoho Analytics
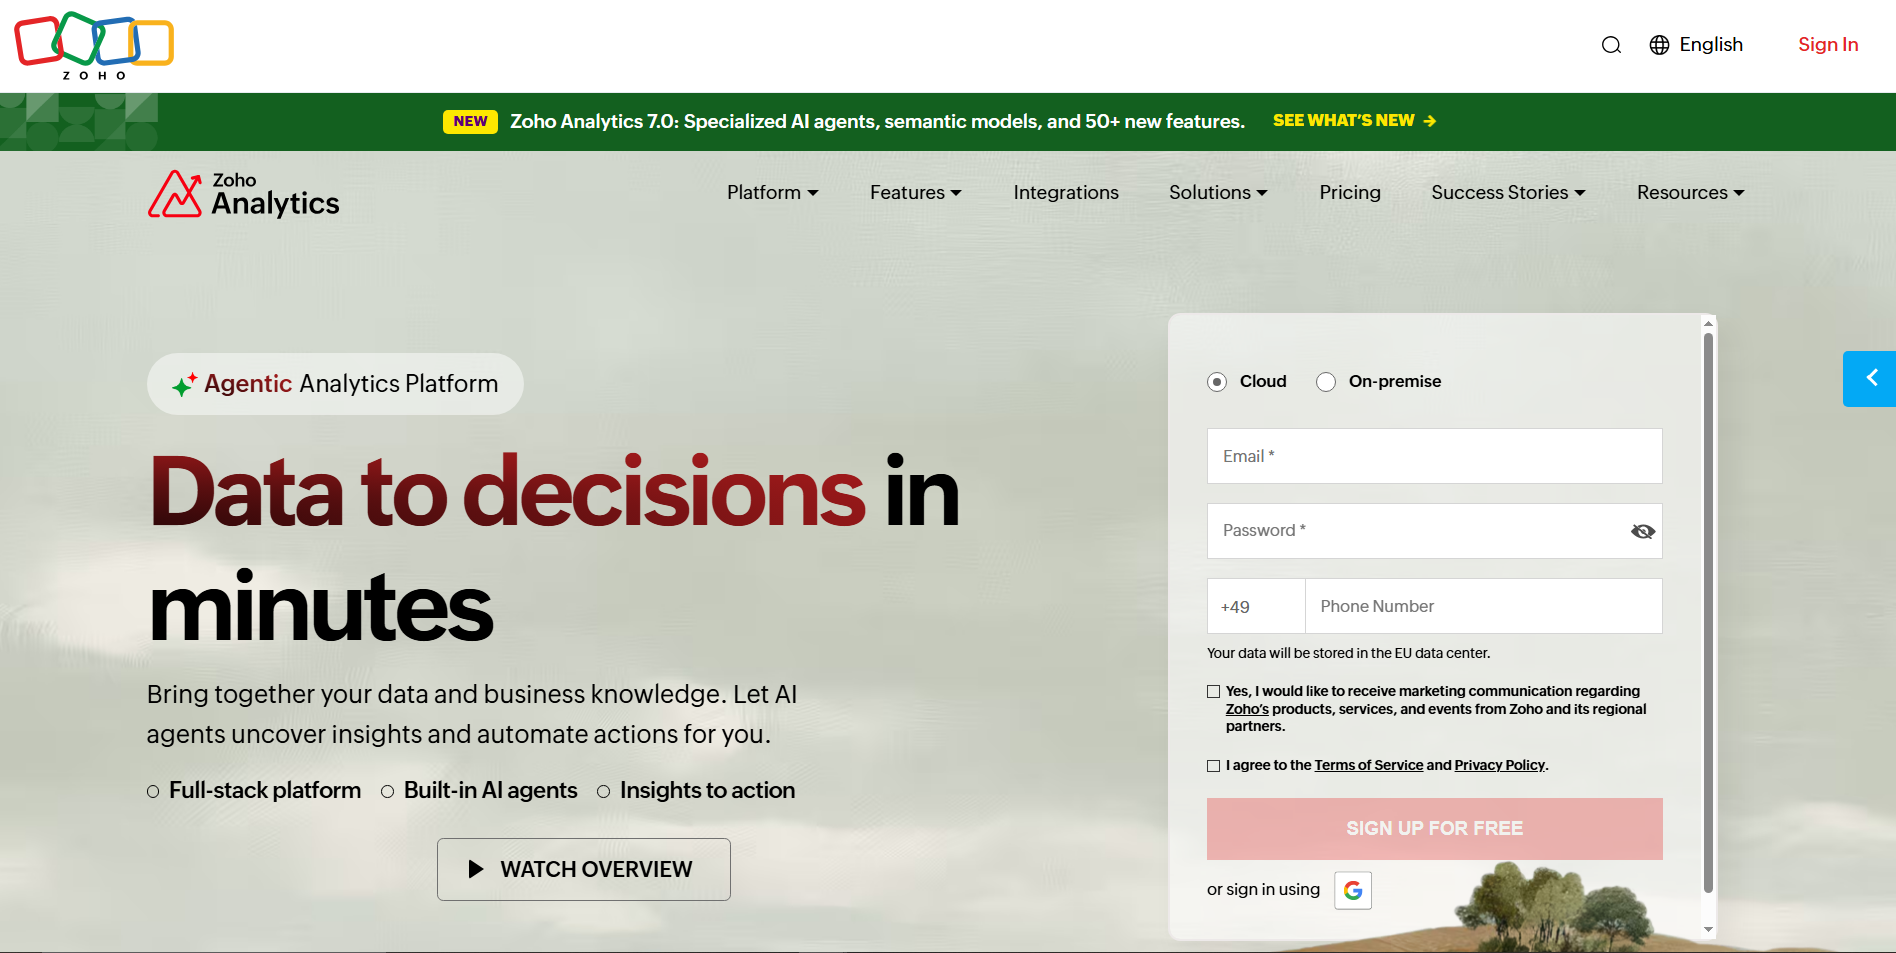
Zoho Analytics is a self-service business intelligence and data analytics platform that helps users create reports and dashboards from different data sources. It includes AI-powered assistance through its conversational analytics capabilities, allowing users to explore information using natural language. The platform also supports data preparation, visualization, and automated reporting.
Main features
Create visual reports: Build charts, tables, and dashboards using a visual report designer. Arrange different elements to present business findings.
Ask questions using AI: Use conversational queries to explore datasets and generate relevant reports. Get answers without manually building every chart.
Combine data from different sources: Connect business applications, databases, and spreadsheets. Analyze information together in one workspace.
Automate report delivery: Schedule reports and share updates with relevant users. Keep teams informed without repeatedly creating reports.
Suitable for
Analyzing customer and sales information
Creating automated business reports
Combining data from different business applications
Tracking company performance through dashboards
Google Gemini
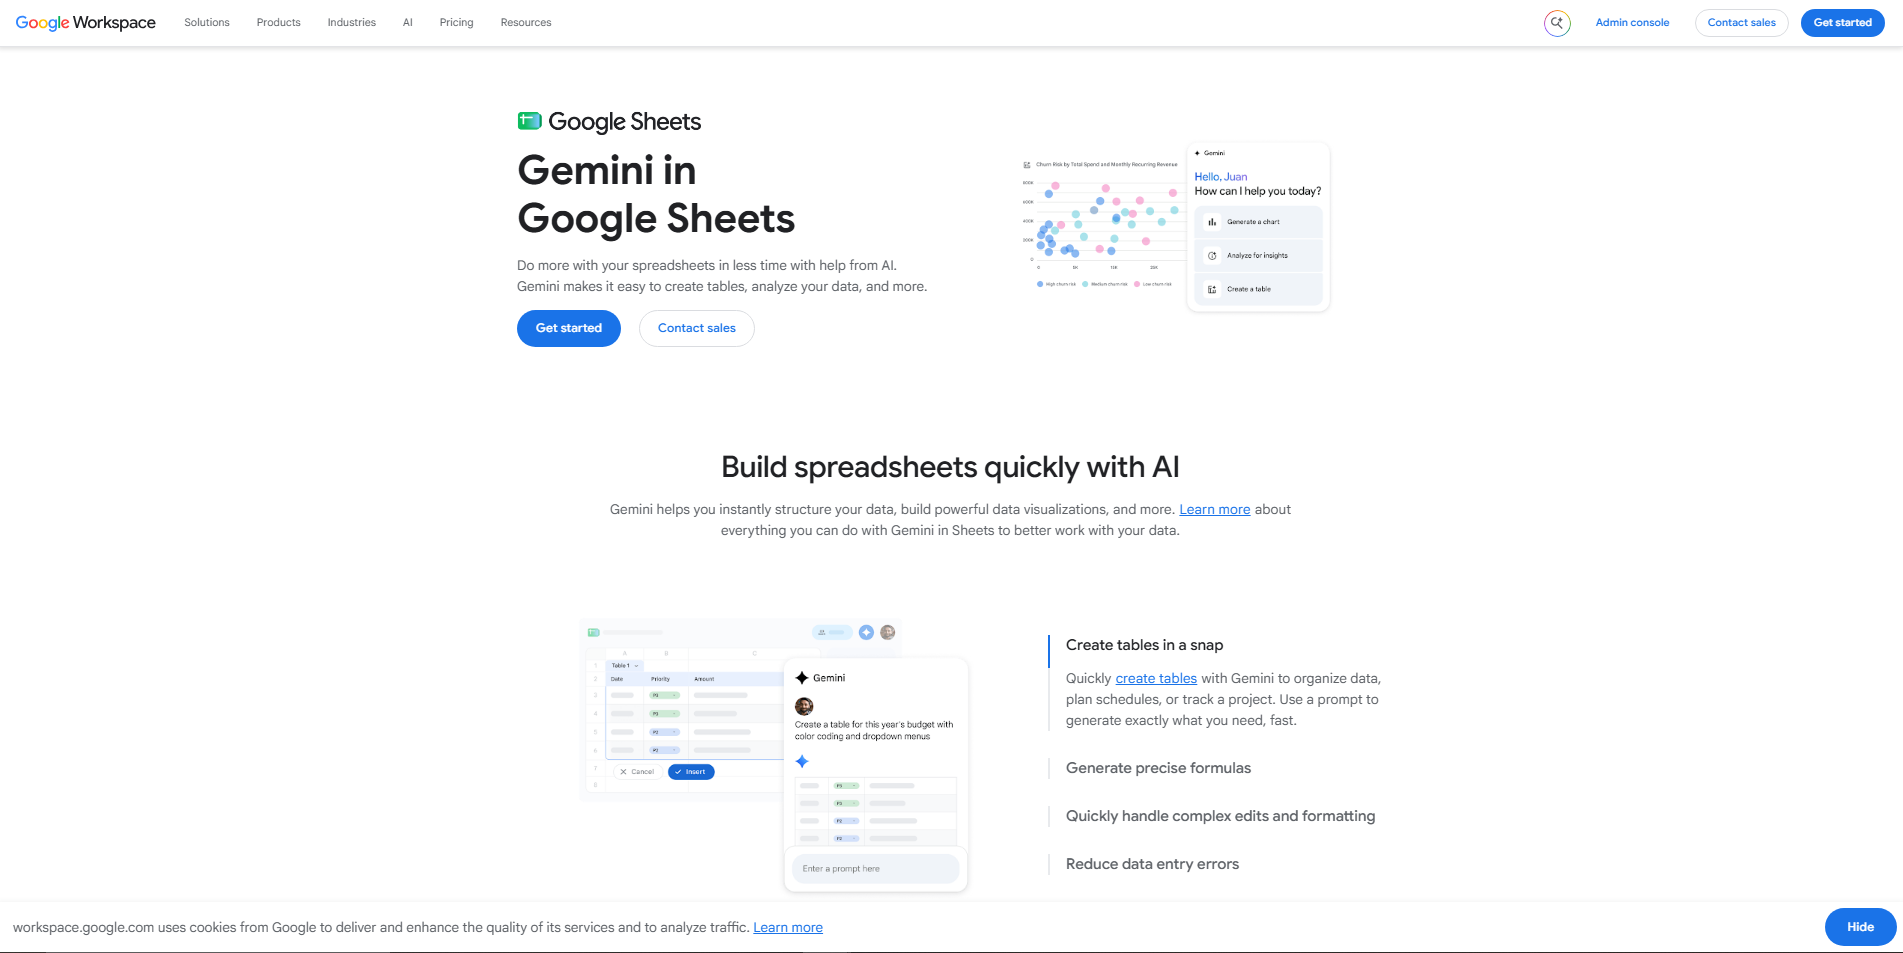
Google Gemini is Google's AI assistant that can help users understand datasets, explore information, and create visual representations of data. Depending on the available features and connected Google services, it can work with spreadsheet content and support analysis through natural language instructions. It can also assist with generating charts, interpreting results, and explaining numerical information.
Main features
Understand spreadsheet information: Use natural language questions to explore data and identify important details. Get explanations without manually reviewing every row.
Generate charts and visual summaries: Request visual representations of numerical information. Use charts to make comparisons and trends easier to understand.
Assist with data analysis: Ask Gemini to calculate values, identify patterns, and interpret results. Refine your analysis through follow-up questions.
Work with Google Workspace: Use supported integrations with Google Sheets and other Google services. Keep data-related tasks connected to your existing workflow.
Suitable for
Exploring information stored in Google Sheets
Summarizing large datasets
Creating charts for reports and presentations
Understanding trends in business information
ThoughtSpot
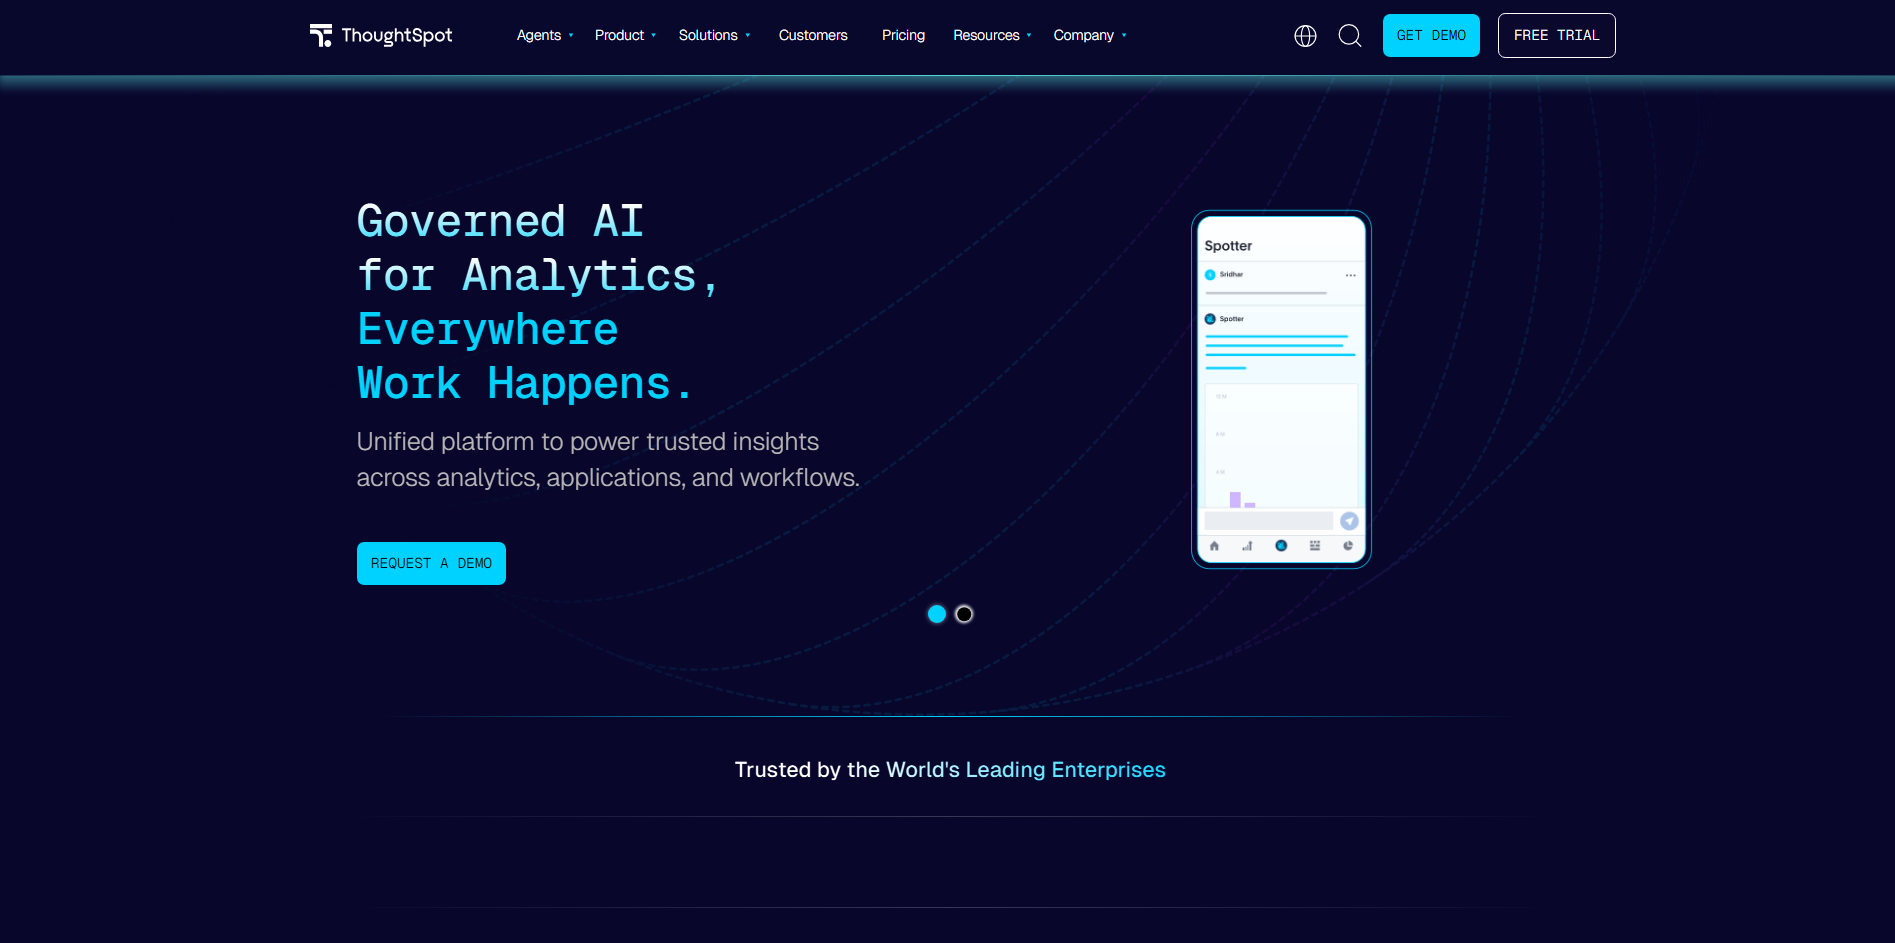
ThoughtSpot is an AI-powered analytics platform designed to help organizations search, explore, and visualize business data. It uses natural language search and AI-assisted analytics to make information accessible without requiring users to write complex queries. Its analytics environment supports interactive dashboards, data exploration, and automated insights.
Main features
Search data using natural language: Enter questions about business information to find relevant answers. Explore datasets without writing SQL queries.
Create interactive visualizations: Turn search results into charts and visual reports. Explore different views to understand the information.
Discover automated insights: Identify important changes, patterns, and unusual activity in business data. Use these findings to investigate potential issues.
Monitor business metrics: Track important performance indicators through dashboards. Keep relevant information accessible to decision-makers.
Suitable for
Exploring live business and operational data
Monitoring company performance metrics
Finding trends through natural language searches
Supporting data-driven business decisions
Polymer
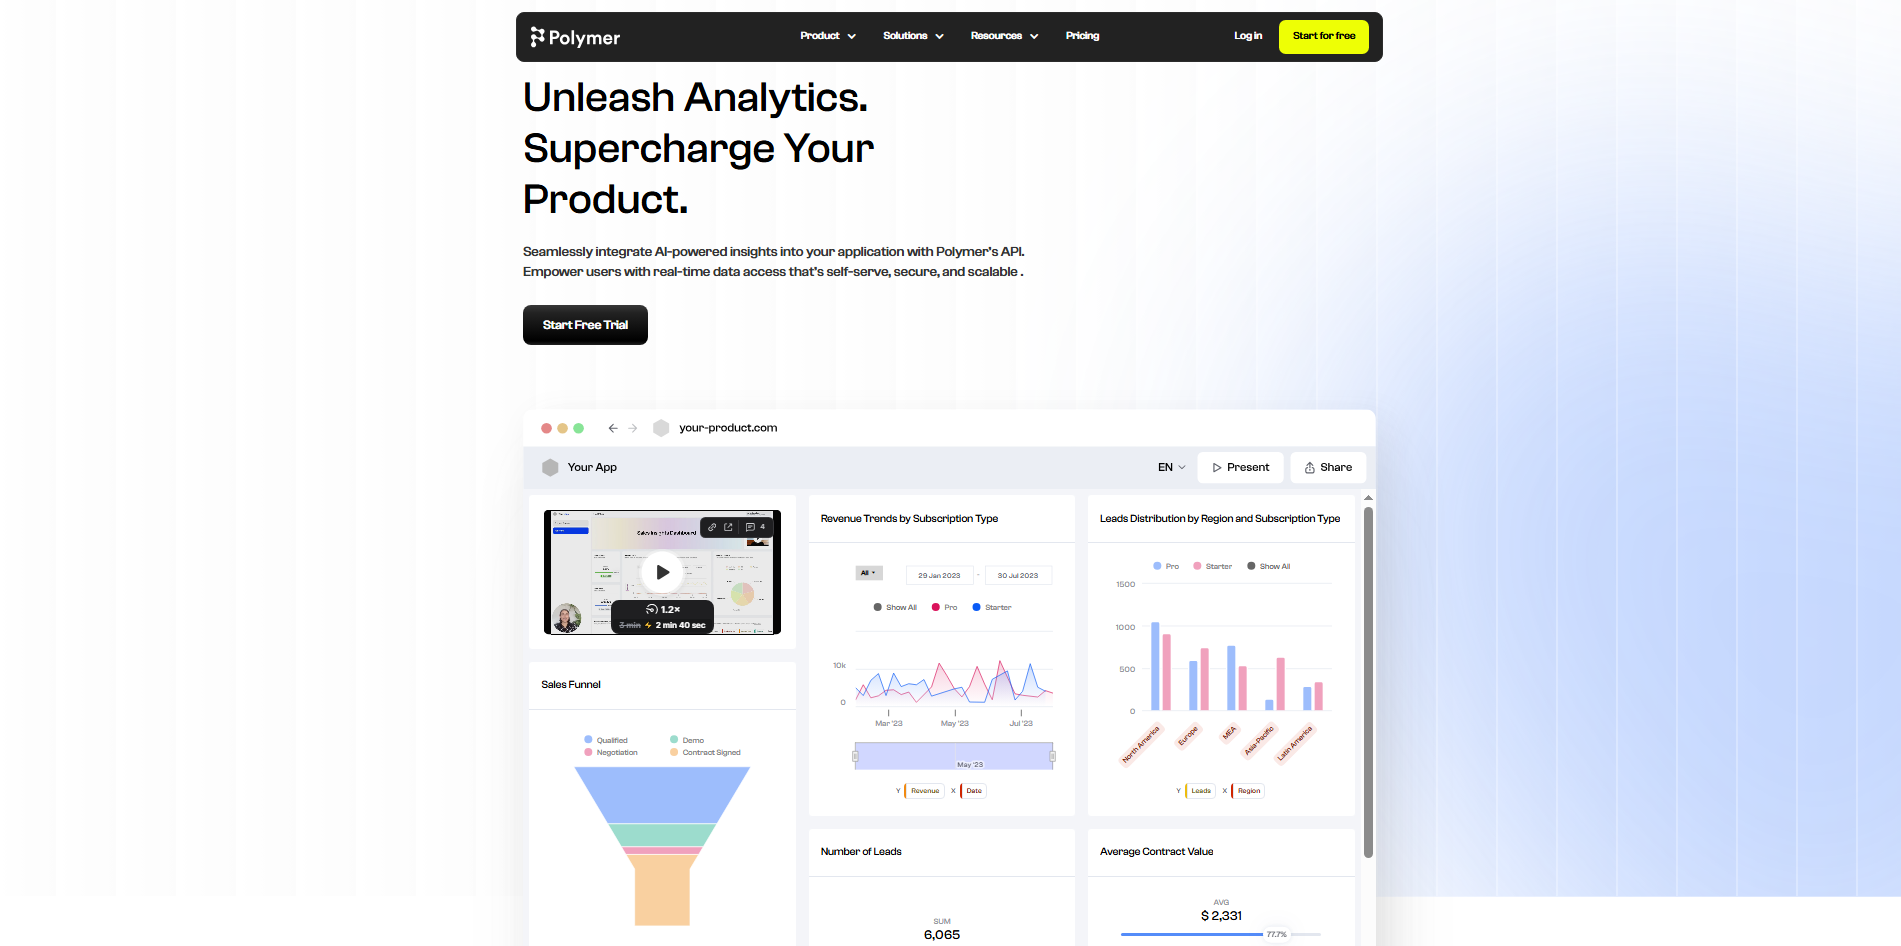
Polymer is an AI-powered data exploration and visualization platform that helps users turn spreadsheets and business datasets into interactive dashboards. It uses AI to understand uploaded information and suggest relevant ways to explore and present it. Users can create visual reports, organize data, and share findings without building dashboards entirely from scratch.
Main features
Convert spreadsheets into dashboards: Upload datasets and generate visual dashboards from their contents. Explore information through organized charts and summaries.
Discover data patterns: Use AI-assisted analysis to identify relationships and important trends. Get a clearer view of what your information shows.
Customize visual reports: Adjust charts, dashboard layouts, and displayed information. Present results according to your reporting needs.
Share interactive dashboards: Make visual reports available to other users. Help teams explore the same information in one place.
Suitable for
Turning spreadsheets into visual dashboards
Exploring customer and marketing data
Identifying patterns in business datasets
Sharing interactive reports with teams
Venngage
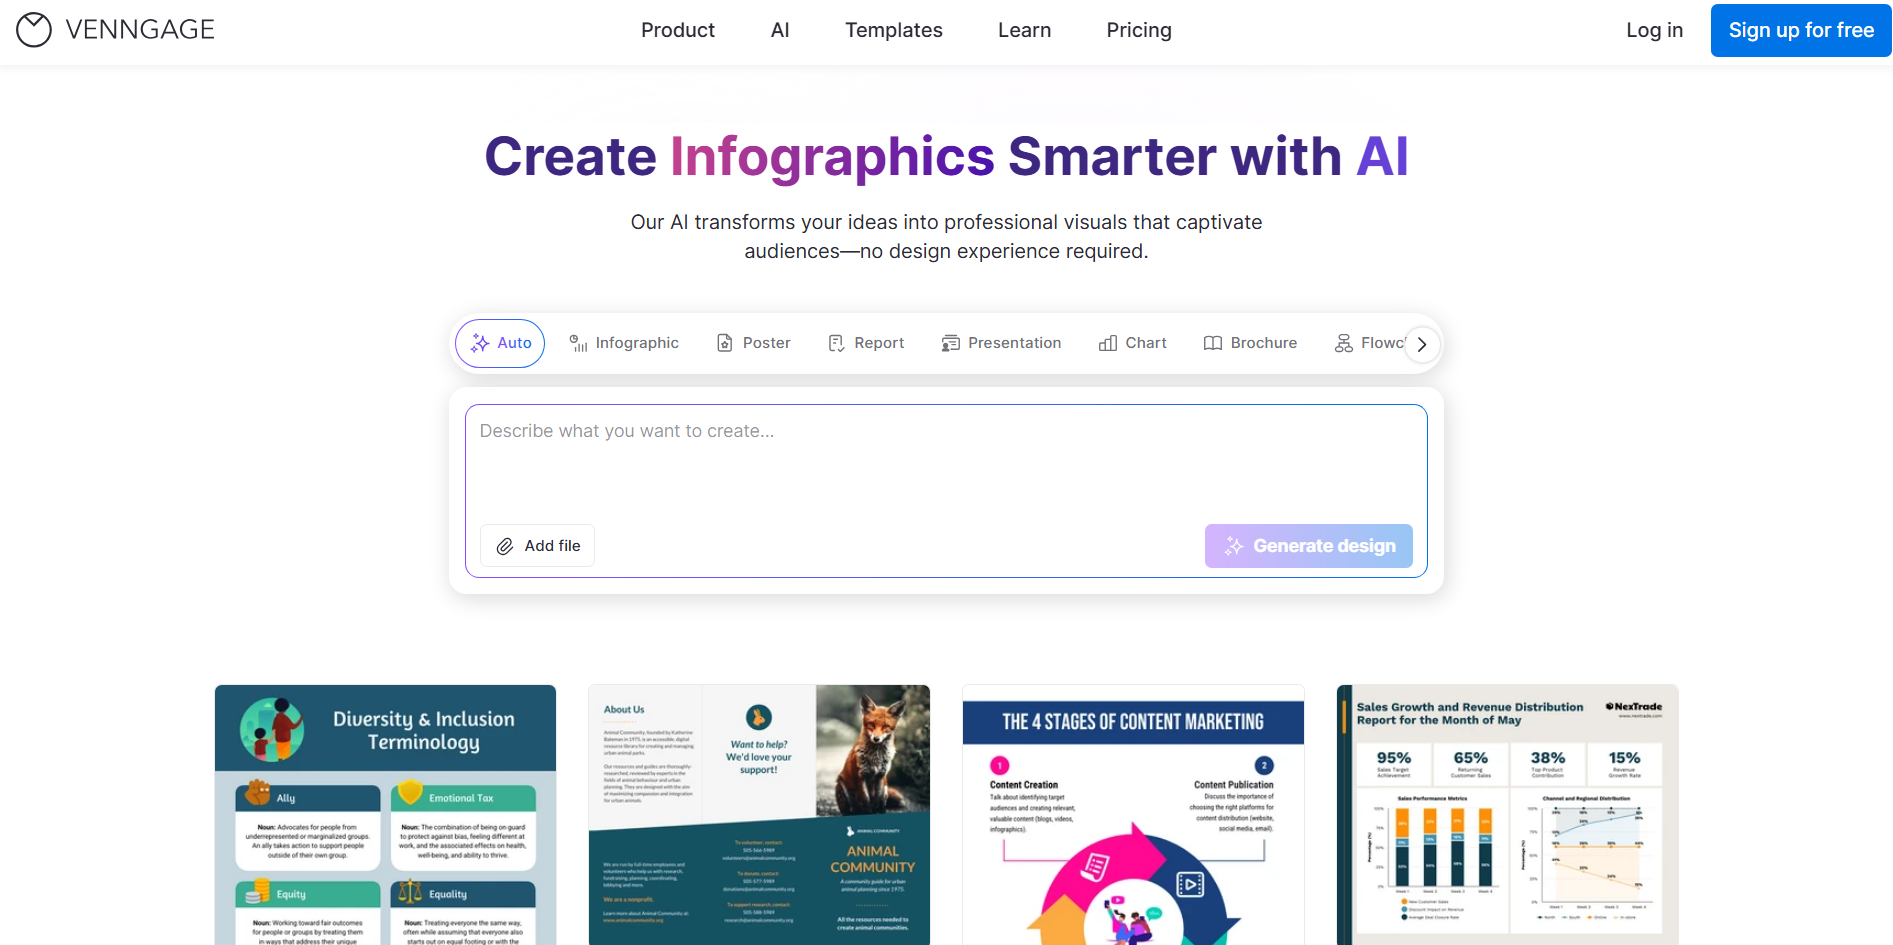
Venngage is a visual communication platform that helps users transform information into charts, infographics, reports, and presentations. Its AI-powered features support the creation of visual content from written instructions and existing information. Users can choose templates, customize layouts, and combine data with design elements to communicate findings clearly.
Main features
Create data-driven infographics: Turn statistics and important findings into visual stories. Use design elements to make information easier to follow.
Generate visuals with AI: Describe the content you want to present and use AI-assisted tools to create visual materials. Reduce the time spent designing from scratch.
Customize charts and templates: Choose layouts and adjust colors, labels, and other elements. Match visuals with your presentation or brand.
Collaborate on visual reports: Work with others to review and refine designs. Keep reports consistent across team projects.
Suitable for
Creating data-focused infographics
Presenting survey and research findings
Designing visual business reports
Preparing charts for educational materials
How to choose an AI tool for data visualization
Choosing the right tool involves more than finding one that creates attractive charts. You also need to consider how it handles your data, understands your instructions, and presents useful insights. Here are some important factors to consider before selecting an AI tool for data visualization.
Check whether the tool understands your data structure
Choose a tool that can recognize columns, data types, missing values, and relationships within your dataset. This helps it organize information correctly before generating charts or dashboards. Reliable AI tools for data analysis and visualization should also support common formats such as Excel and CSV.
Evaluate how well AI translates questions into charts
Look for a tool that understands natural-language questions and turns them into relevant visualizations. For example, asking it to compare monthly sales should produce a suitable chart with clear labels. It should also let you adjust the results when the initial output does not meet your needs.
Look for ways to explore data beyond static charts
Static charts show important figures, but interactive features make deeper analysis easier. Look for filters, selectable elements, and drill-down options that let you explore specific data points. These features make an AI data visualization generator more useful when working with large datasets.
Make sure you can verify and refine AI-generated results
Always check whether the generated charts display accurate figures and labels. Choose a tool that lets you review calculations, inspect source data, and correct mistakes. The ability to refine results also helps ensure your visualizations communicate the right information.
Consider how easily you can share and reuse visualizations
Check whether you can export charts, publish dashboards, or share reports through links. Reusable templates and version management can also save time on future projects. Choose a platform that fits your workflow and makes updating visualizations easier.
Conclusion
Turning numbers into something people can understand does not have to be a complicated process. With the right AI-powered data visualization tools, you can explore information, present useful findings, and communicate ideas more clearly. Your choice ultimately depends on how much flexibility and control you need. For an easy starting point, try Kimi Build and create interactive dashboards using simple instructions.