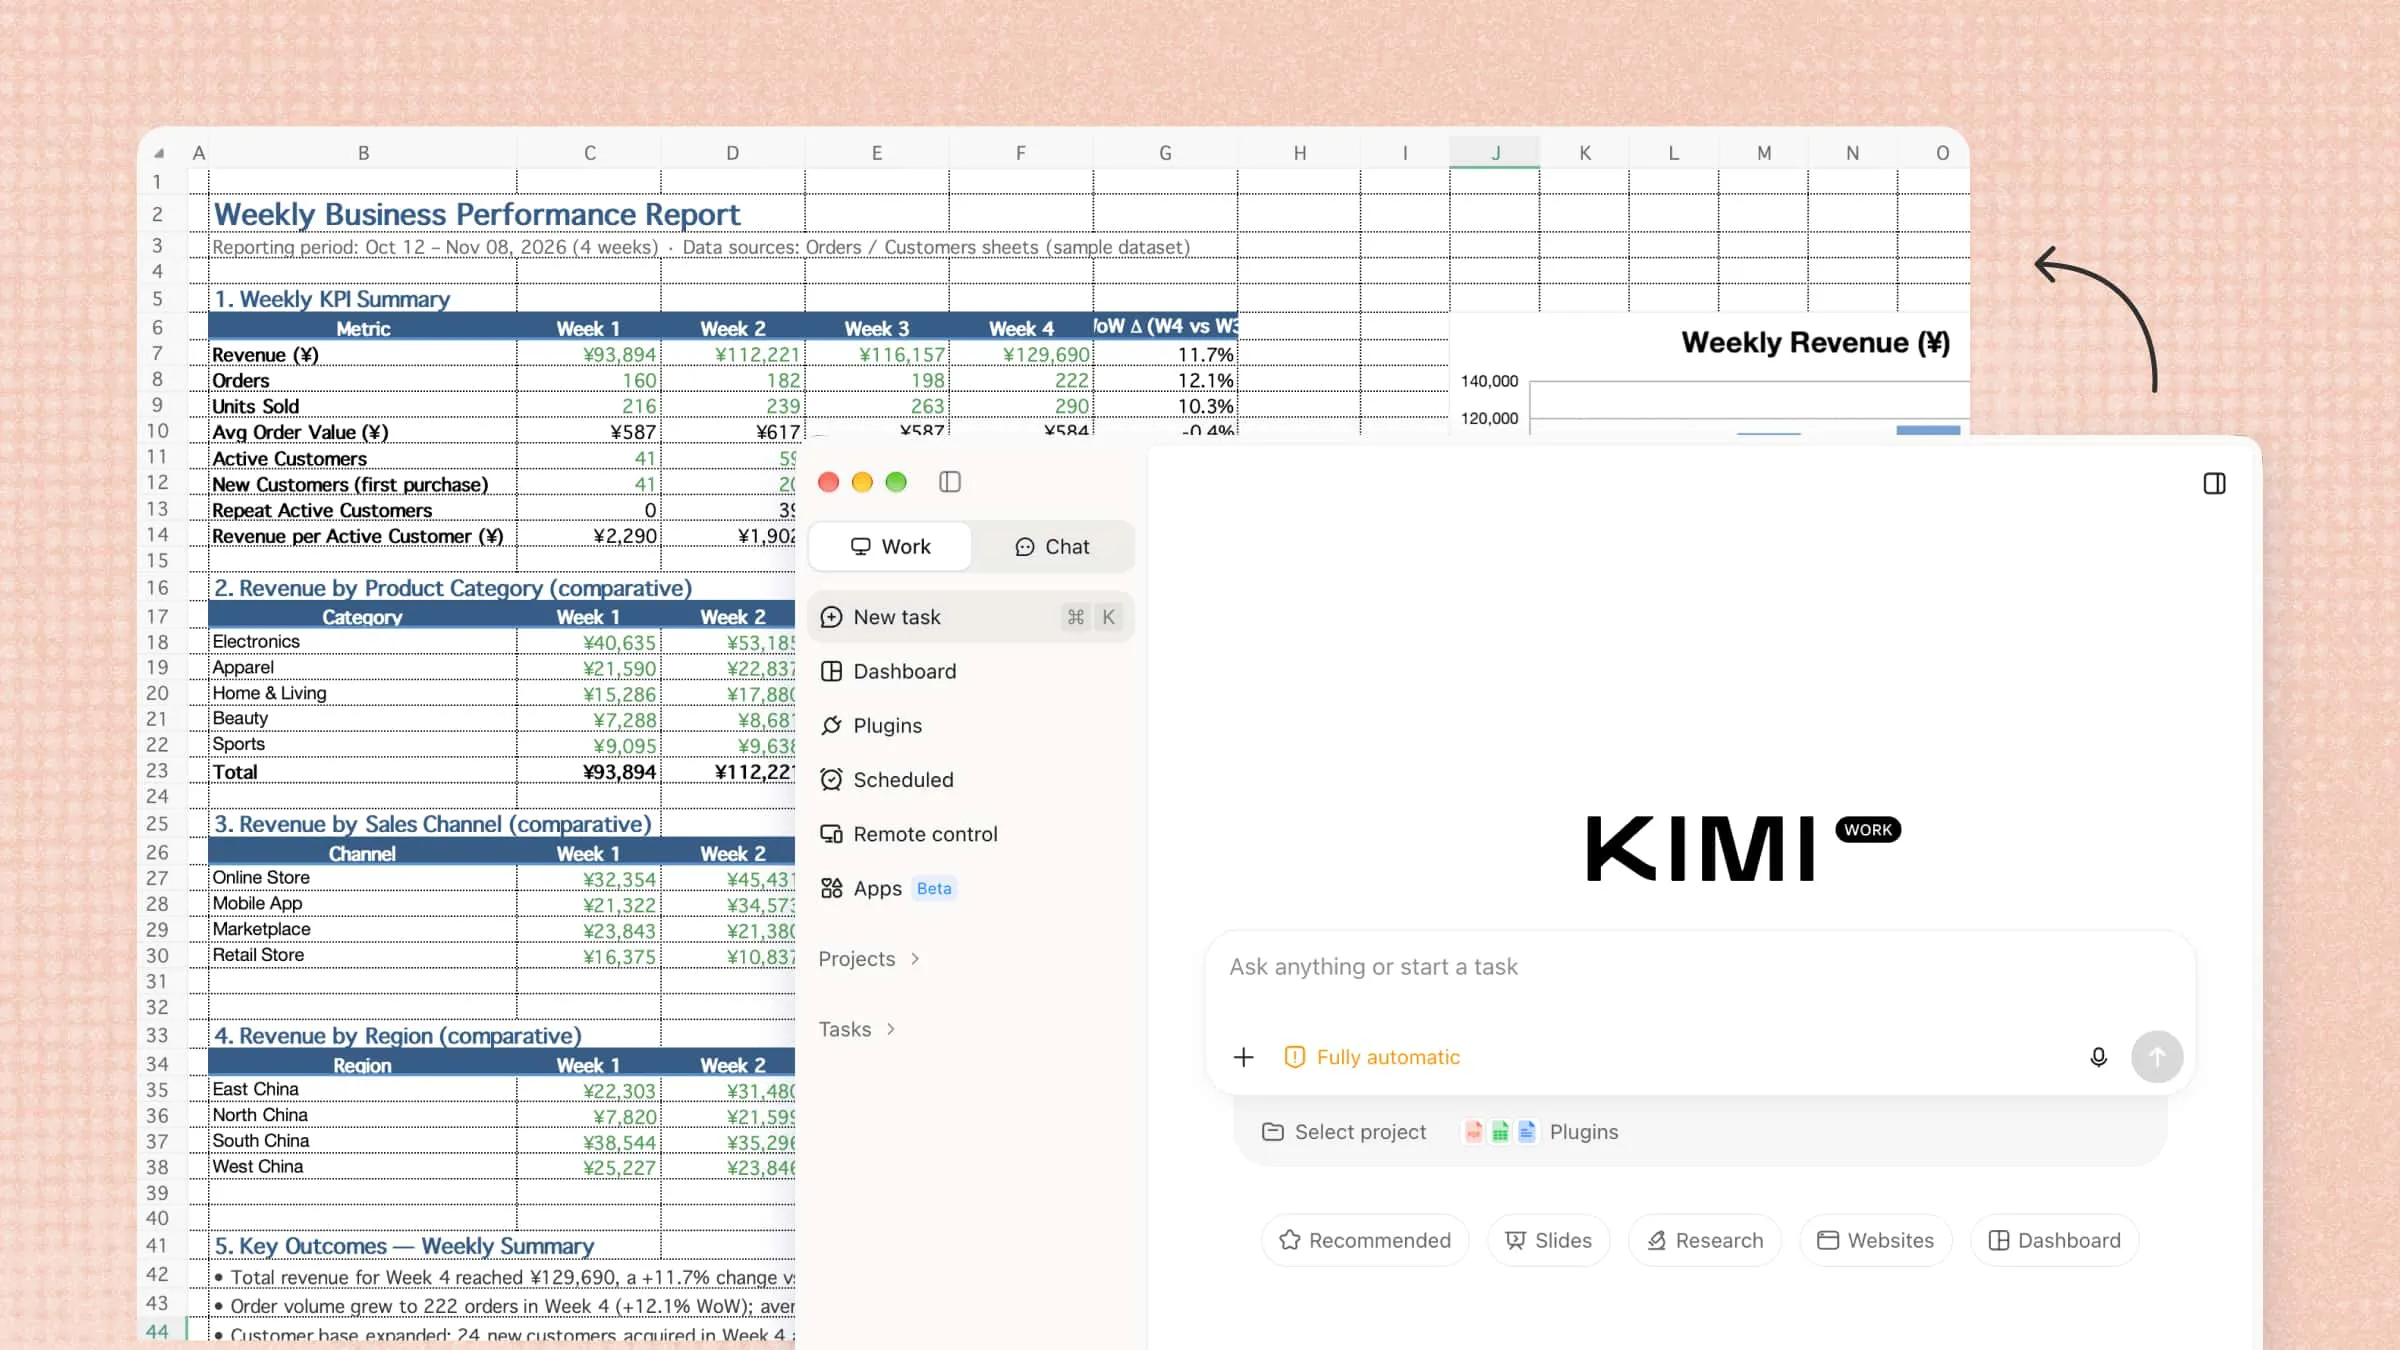
Business teams often need to review performance, monitor progress, and keep track of changing results. However, gathering information from different sources, checking figures, and preparing recurring updates can take considerable time. Without a consistent reporting process, it can also be difficult to keep information organized and ensure everyone has access to the latest results. This article explores how automated reports can reduce repetitive work, their common types and benefits, and the steps involved in creating them.
What are automated reports
Automated reports are reports created and updated automatically using data from different sources. Instead of collecting information and preparing reports manually, a system gathers the required data, organizes it, and presents it in an easy-to-understand format. These reports can run on a set schedule, such as daily, weekly, or monthly, without someone having to start the process each time. They help businesses track performance, spot changes, and make decisions using up-to-date information.
How automated reporting works
Automated report generation makes it easier to turn large amounts of data into useful information without spending hours preparing reports manually. It follows a simple process where data is collected, organized, analyzed, and shared with the people who need it. Depending on the system, reports can be created at regular intervals or whenever a specific action takes place. Let's look at how each step works.
The process begins when the system collects data from connected sources, such as websites, databases, and business tools. It then organizes and analyzes the information based on selected metrics and turns it into an easy-to-read report. Reports can be scheduled daily, weekly, or monthly, or generated when certain events occur. Once ready, they are automatically shared through emails, dashboards, or downloadable files.
Manual reporting vs. automated reporting
Manual and automated reporting differ in the time, effort, and resources they require. While manual reporting involves repetitive tasks, automated reporting handles much of the work through predefined workflows. The table below highlights their key differences.
| Comparison factor | Manual reporting | Automated reporting |
|---|---|---|
| Data collection | Manual data entry and exports | Automatic data retrieval |
| Report generation | Requires repetitive work | Uses predefined workflows |
| Accuracy | More susceptible to human error | Reduces manual errors |
| Consistency | Formatting may vary | Standardized templates |
| Report delivery | Manual sharing | Scheduled distribution |
| Scalability | Requires more resources as volume grows | Handles growing reporting needs |
Types of automated reports
Businesses use different types of reports depending on the information they need and the decisions they want to make. Some focus on daily activities, while others help track finances, marketing results, or overall performance. Here are 5 common types of automated reporting systems and how they are used.
Operational reporting
Operational reports help businesses monitor daily activities and check whether everything is running smoothly. An automated reporting system can collect data about sales, inventory, production, and team performance to create regular updates. This helps managers spot delays, track progress, and fix problems early.
Financial reporting
Financial reports provide an overview of a company's income, expenses, profits, and cash flow. With automated report generation, businesses can collect data from accounting tools and prepare regular reports without entering figures manually. This makes it easier to track budgets and understand financial performance.
Marketing reporting
Marketing reports show how well campaigns perform across different channels. They track website visits, engagement, email clicks, and conversions to help teams understand what attracts customers. Automated report writing turns these numbers into regular updates and helps identify areas that need improvement.
Business intelligence (BI) reporting
BI reports bring data from different sources together to help managers make informed decisions. Automated report writing organizes this information into charts, dashboards, and summaries that highlight important trends. Teams can use these insights to compare results and identify new opportunities.
Interactive reports
Interactive reports let users explore data through filters, charts, and clickable elements instead of reading fixed summaries. They can view specific details, compare results, and focus on the information they need. With automated report generation, these reports can stay updated as new data becomes available.
Automate recurring report generation with Kimi Work
Kimi Work uses AI agents to automate multi-step tasks, making recurring report generation easier and faster. You can provide your data, describe the report you need, and let it analyze information, organize findings, and prepare structured reports. Its scheduled tasks can also run recurring workflows at set times, reducing the need to repeat the same steps manually. This helps teams save time and keep their reports up to date.
Main features
Automate recurring report generation
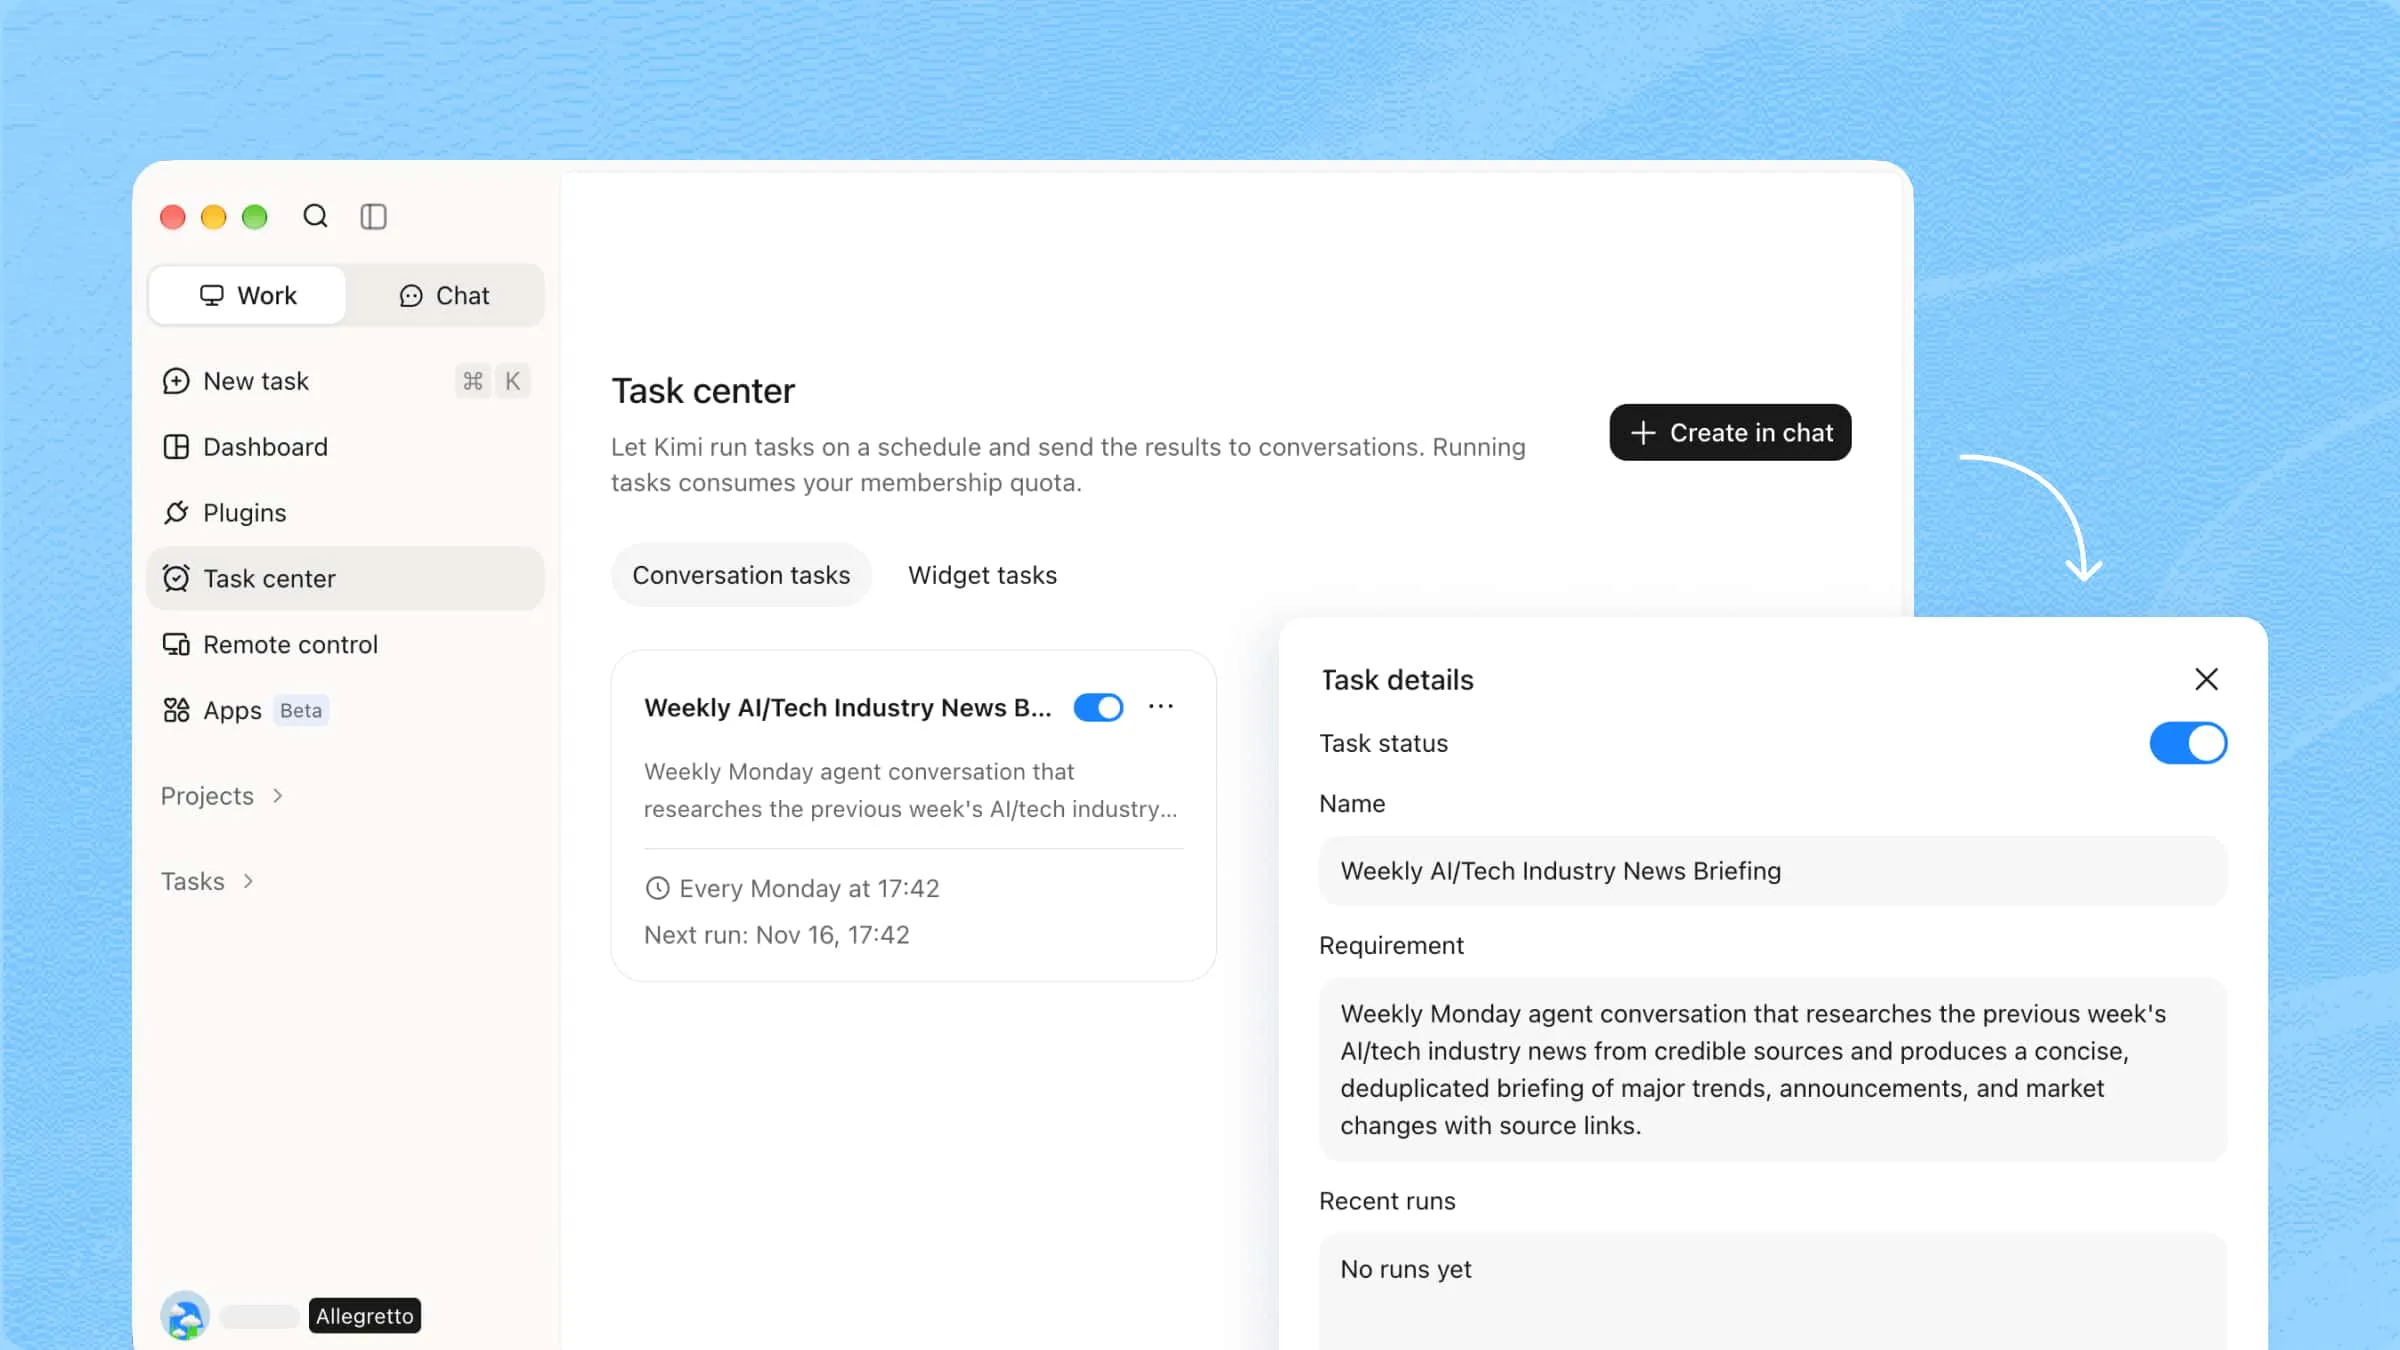
Set up daily, weekly, or monthly reporting workflows with Scheduled Tasks. Kimi Work executes predefined tasks automatically at the specified time, keeping recurring reports up to date without requiring you to restart the process manually.
Gather information from multiple sources
Connect Kimi Work to local folders and use browser automation to retrieve information from websites. It can collect relevant content from different sources, consolidate findings, and organize the information into a structured foundation for report generation.
Access connected data sources and specialized plugins
Use built-in plugins and connected data sources to retrieve information from external databases and services, including real-time data where supported. Productivity integrations can also help generate reports in team-specific formats, such as Notion and Feishu documents, while specialized plugins support industry-specific reporting requirements, such as financial reports.
Create reports in multiple formats
Transform collected information and analysis into ready-to-use deliverables, including Word documents, Excel spreadsheets, and PowerPoint presentations. Different output formats make it easier to share findings, present performance data, and communicate insights across teams.
Review and optimize reporting workflows
Check completed task results, refine prompts, and adjust reporting requirements as business needs evolve. You can also run tasks on demand to test their outputs and make improvements before setting up recurring execution.
How to automate reports with Kimi Work
Kimi Work makes it easier to automate reports by handling data collection, analysis, and report preparation through simple instructions. You can set up a workflow based on your reporting needs and schedule it to run regularly. Follow the steps below to create your first automated reporting workflow with Kimi Work.
Step 1: Open Kimi Work and access Scheduled Tasks
Go to "Scheduled Tasks" in the left navigation panel and click "Create". Choose the setup method that fits your reporting needs:
Manual mode: Configure the reporting task yourself, including instructions, execution schedule, data sources, and workflow requirements.
Chat mode: Describe the report you want to generate, and Kimi Work will create a workflow based on your instructions. Review and refine the generated configuration before enabling it.
Step 2: Let Kimi Work process and generate results
Tell Kimi Work what information to collect, how to process it, and what the final report should include. Specify the data sources, analysis requirements, reporting period, output format, and file destination.
For example, you can ask Kimi Work to:
Collect sales, marketing, or industry data from specified sources.
Summarize relevant articles, business updates, or research findings.
Analyze spreadsheet data and identify important metrics and trends.
Generate structured reports in Word, PDF, Excel, or Markdown formats.
Save completed reports to a designated folder.
The more specific your instructions, the more consistently Kimi Work can execute the reporting workflow.
Example requirement:
Step 3: Preview and export your report
After each scheduled run, check the generated reports in your workspace. Verify that the collected information, calculations, and summaries meet your requirements. If you need different results, update the task instructions, adjust the reporting schedule, or modify the output format. Kimi Work will apply the updated settings to subsequent scheduled runs.
Benefits of automated reports
Automated reports help businesses manage information, track performance, and keep teams updated without spending hours on manual tasks. They make reporting faster, more consistent, and easier to manage. Here are some key benefits of using automated reports.
Save time and reduce repetitive work
Preparing reports manually involves collecting data, checking numbers, and updating spreadsheets. Automated reporting handles these repeated tasks, giving teams more time to focus on important activities. It also makes recurring reports easier to manage.
Improve data accuracy
Manual data entry and calculations can lead to mistakes, especially when handling large amounts of information. Automated reporting reduces these errors by processing data through predefined workflows. This helps businesses create more reliable reports and make informed decisions.
Deliver timely business insights
Waiting for someone to prepare a report can delay important decisions. Automated reports provide regular updates as new information becomes available or at scheduled times. This helps managers spot changes and respond to problems or opportunities sooner.
Maintain reporting consistency
When different people prepare reports manually, their formats and calculations may vary. Automated reporting uses predefined templates and rules to keep reports consistent. This also makes it easier to compare results across teams and reporting periods.
Improve team collaboration
Automated reports make it easier to share information with team members and stakeholders. Reports can be delivered through emails, shared folders, or dashboards, giving everyone access to the same updates. This keeps teams informed and aligned.
Scale reporting processes
As a business grows, its data and reporting needs increase. Automated reporting systems can handle larger data volumes and generate multiple reports without requiring the same increase in manual effort. This makes it easier to expand reporting processes.
Strengthen data governance and compliance
Automated reporting helps businesses manage how data is collected, processed, and shared. Features such as access permissions and audit trails improve data control and accountability. Regular reports also make it easier to maintain records and support compliance requirements.
Key practices for effective automated reporting
Setting up automated reports is only the first step. To get useful results, businesses need to focus on the quality of their data, the purpose of each report, and how people use the information. The following practices can help make automated reporting more effective.
Start with clear reporting goals
Before creating a report, decide what information you want to track and why it matters. Choose relevant metrics that support your business goals and help answer specific questions. This keeps reports focused and prevents unnecessary data from getting in the way.
Prioritize data quality
Automated reports are only useful when the information behind them is accurate and complete. Check your data sources regularly, remove duplicate entries, and fix missing or incorrect values. This helps prevent misleading results and keeps reports reliable.
Use standardized report templates
Create consistent templates for recurring reports, so information follows the same structure each time. Include clear headings, relevant charts, and summary tables to make results easier to understand. Standardized formats also make it simpler to compare performance across different periods.
Customize reports for different audiences
Different people need different information to do their jobs effectively. Managers may need an overview of business performance, while individual teams may require more detailed metrics. Adjust report content and delivery to ensure everyone receives information relevant to their responsibilities.
Keep reports concise and actionable
Avoid filling reports with unnecessary numbers or details that do not support decision-making. Highlight important findings, noticeable changes, and areas that need attention. Add clear recommendations so readers can understand what action to take next.
Maintain human oversight
Automation can collect and organize information, but human review is still important. Check calculations, verify unusual results, and make sure the conclusions match the available data. Regular reviews also help identify problems and keep reporting workflows relevant as business needs change.
Conclusion
Effective reporting is about turning data into insights that support better decisions. Automated reports help businesses maintain consistent reporting processes, reduce repetitive work, and keep teams aligned with up-to-date information. With the right workflows and tools, teams can spend less time preparing reports and more time understanding what the results mean. Kimi Work brings data collection, analysis, and report generation together, making recurring reporting easier to manage.