Automation reporting tools help businesses track daily tasks, monitor progress, and manage workflows with less manual effort. From collecting data and generating reports to tracking performance and identifying areas for improvement, these tools make routine work easier and more organized. This article explores 10 popular platforms, highlighting their key features, practical benefits, and how they simplify everyday workflows.
Overview of 10 automation reporting tools
Automation reporting tools support different business needs, from combining data across multiple sources to creating visual reports and analyzing results. The following tools are compared based on their main features, functions, and practical uses to help you identify a suitable option for your work requirements.
| Tool | Primary focus | Standout capabilities | Ideal users |
|---|---|---|---|
| Kimi Work | Business productivity and automated reporting | Web research, data analysis, report creation, document generation, scheduled tasks, interactive dashboards | Businesses and teams managing research, data, and reporting tasks |
| Domo | Business intelligence and data integration | Real-time data visualization, interactive dashboards, automated reporting, data connectors, AI-powered insights | Businesses monitoring performance across multiple data sources |
| Looker Studio | Data visualization and report creation | Customizable dashboards, interactive reports, data blending, Google product integration, report sharing | Marketers and analysts creating reports from different data sources |
| Tableau | Business intelligence and visual analytics | Interactive dashboards, data exploration, predictive analytics, automated insights, data storytelling | Organizations analyzing complex data and tracking business performance |
| Qlik Sense | Data analytics and business intelligence | Associative data exploration, interactive dashboards, automated reporting, AI-powered insights, predictive analytics | Businesses exploring large datasets and identifying trends |
| Supermetrics | Marketing data integration and reporting | Automated data collection, marketing dashboards, scheduled reports, data transfers, platform integrations | Marketing teams tracking campaign performance across multiple channels |
| Adverity | Marketing data management and analytics | Automated data integration, data transformation, reporting workflows, data quality management, performance insights | Agencies and enterprises managing marketing data from multiple platforms |
| LeadJourney | Lead tracking and marketing performance reporting | Lead source tracking, campaign analytics, conversion monitoring, automated reporting, performance dashboards | Marketing and sales teams monitoring leads and campaign results |
| Cube | Financial planning and reporting | Automated financial reporting, spreadsheet integration, budgeting, forecasting, real-time data consolidation | Finance teams managing budgets, financial reports, and business planning |
| Telerik Reporting | Report design and business reporting | Interactive reports, report scheduling, data visualization, customizable templates, multiple export formats | Developers and businesses creating embedded reports for applications |
Explore 10 efficient automation reporting tools
Choosing automation reporting tools can help businesses save time, reduce manual work, and manage information effectively. With different options available, teams can find solutions that suit their reporting needs and business goals. Here are 10 tools worth exploring to simplify daily tasks and improve workflow efficiency.
Kimi Work
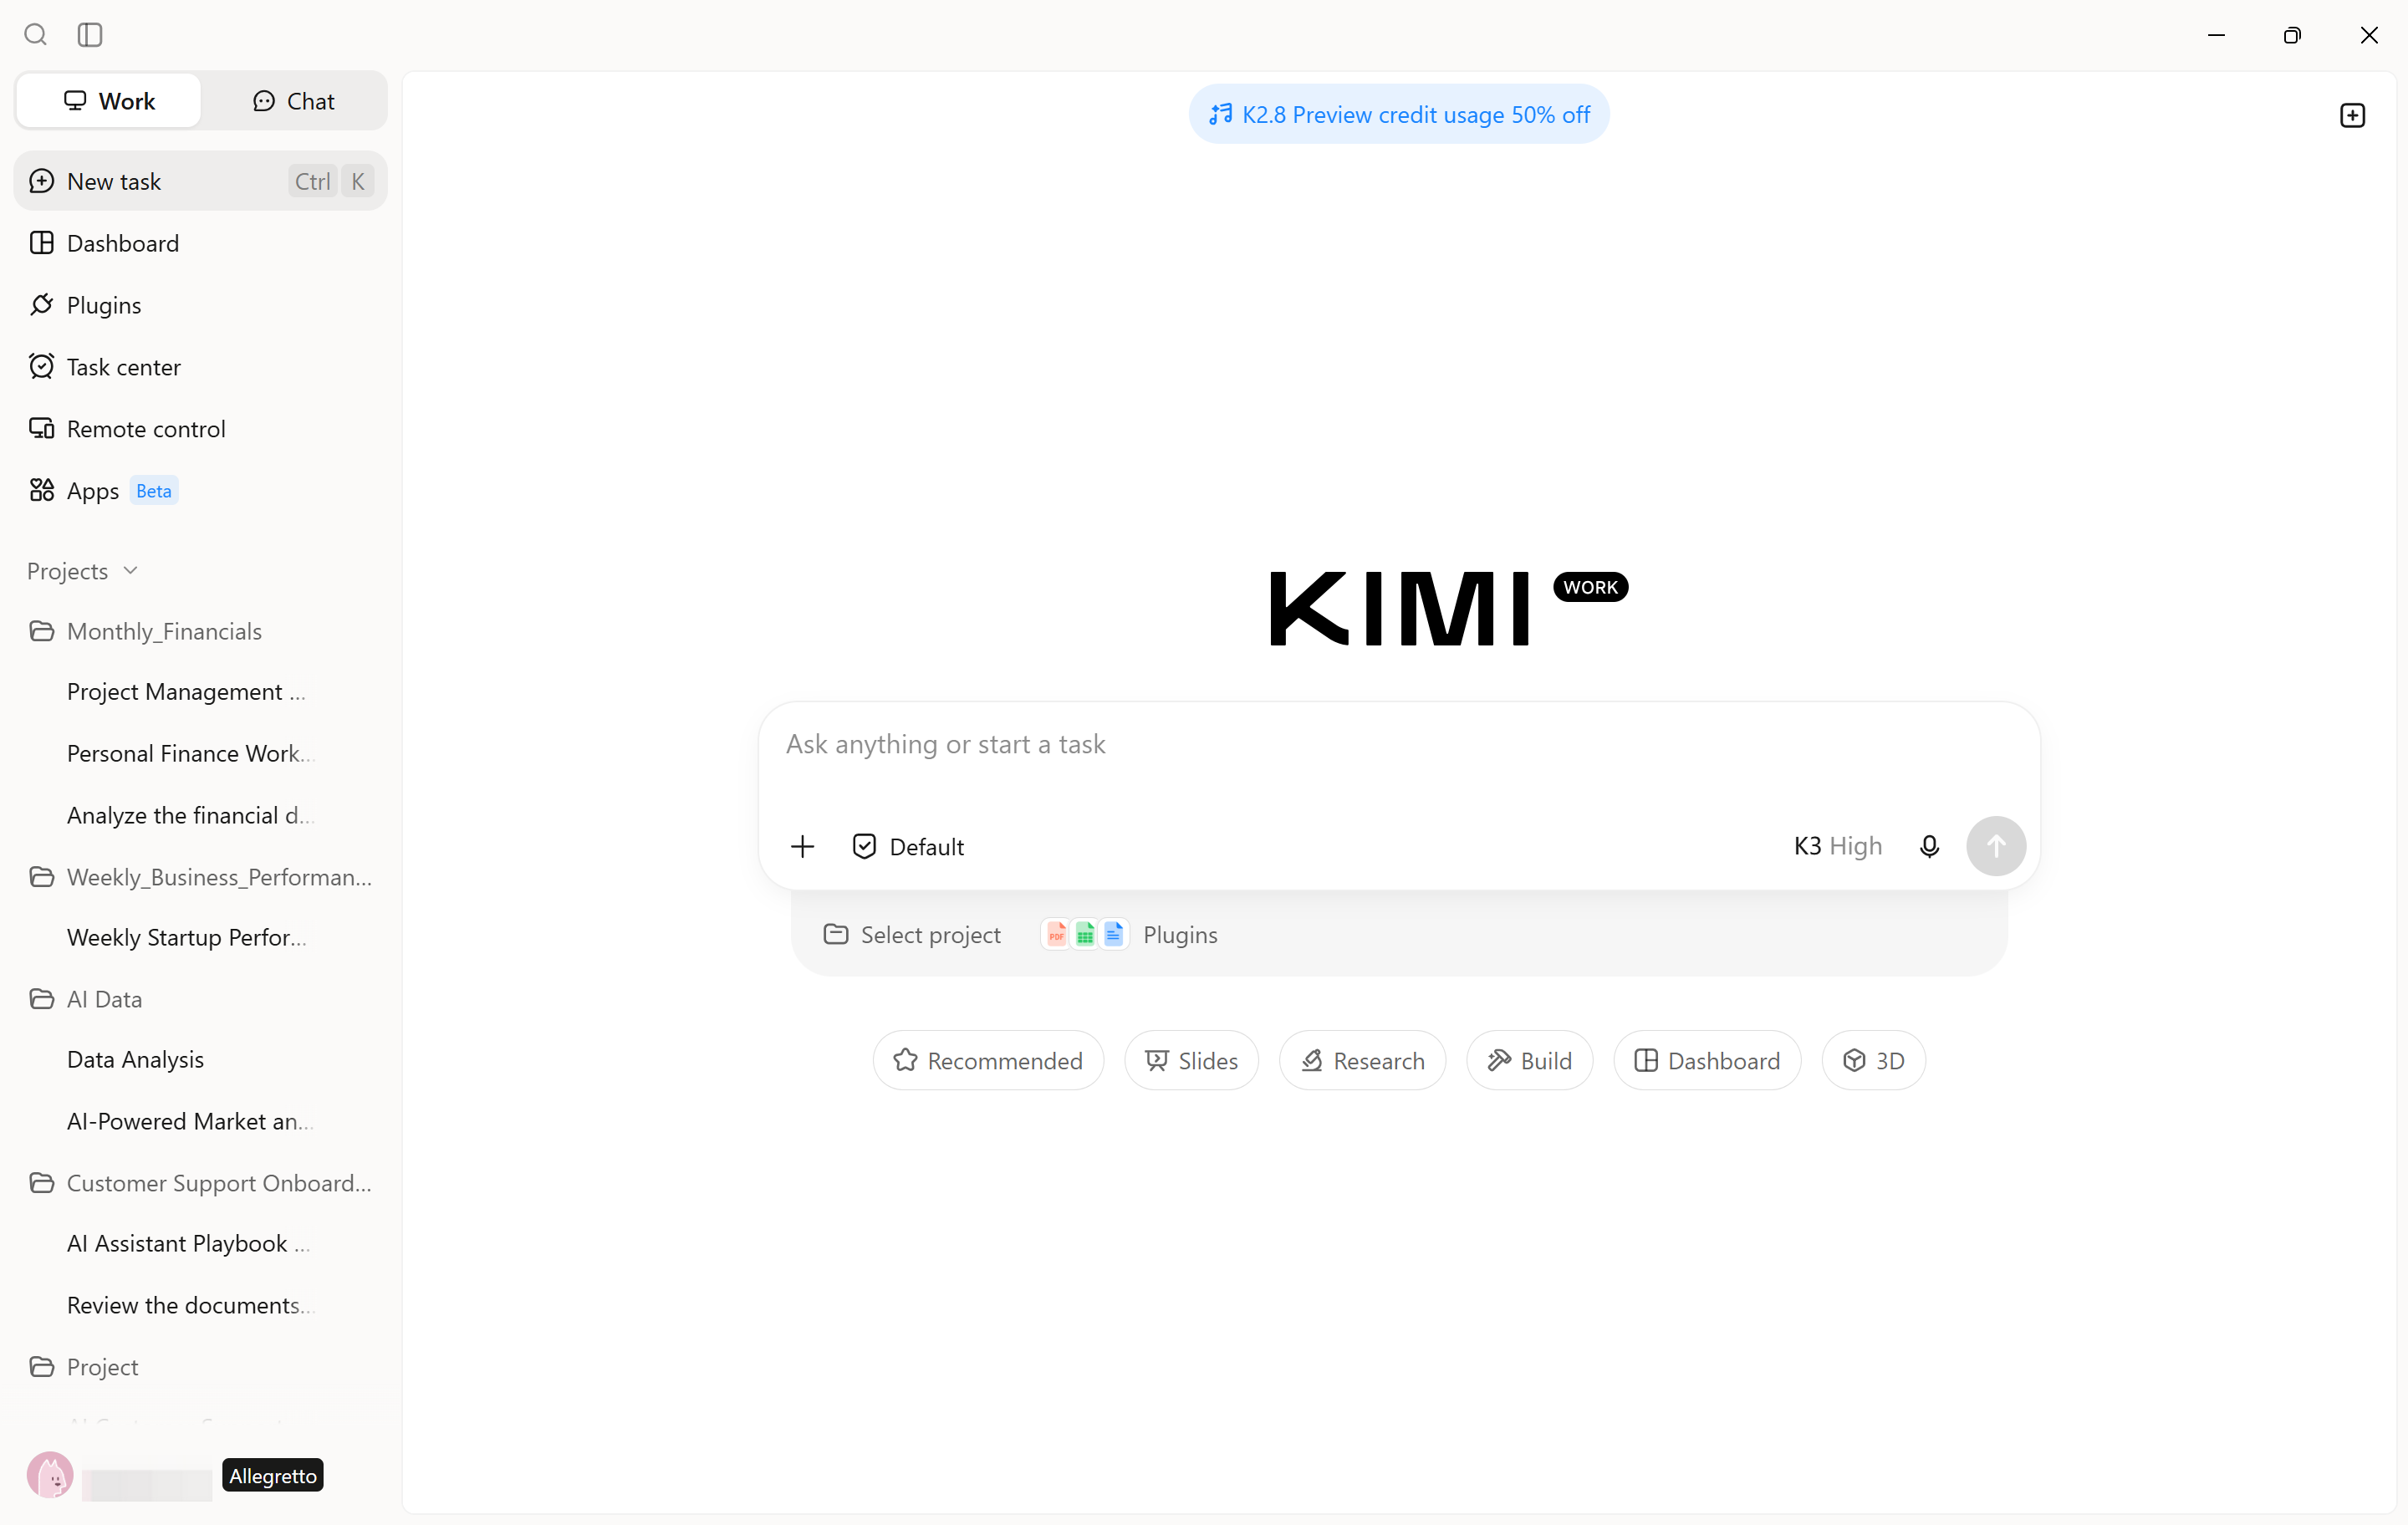
For businesses looking to simplify reporting tasks, automation reporting tools provide practical ways to manage data and organize information. Kimi Work is an AI-powered tool that helps businesses manage information and complete reporting tasks efficiently. It can assist with researching data, analyzing information, creating documents, and preparing reports. Its features help organize work, reduce repetitive tasks, and support business operations.
Main features
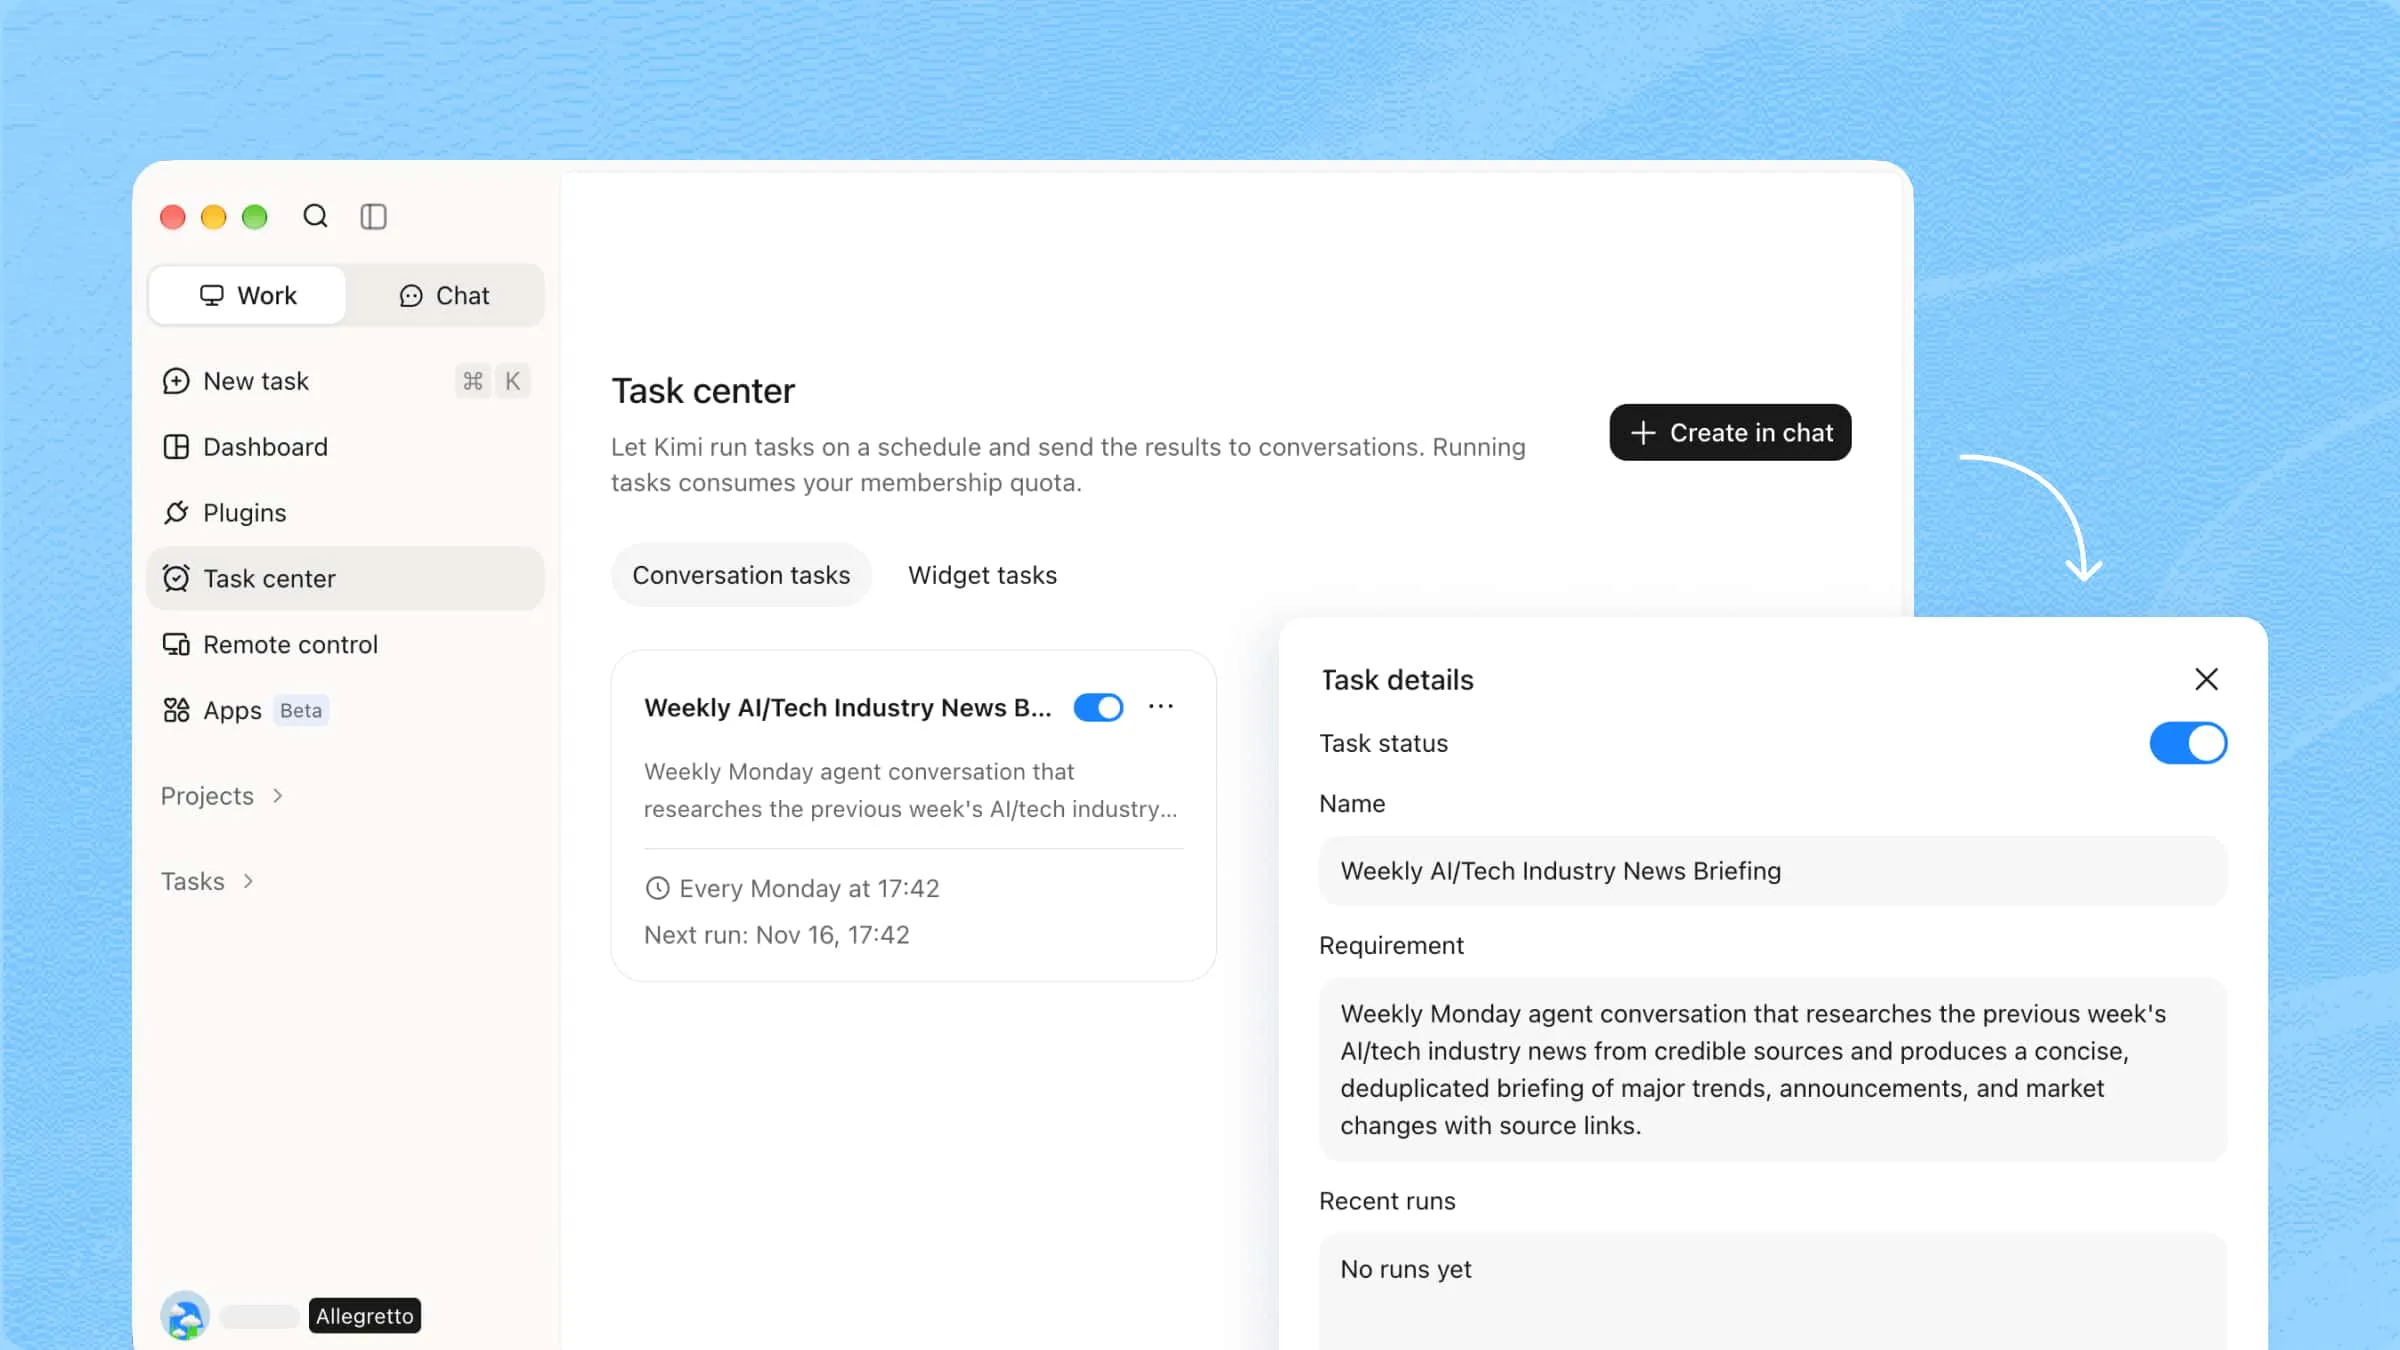
Automate recurring tasks with Scheduled Tasks: Set up daily, weekly, or monthly tasks with Scheduled Tasks. Kimi Work Agent can execute predefined workflows at specified times, such as collecting updates, analyzing data, and preparing regular reports, reducing repetitive manual work.
Collect and organize information across sources: Use browser automation to retrieve information from websites and access files in local folders. Kimi Work can gather relevant content, extract key details, and consolidate information from multiple sources to support research, analysis, and other knowledge-intensive tasks.
Extend capabilities with integrations and custom plugins: Connect Kimi Work Agent to external services, supported data sources, and productivity platforms such as Notion and Lark. You can also create custom plugins tailored to your specific workflows and business requirements, adding specialized capabilities for tasks such as financial data analysis, reporting, and working with internal business systems.
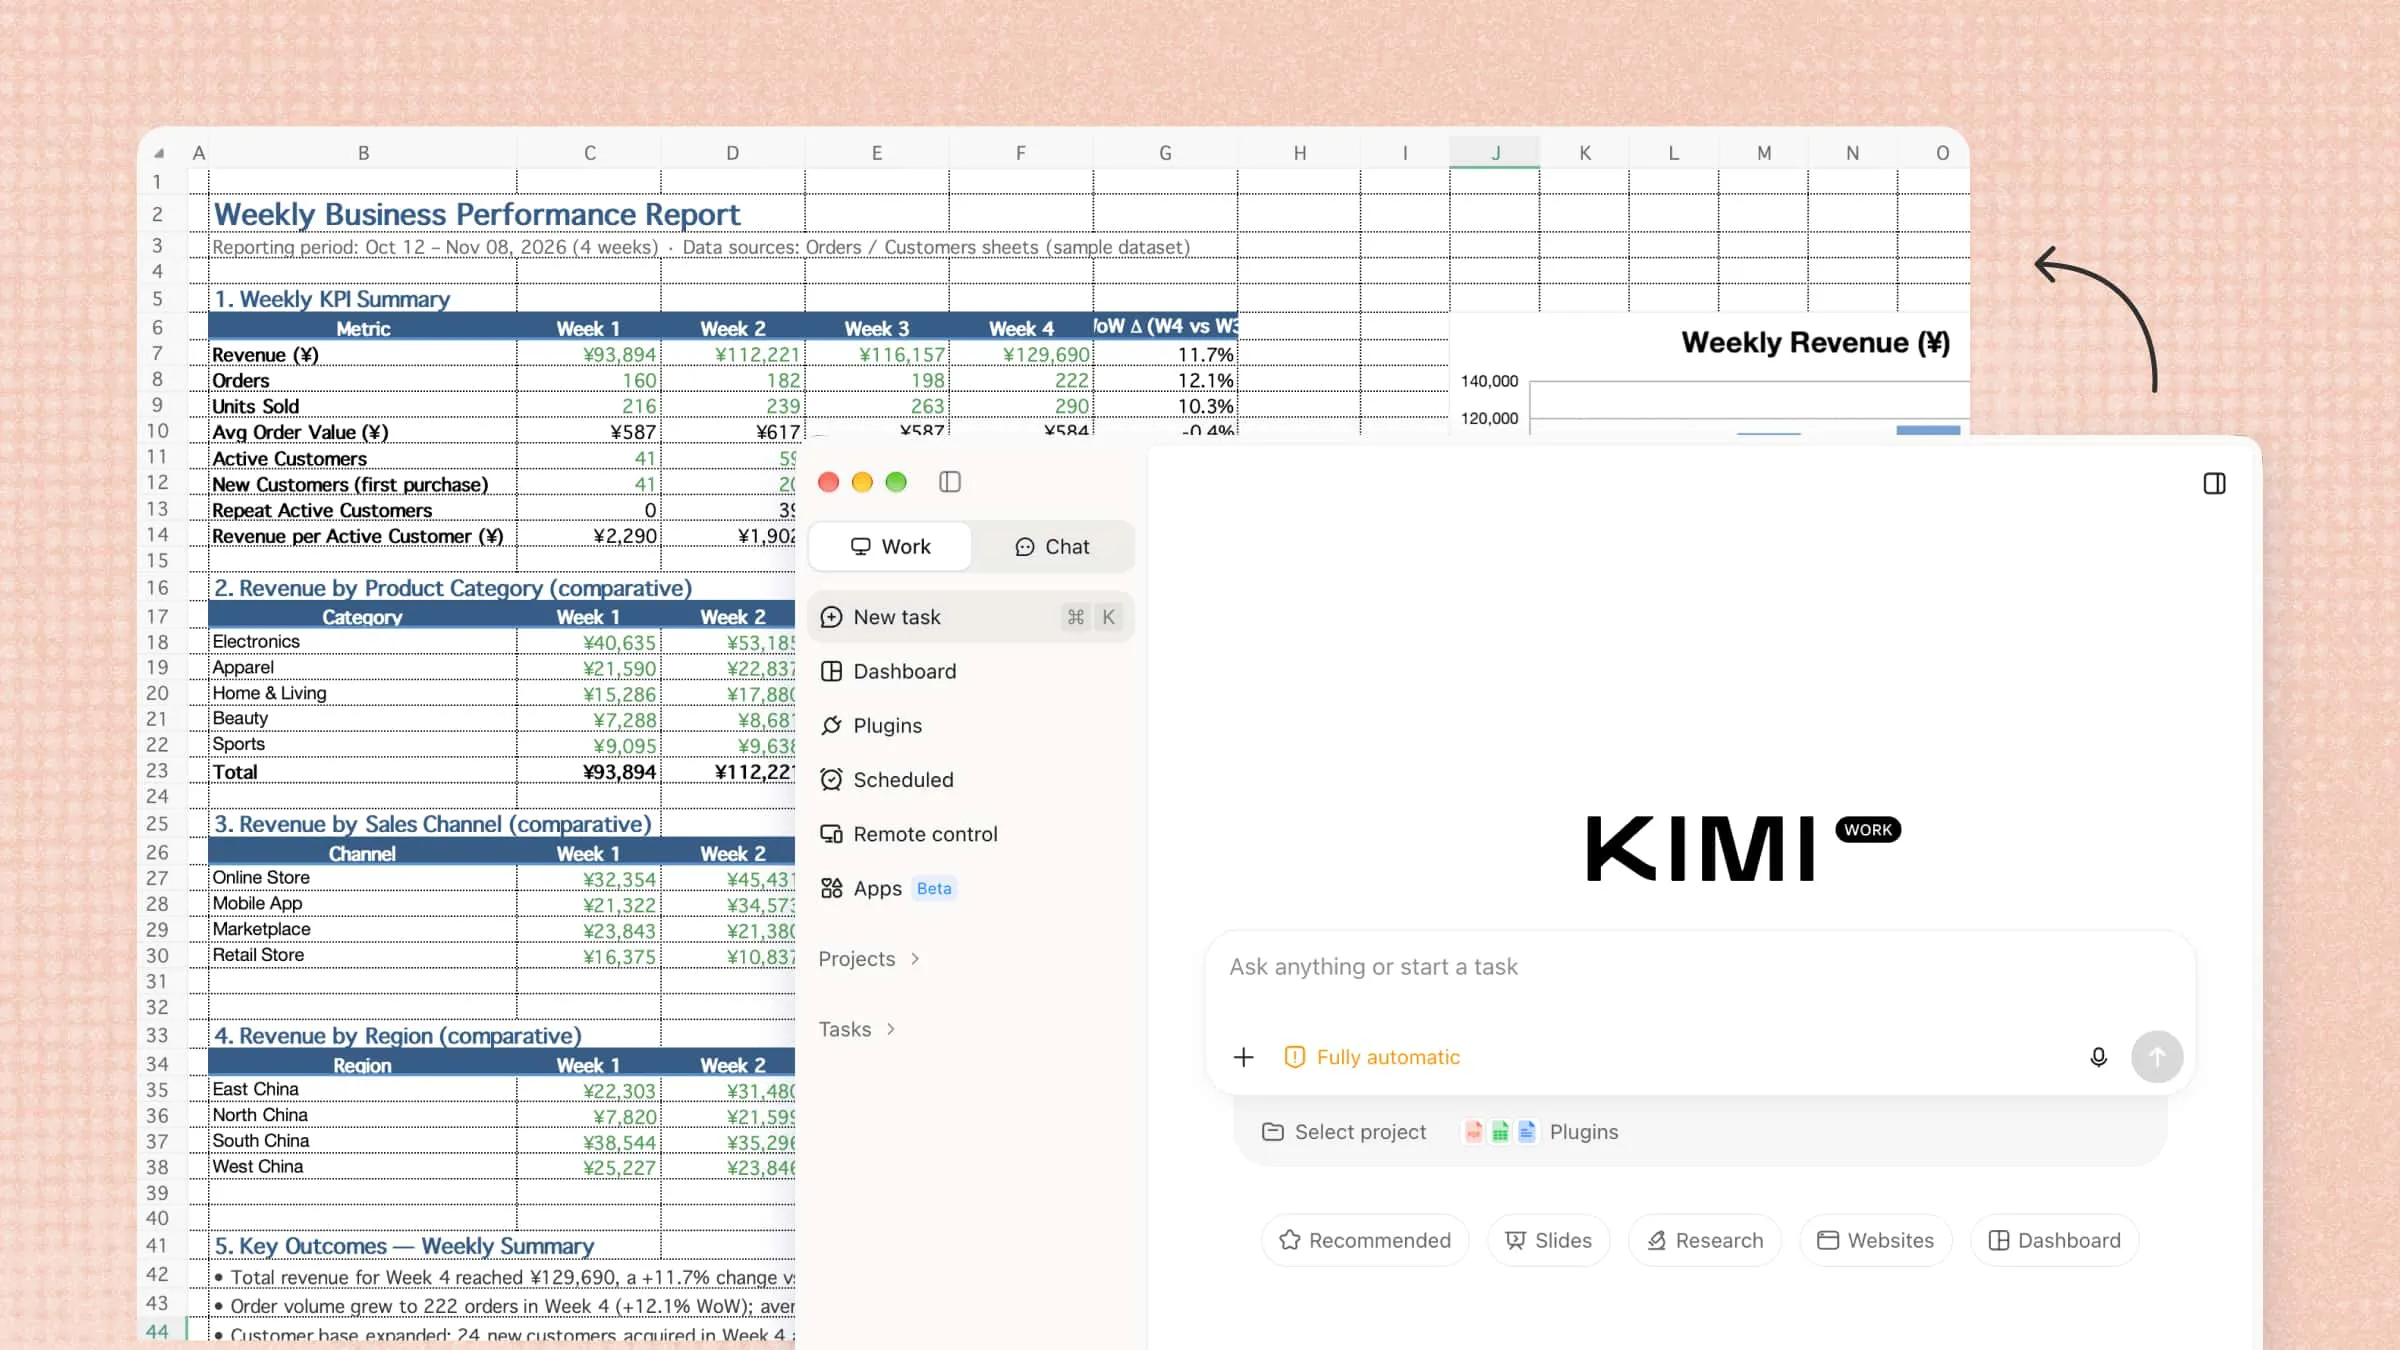
Turn completed tasks into practical deliverables: Go beyond generating text responses by producing structured outputs in formats such as Word documents, Excel spreadsheets, and PowerPoint presentations. Kimi Work Agent can also help create reports, analyze business data, and organize findings into deliverables that are ready for further editing and sharing.
Build dynamic dashboards with natural language: Create business dashboards simply by describing the metrics, data, and visualizations you need. Kimi Work can also connect dashboards to your team's own data sources, turning them into live dashboards that update dynamically as new data becomes available. This makes it easier to monitor key performance indicators, track business trends, and keep teams aligned with up-to-date information.
Suitable for
Automating data collection and report generation
Tracking business performance and key metrics
Creating dashboards and visual reports
Monitoring workflows and analyzing results
How to automate reports with Kimi Work
Kimi Work can help simplify report preparation by gathering information, analyzing data, and organizing results in a clear format. Its AI-powered features make it easier to handle reporting tasks and reduce manual work. Follow the steps below to create reports more efficiently with Kimi Work.
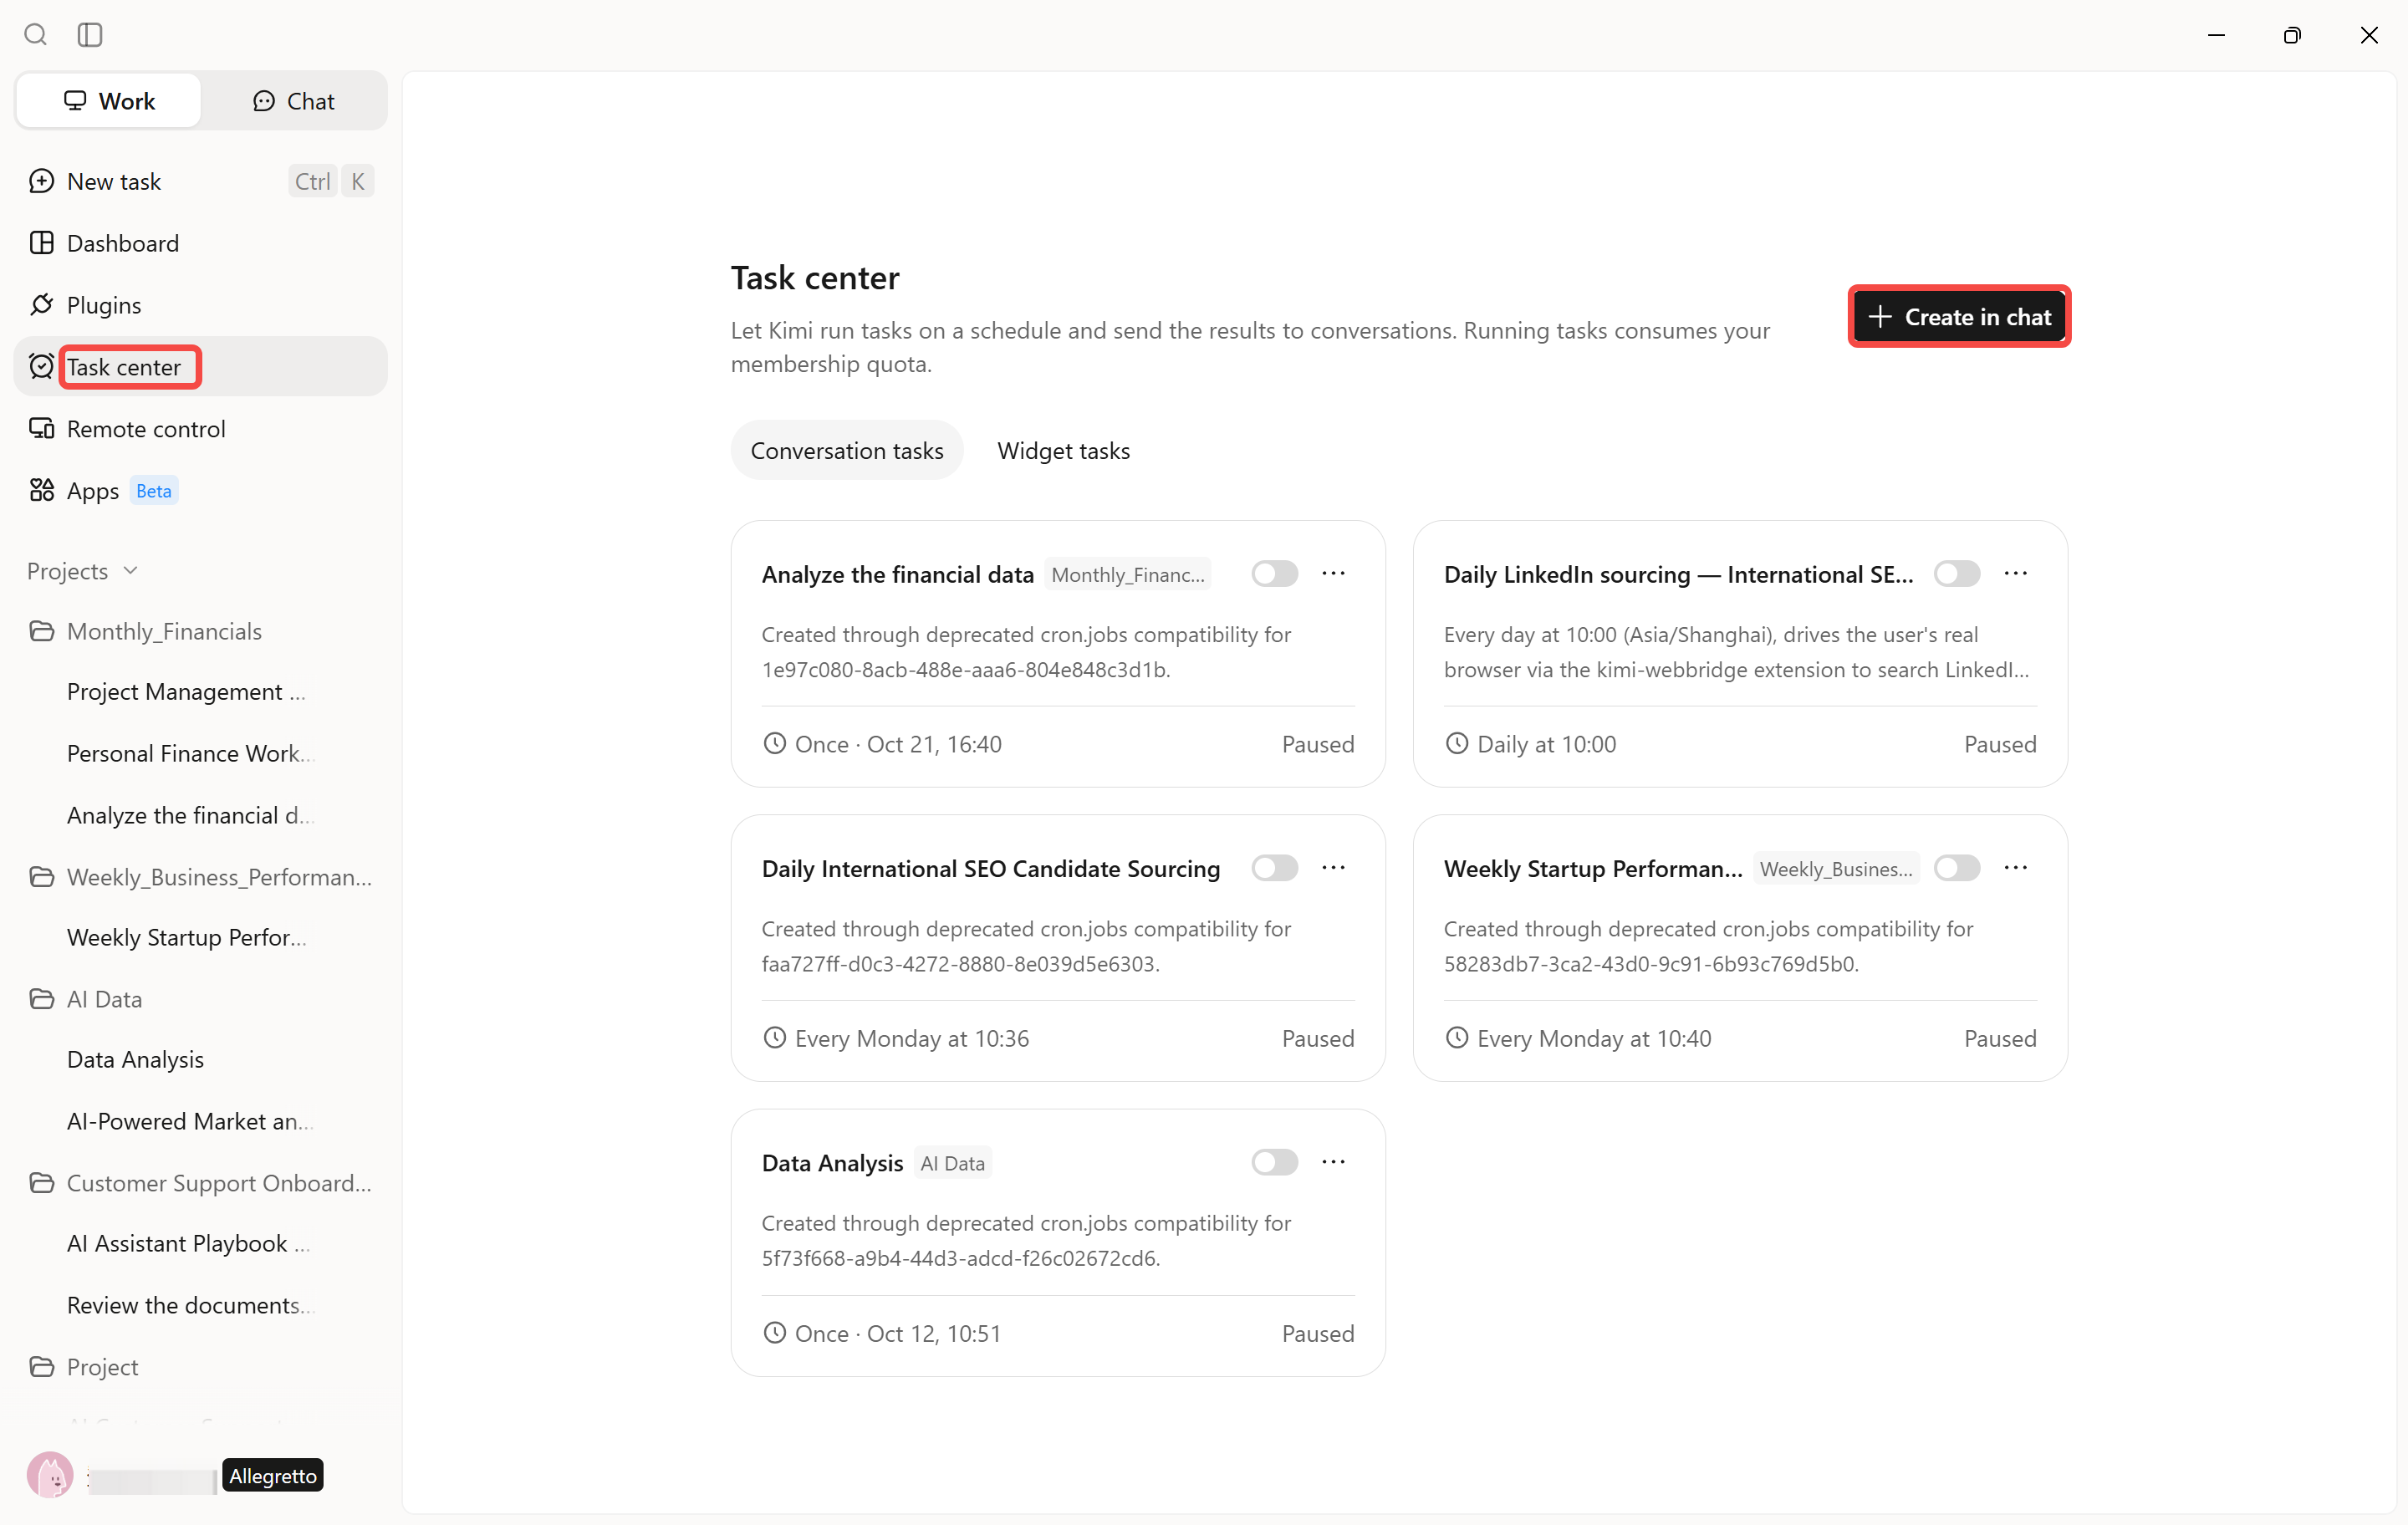
Step 1: Open Kimi Work and access Scheduled Tasks
Open Kimi Work and select "Task center" from the left navigation panel. Click "Create in chat" and describe the report you need, and Kimi Work will create a workflow based on your instructions. Review and adjust the settings before enabling it.
Step 2: Let Kimi Work process and generate results
Provide Kimi Work with what information to collect, how to analyze it, and what the final report should contain. Include the data sources, reporting period, analysis requirements, output format, and file destination.
Example requirement:
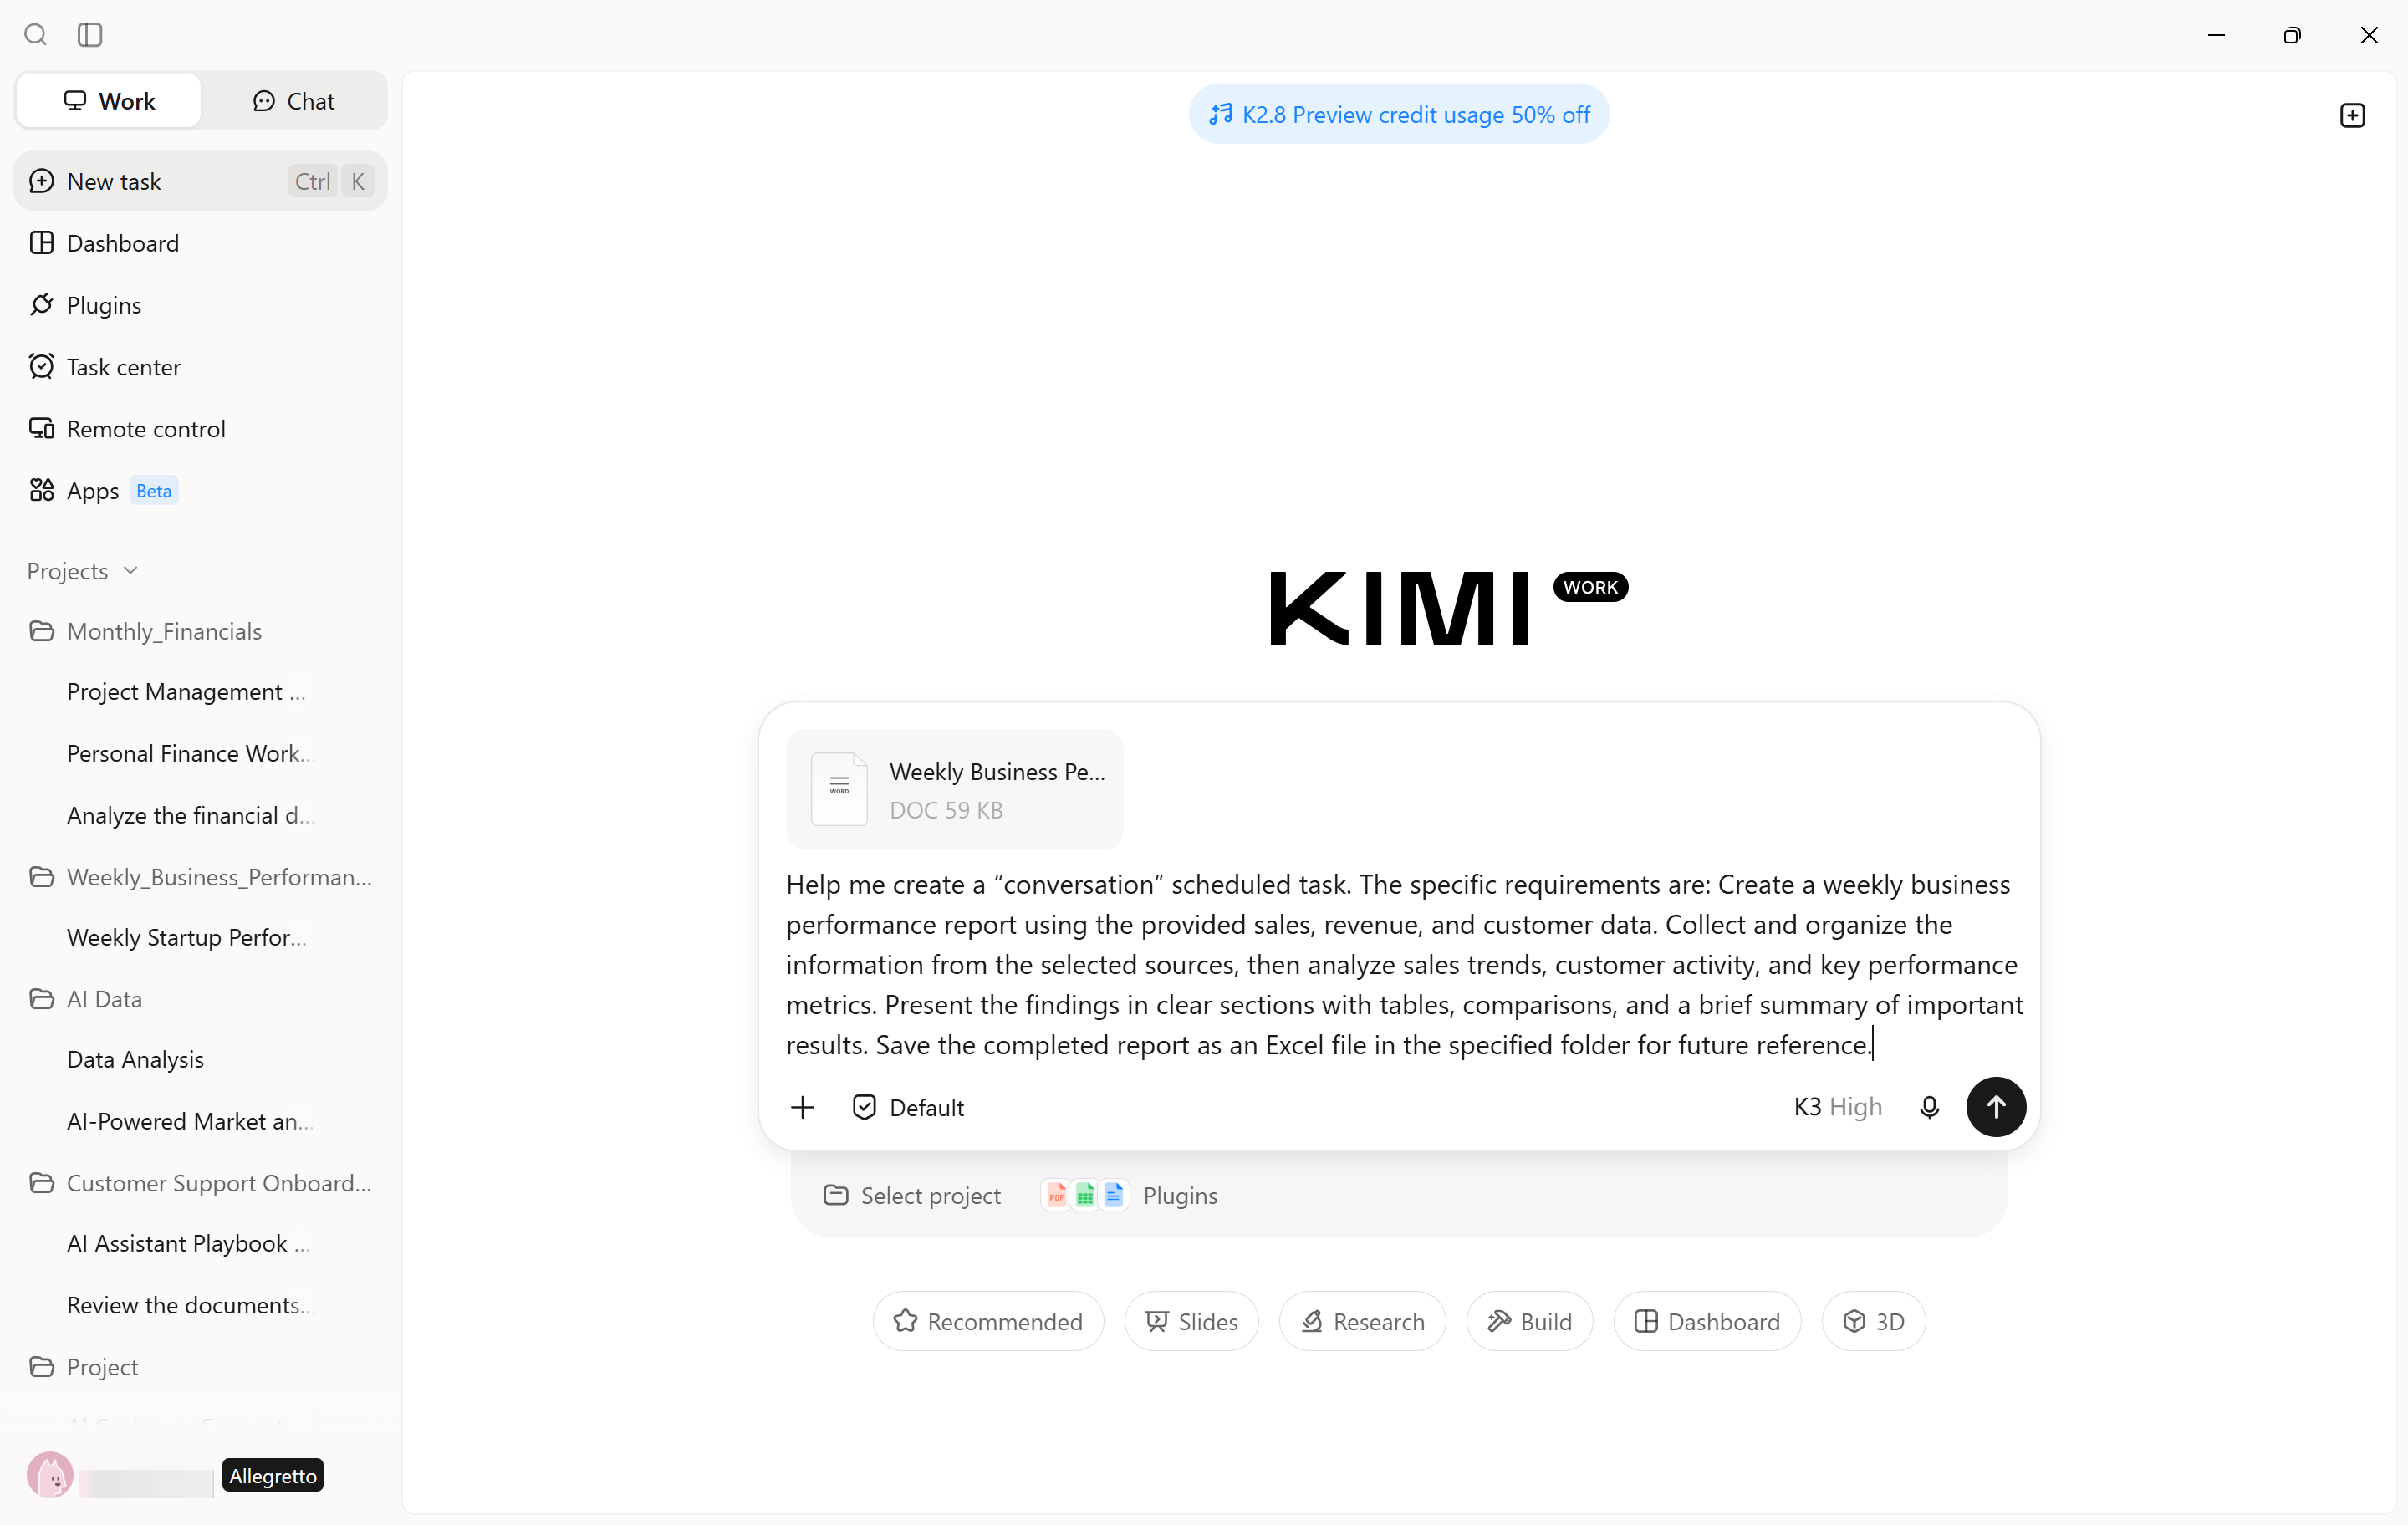
Step 3: Preview and export your report
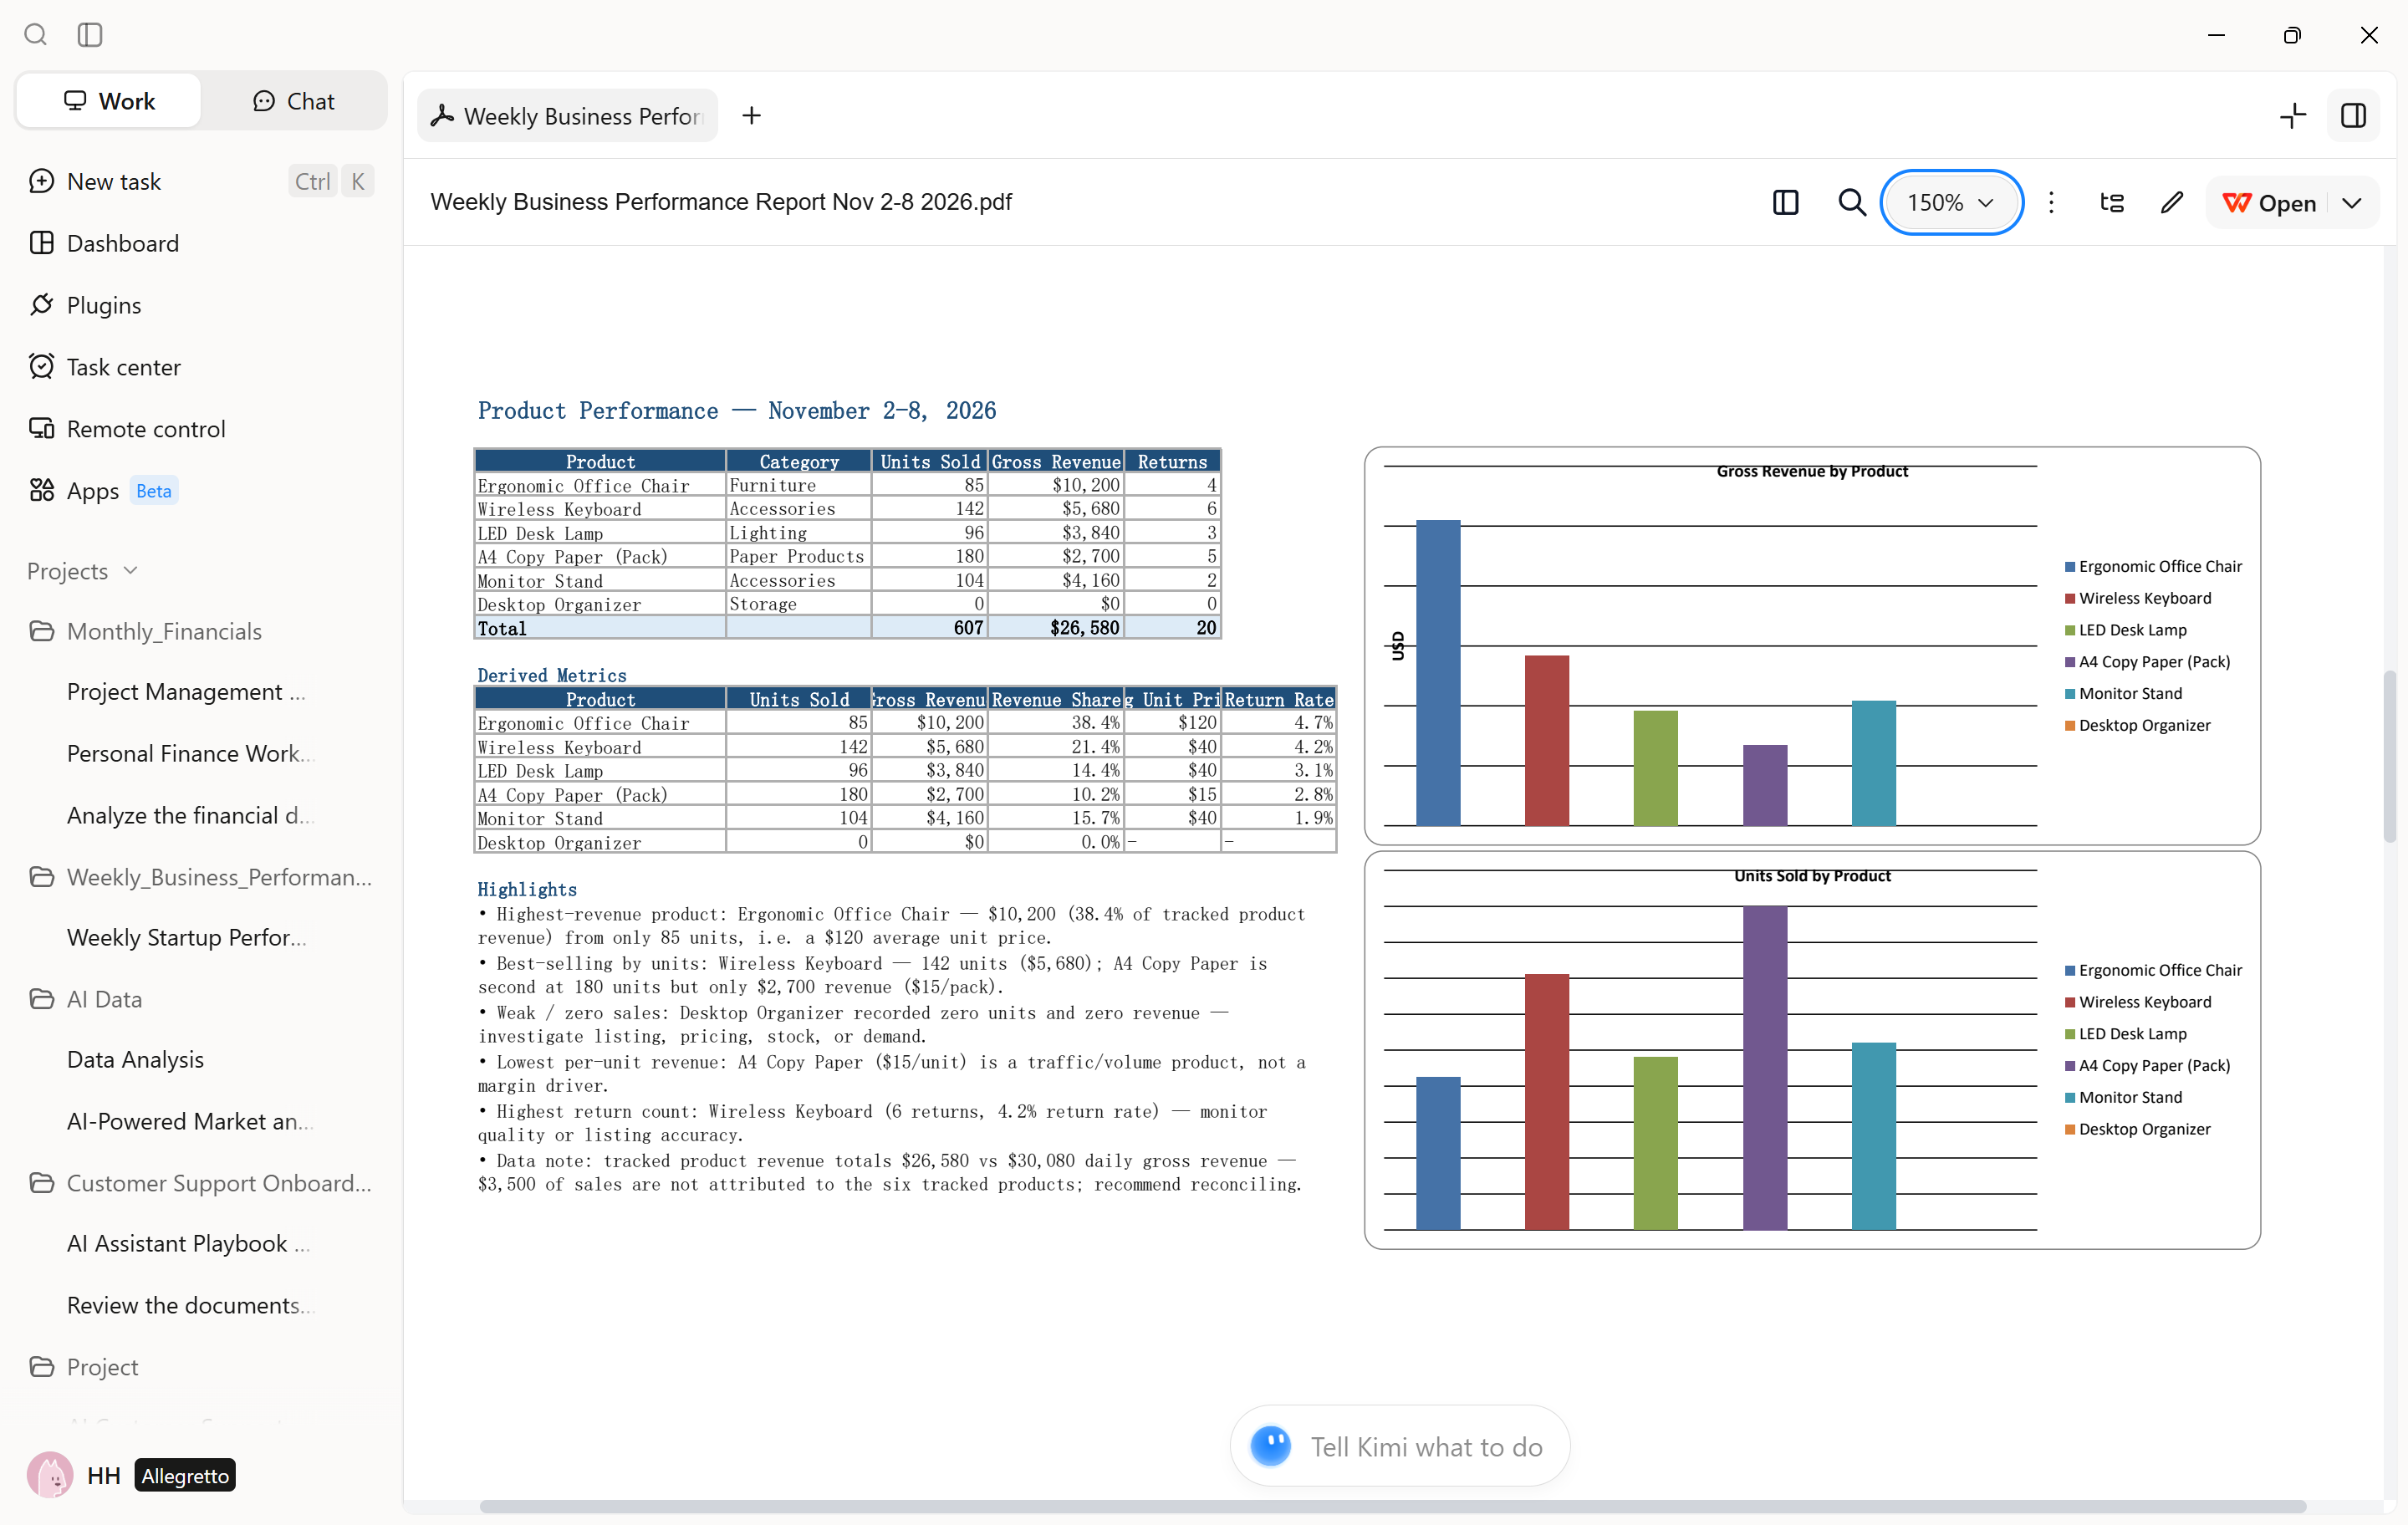
After each scheduled run, open the generated report in your workspace and check the collected data, calculations, and summaries. Make sure the results match your requirements. If changes are needed, update the task instructions, adjust the schedule, or modify the output format. Kimi Work will use the revised settings for future scheduled reports.
Domo
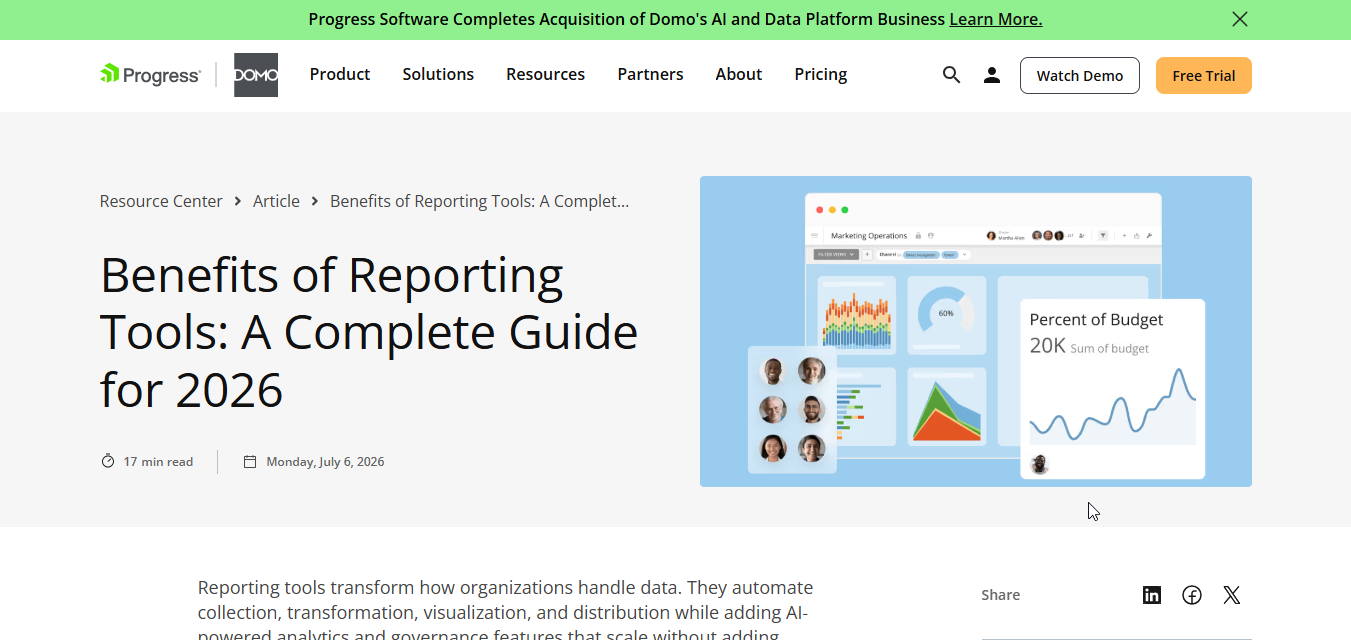
Domo is a cloud-based business intelligence platform that helps businesses collect, manage, and analyze data in one place. It connects information from different sources and turns it into interactive dashboards and reports. Its automation features support data preparation, real-time monitoring, and workflow management. This makes it useful for teams looking to reduce manual reporting and make informed business decisions.
Main features
Extensive Data Connectivity: Connects data from CRMs, ERPs, cloud platforms, marketing tools, and spreadsheets through prebuilt connectors.
Automated Data Preparation: Uses Magic ETL to clean, combine, and organize information without requiring advanced coding skills.
Interactive Dashboards and Reports: Creates visual dashboards and customizable reports that update automatically as new data becomes available.
Automated Alerts and Workflows: Sends notifications when business metrics reach specific limits and automates routine tasks through Domo Workflows.
Suitable for
Combining data from multiple business sources in one place
Creating automated reports and interactive dashboards
Monitoring business performance through real-time metrics
Automating routine tasks and receiving important data alerts
Looker Studio
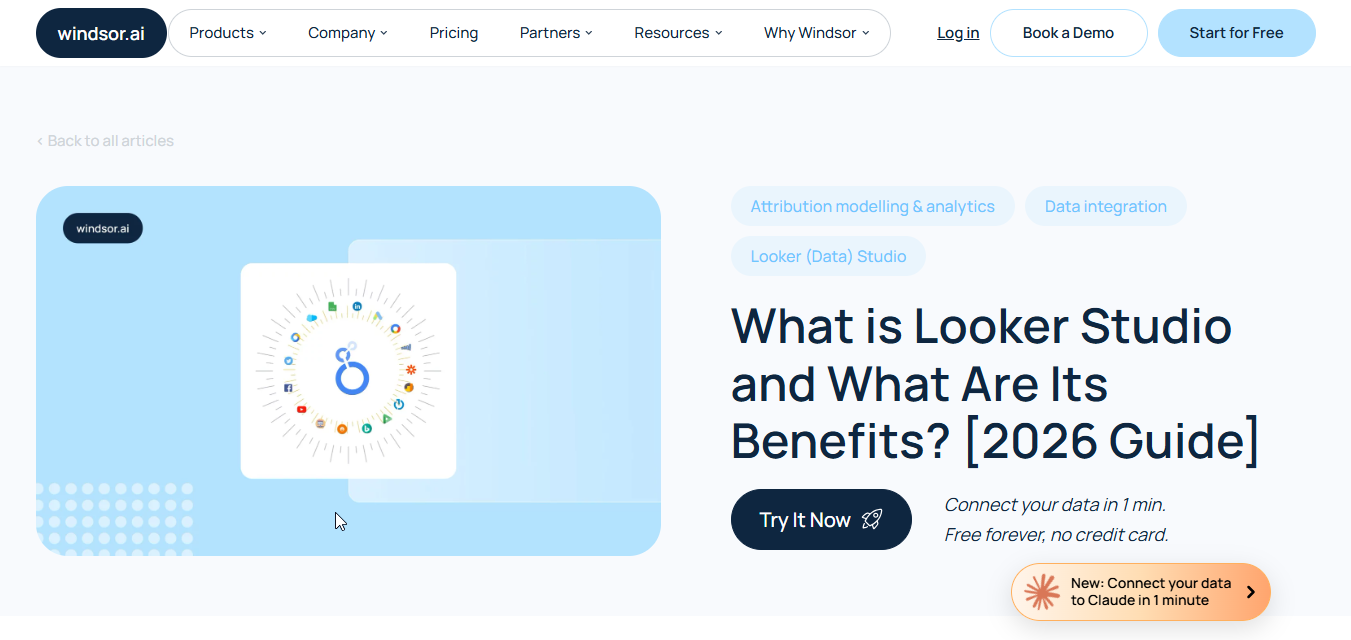
Looker Studio, developed by Google, is an automated reporting tool for creating reports and visualizing business data. Users can combine information from multiple sources and present findings through interactive dashboards without coding. Features such as automatic updates, custom charts, and scheduled sharing simplify reporting. Businesses and teams can review performance and communicate results clearly.
Main features
Multiple Data Connections: Links with Google Analytics 4, Google Ads, Google Sheets, BigQuery, and other platforms to bring business information into one report.
Automated Report Delivery: Supports scheduled email delivery of reports in PDF format, helping teams share updated information without preparing files manually.
Interactive Dashboards: Supports filters, date controls, and drill-down options that enable users to explore specific metrics and compare results.
Drag-and-Drop Report Design: Provides customizable charts, tables, scorecards, layouts, and branding options to create reports that match business needs.
Suitable for
Tracking advertising campaigns, website traffic, and SEO performance
Creating professional reports and dashboards for business needs
Monitoring key performance indicators and sharing regular updates
Designing visual reports without advanced coding or SQL knowledge
Tableau
Tableau is a business intelligence (BI) platform that helps businesses analyze data and create interactive dashboards and reports. Its automation features simplify data preparation, scheduled updates, and report distribution. The platform connects multiple data sources, helping teams track performance and make informed decisions. Tableau supports automated reporting through Tableau Server and Tableau Cloud.
Main features
Automated Data Refreshes: Schedules data updates through Tableau Server and Tableau Cloud to keep dashboards synchronized with source databases.
Automated Data Preparation: Uses Prep Conductor to clean, combine, and transform data from multiple sources through scheduled workflows.
Subscriptions and Alerts: Sends automated email reports, notifications, and data-driven alerts when specific conditions or performance thresholds are met.
Automated Report Distribution: Supports scheduled report sharing and exports in PDF, Excel, and image formats, with personalized views for different recipients.
Suitable for
Analyzing business data and monitoring performance
Automating data preparation and scheduled report updates
Creating interactive dashboards and visual reports
Distributing customized reports across teams and departments
Qlik Sense
Qlik Sense helps businesses turn complex data into clear visual insights through its business intelligence (BI) capabilities. Through its Associative Engine, users can explore connections across multiple sources and identify hidden patterns. Automated workflows simplify report creation, data updates, and information sharing. Integration with Qlik Application Automation and Qlik Reporting Service further simplifies reporting tasks.
Main features
Associative Data Engine: Connects data from different sources and helps users explore relationships between selected, related, and excluded information.
Automated Report Generation: Creates structured reports using data, charts, and visualizations from Qlik Sense apps in formats such as PDF, PowerPoint, and Excel.
No-Code Workflow Automation: Uses drag-and-drop connectors in Qlik Application Automation to build scheduled workflows and automate report distribution.
Report Subscriptions and Distribution: Delivers customized reports and relevant data to selected users, stakeholders, and distribution lists.
Suitable for
Automating operational summaries and executive reporting
Generating Excel-based financial and analytical reports
Replacing manual tasks with scheduled reporting workflows
Sharing customized dashboards across distributed business teams
Supermetrics
Supermetrics is a marketing data integration platform that helps businesses collect information from multiple sources. It transfers marketing and sales data into spreadsheets, dashboards, and data warehouses for analysis. Automated pipelines reduce manual work and keep reports updated regularly. The platform also supports data transformation and blending for cross-channel performance reporting.
Main features
Multi-Source Data Integration: Connects marketing, advertising, analytics, and CRM platforms, including Google Ads, Meta Ads, LinkedIn Ads, HubSpot, and Shopify.
Flexible Data Destinations: Transfers organized data to Google Sheets, Excel, Looker Studio, Power BI, and data warehouses such as BigQuery and Snowflake.
Automated Data Refreshes: Schedules hourly, daily, weekly, or monthly updates to keep marketing metrics and reports current.
Data Transformation and Blending: Cleans, filters, combines, and enriches information from multiple channels for consistent reporting and analysis.
Suitable for
Collecting marketing data from multiple sources
Automating data transfers and report updates
Analyzing cross-channel campaign performance and ROI
Combining marketing data for centralized reporting
Adverity
Adverity simplifies marketing data management by bringing information from multiple sources into one platform. Its ETL capabilities help businesses clean, organize, and standardize data for accurate analysis. Data pipelines reduce repetitive reporting tasks and maintain consistency across channels. AI-powered features identify unusual patterns and support informed business decisions.

Main features
Automated Data Integration: Connects marketing, advertising, social media, CRM, and analytics platforms through pre-built API connectors.
Data Harmonization and Mapping: Standardizes metrics from different advertising channels, making campaign results easier to compare and analyze.
Data Warehousing and BI Export: Transfers structured information to cloud data warehouses and visualization tools such as Tableau, Power BI, and Looker.
AI-Powered Analytics: Uses Adverity Atlas to investigate marketing data, identify unusual patterns, and support AI-driven analysis.
Suitable for
Integrating marketing data from multiple sources
Standardizing metrics for accurate campaign analysis
Automating data processing and reporting workflows
Identifying marketing trends and unusual data patterns
LeadJourney
LeadJourney is an AI-powered marketing attribution platform for tracking lead generation and campaign performance. It connects advertising data, website activity, and CRM records to show marketing contributions to sales. Advanced tracking helps businesses follow customer journeys from initial clicks to completed deals. Customizable dashboards monitor performance and measure actual return on advertising spend.
Main features
First-Party Server-Side Tracking: Monitors website clicks and visitor activity while reducing data loss caused by browser restrictions and cookie limitations.
Multi-Touch Attribution: Tracks customer journeys from initial ad interactions to booked calls and completed sales across different campaign levels.
CRM and Offline Conversion Sync: Integrates with HubSpot, Salesforce, and Pipedrive to share offline conversion data with advertising platforms such as Meta and Google.
Real-Time Performance Dashboards: Creates customizable reports to monitor key performance indicators, lead quality, and return on ad spend (ROAS).
Suitable for
Tracking lead generation and campaign performance
Measuring sales conversions and advertising ROI
Monitoring customer journeys and offline conversions
Analyzing marketing results across multiple channels
Cube
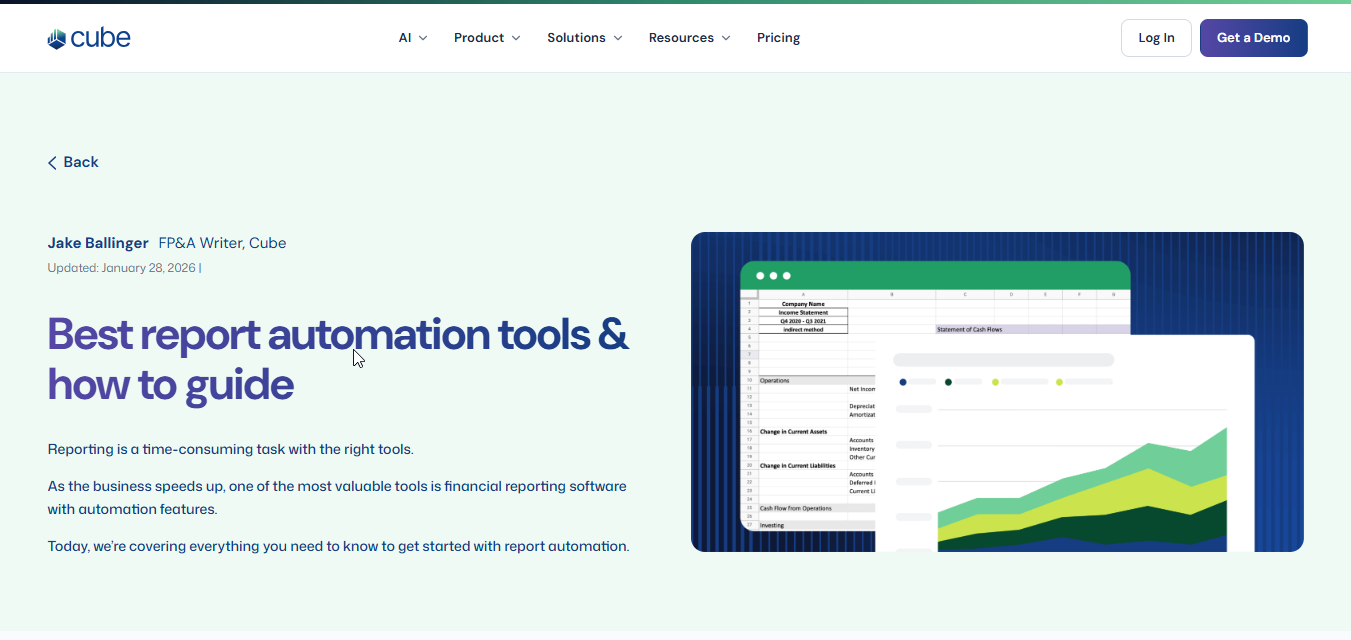
Cube is a cloud-based financial planning platform that brings budgeting, forecasting, and reporting tasks together. Finance teams can work directly with Excel and Google Sheets to manage financial records. Integration with ERP, CRM, and accounting systems simplifies data consolidation and minimizes manual work. AI-driven insights and forecasting tools help evaluate financial performance and guide business planning.
Main features
Spreadsheet Integration: Connects with Microsoft Excel and Google Sheets to import, update, and publish financial data while preserving existing formulas and formatting.
Automated Data Consolidation: Combines information from ERP, CRM, HR, and accounting systems to reduce manual data handling and improve accuracy.
Scenario Modeling and Forecasting: Supports rolling forecasts, what-if analysis, and financial scenario planning to compare actual results with budgeted figures.
AI-Powered Financial Insights: Uses AI tools to explain financial variances, trace figures to source transactions, and support forecasting decisions.
Suitable for
Managing budgets and financial planning workflows
Automating financial reports using familiar spreadsheets
Coordinating departmental budgets and controlling data access
Analyzing financial performance and preparing forecasts
Telerik Reporting
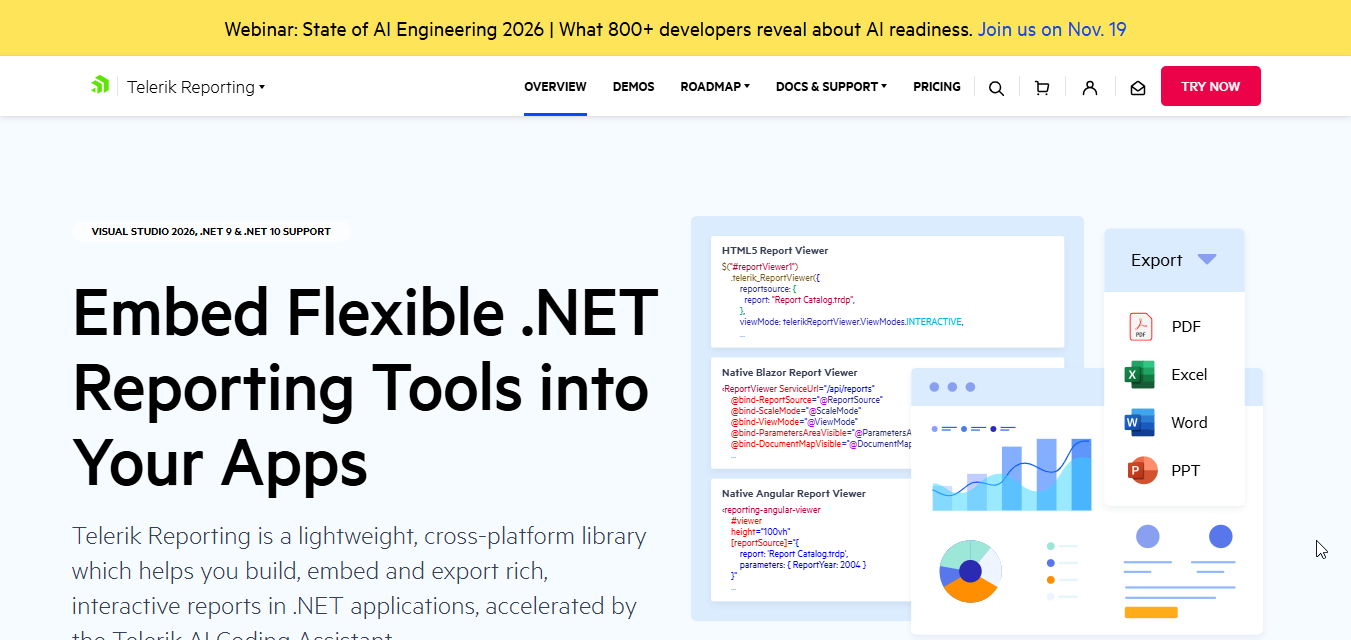
Telerik Reporting is a .NET solution developed by Progress for designing and displaying business reports. Developers can integrate reporting components directly into web, desktop, and cloud-based applications. Data from various sources can be transformed into invoices, financial statements, and operational summaries. Interactive viewers and multiple export formats simplify report access and secure sharing across teams.
Main features
Multiple Data Connectors: Retrieves and combines information from SQL Server, Oracle, OLAP cubes, JSON, XML, and custom business objects.
Interactive Reporting and Styling: Supports drill-down, sorting, filtering, conditional formatting, and customized report layouts for better data exploration.
Cross-Platform Report Viewers: Integrates reporting components into Blazor, Angular, React, Vue, WPF, and WinForms applications.
Flexible Export Options: Converts reports into formats such as PDF, Excel, Word, CSV, PowerPoint, RTF, and images.
Suitable for
Embedding reporting features into business applications.
Adding reporting capabilities across multiple development frameworks.
Creating invoices, financial statements, and sales reports.
Building cost-effective reporting solutions for business applications.
How to choose an automation reporting tool
Choosing an automation reporting tool becomes easier when you understand your reporting needs and business goals. Consider the data sources, automation features, and reporting options available before making a decision. These factors can help you select a tool that suits your workflow and improves reporting efficiency.
Data source compatibility: Check whether the tool connects with your existing databases, spreadsheets, CRM systems, and business applications. Support for multiple integrations makes information collection easier. Choose an option that works with your current data sources.
Automation capabilities: Review the available features for scheduling reports, refreshing data, and sending notifications. Automated workflows can reduce repetitive tasks and save time. Select a platform that handles regular reporting activities efficiently.
Report customization: Look for options to adjust layouts, charts, tables, and dashboard elements. Customizable templates help present information according to specific business needs. Make sure the tool supports different reporting requirements.
Data accuracy and reliability: Consider how the platform processes, validates, and updates collected information. Reliable reporting depends on consistent data and accurate calculations. Check whether the software includes error detection and monitoring features.
Output formats and sharing options: Explore the supported formats, such as PDF, Excel, CSV, and PowerPoint. Flexible export options make reports easier to distribute and review. Also, consider built-in sharing features for smooth collaboration across different teams and departments.
Ease of use and scalability: Choose software with a clear interface that does not require extensive technical knowledge. Consider whether the platform can handle growing data volumes and reporting demands. Flexible pricing and upgrade options can also support long-term use.
Conclusion
Automation reporting tools help businesses collect data, generate reports, and track performance with less manual effort. Different platforms provide useful features for managing data, updating dashboards, and sharing reports across teams. Selecting the right tool depends on your reporting needs, business goals, and budget. For a more organized workflow, try Kimi Work to automate daily tasks, manage reports, simplify team collaboration, and improve overall work efficiency.