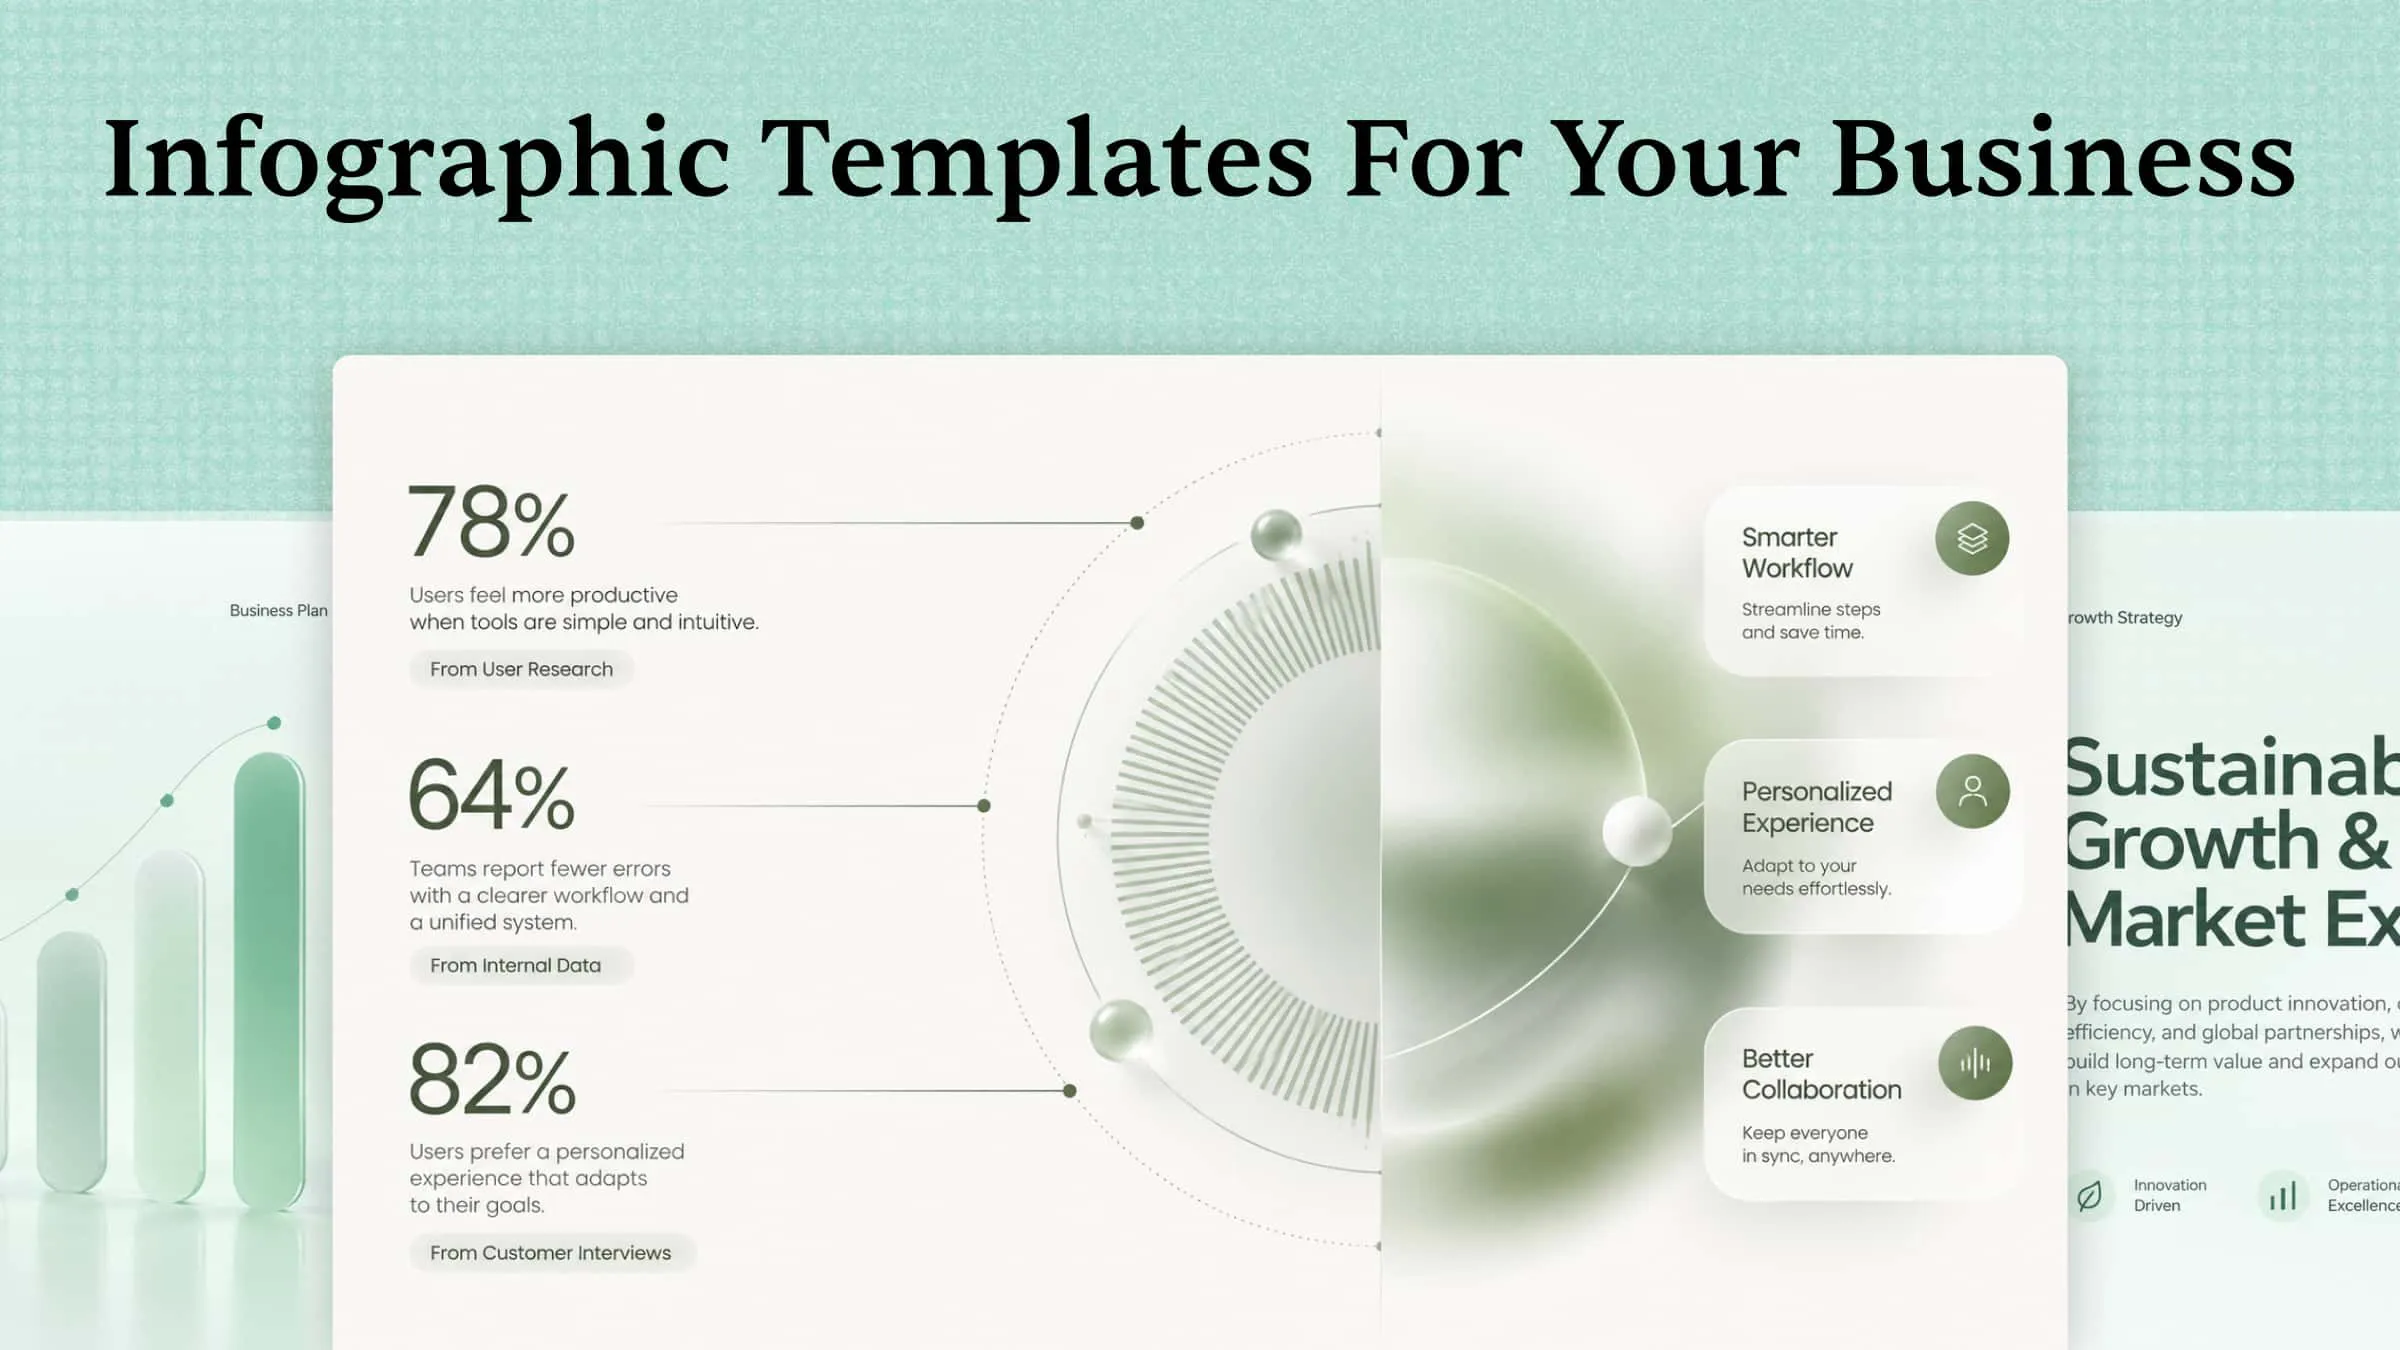
A business infographic can present complex data, reports, or strategies in a limited space. The right design makes this information easier to understand and helps readers identify key insights quickly. However, choosing a suitable layout for different business needs can be challenging. This guide explores 10 business infographic templates for common scenarios, from financial reporting to market research.
Overview of 10 editable infographic templates for your business
Different business goals require different visual formats, from tracking company growth to explaining workflows and analyzing market trends. The table below compares 10 business infographics, their key purposes, and how they can support different business needs.
| Infographic template | Main purpose | Key elements | Suitable for | Example use case |
|---|---|---|---|---|
| Business growth infographic | Shows business progress and growth over time. | Growth metrics, milestones, charts | Performance tracking and reporting | Presenting annual revenue growth |
| Business process infographic | Explains workflows and tasks in sequence. | Process steps, arrows, flowcharts | Team training and process documentation | Visualizing a product approval workflow |
| Market research infographic | Summarizes market trends and audience insights. | Market data, customer profiles, competitor analysis | Market analysis and business planning | Comparing customer preferences |
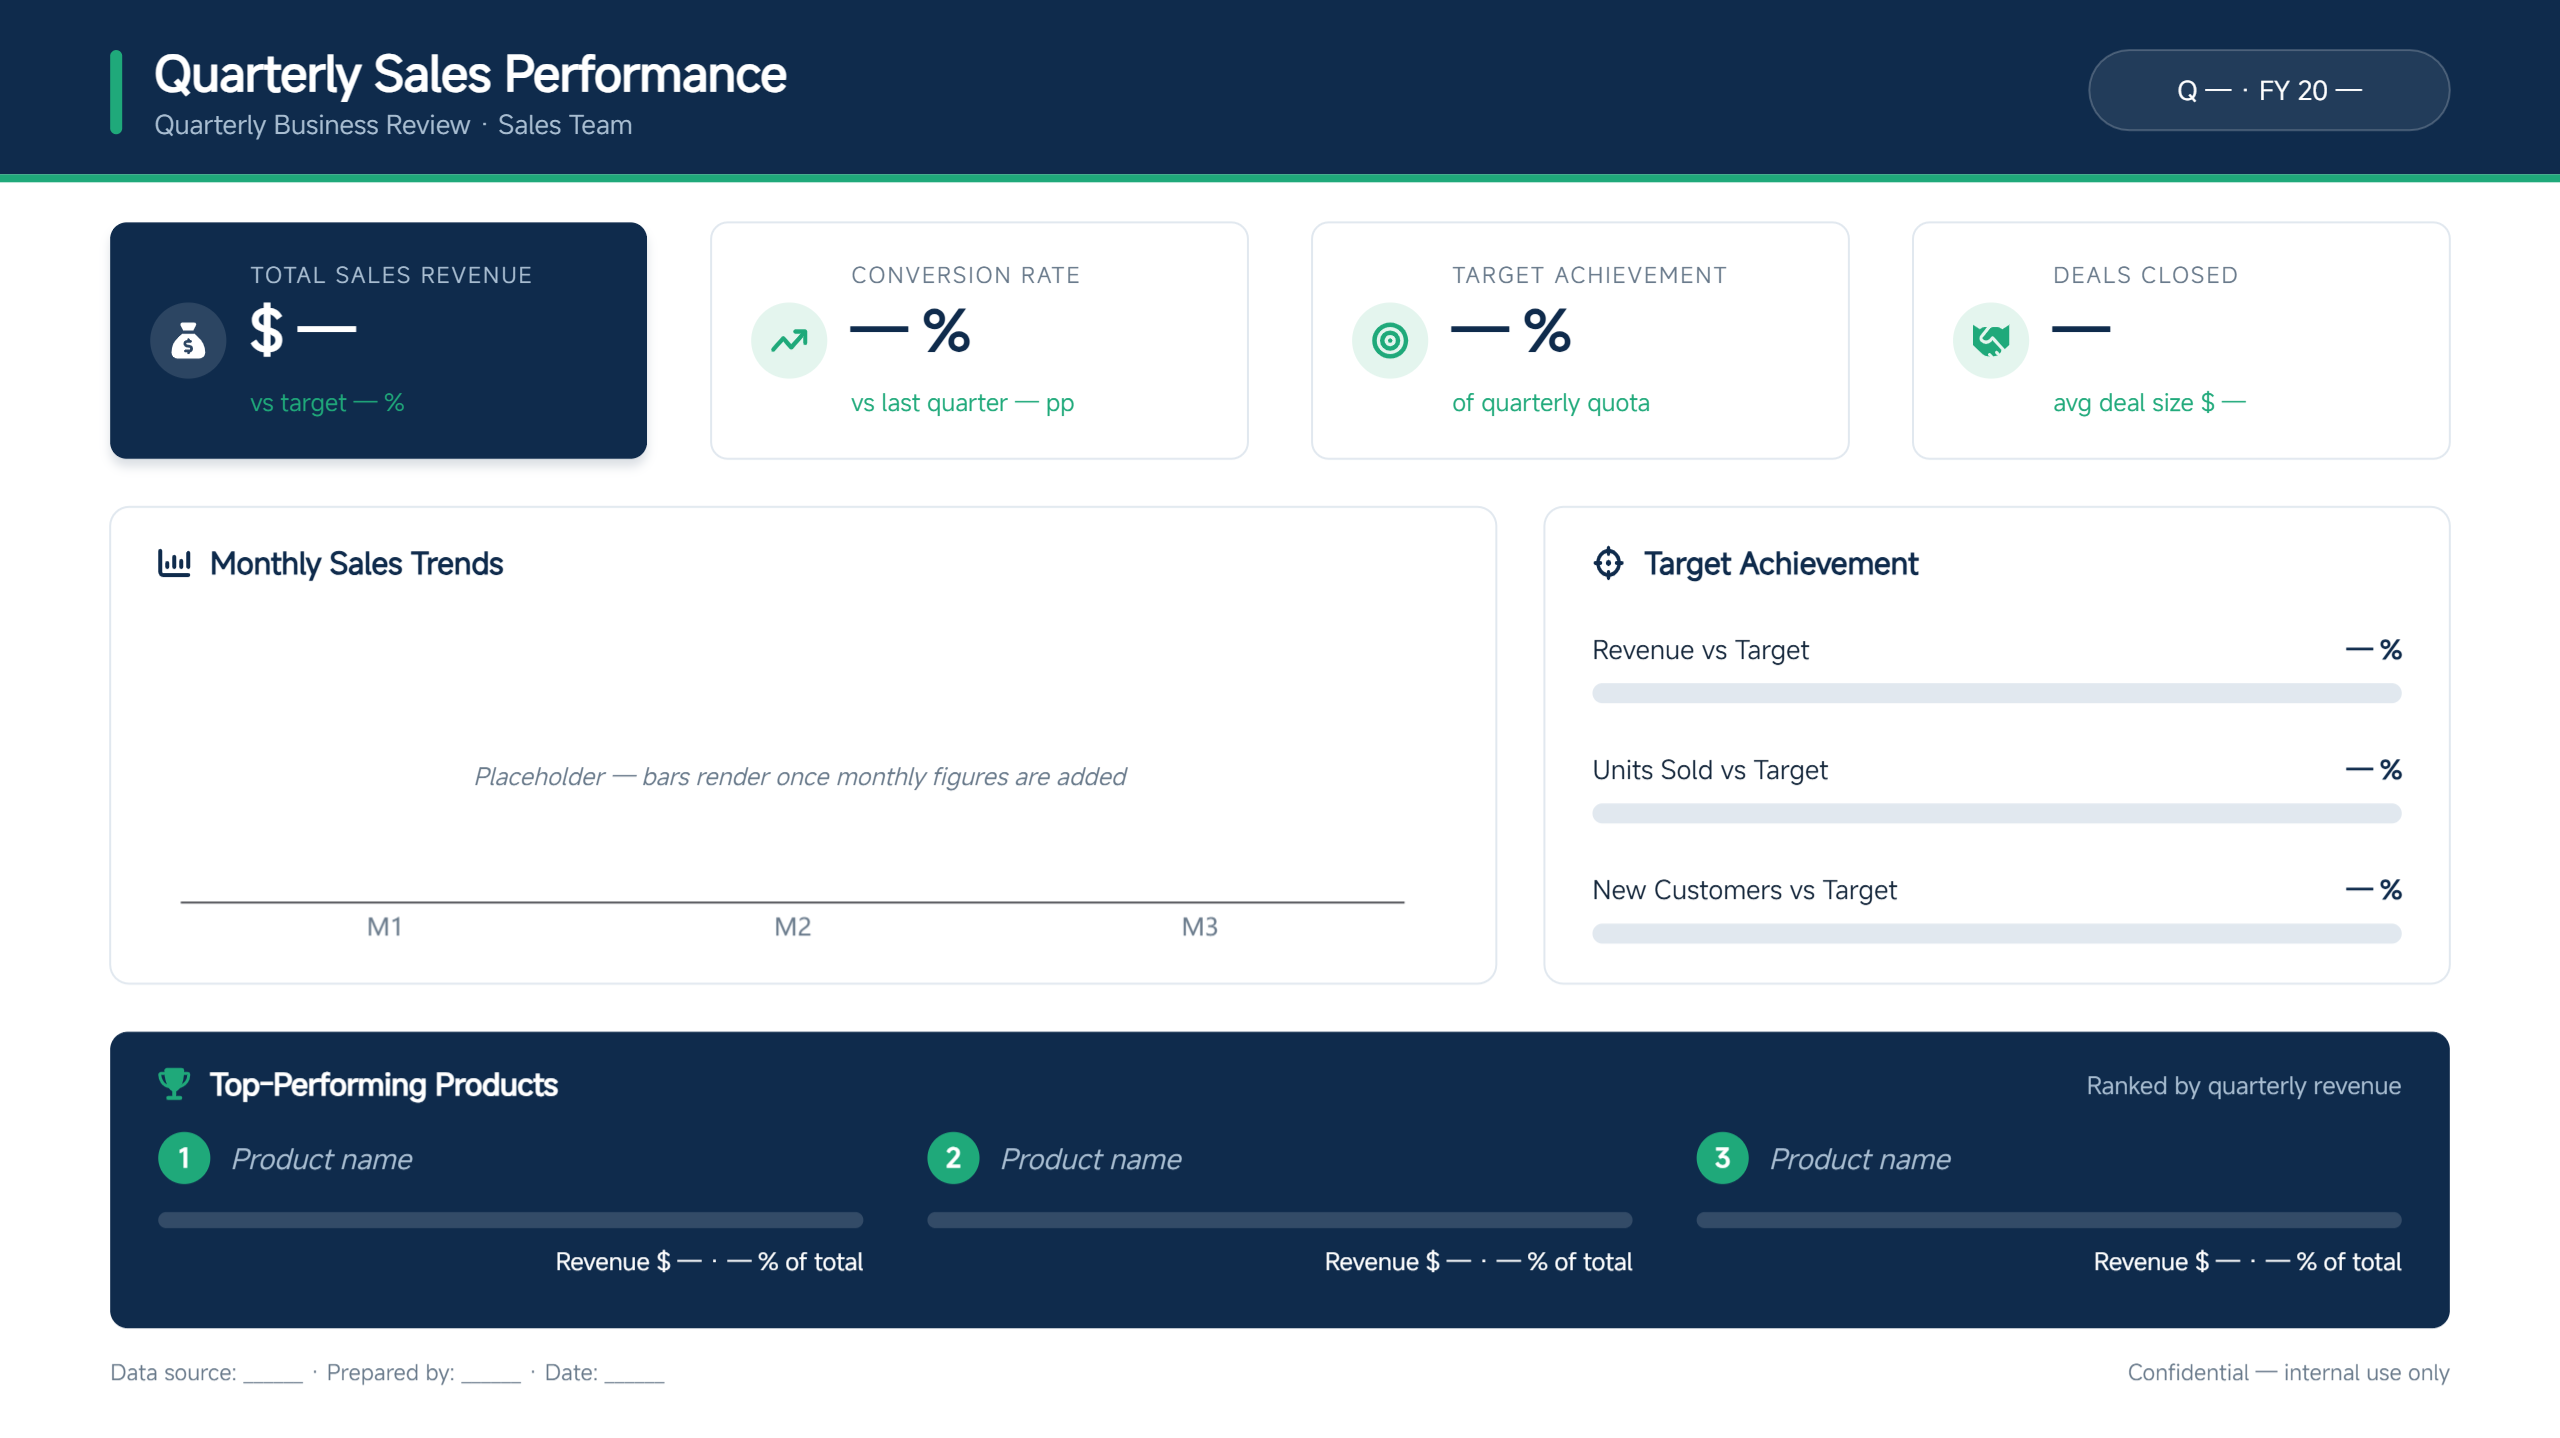
| Sales performance infographic | Presents sales results against targets. | Revenue figures, sales targets, KPIs | Sales reviews and performance tracking | Comparing quarterly sales results |
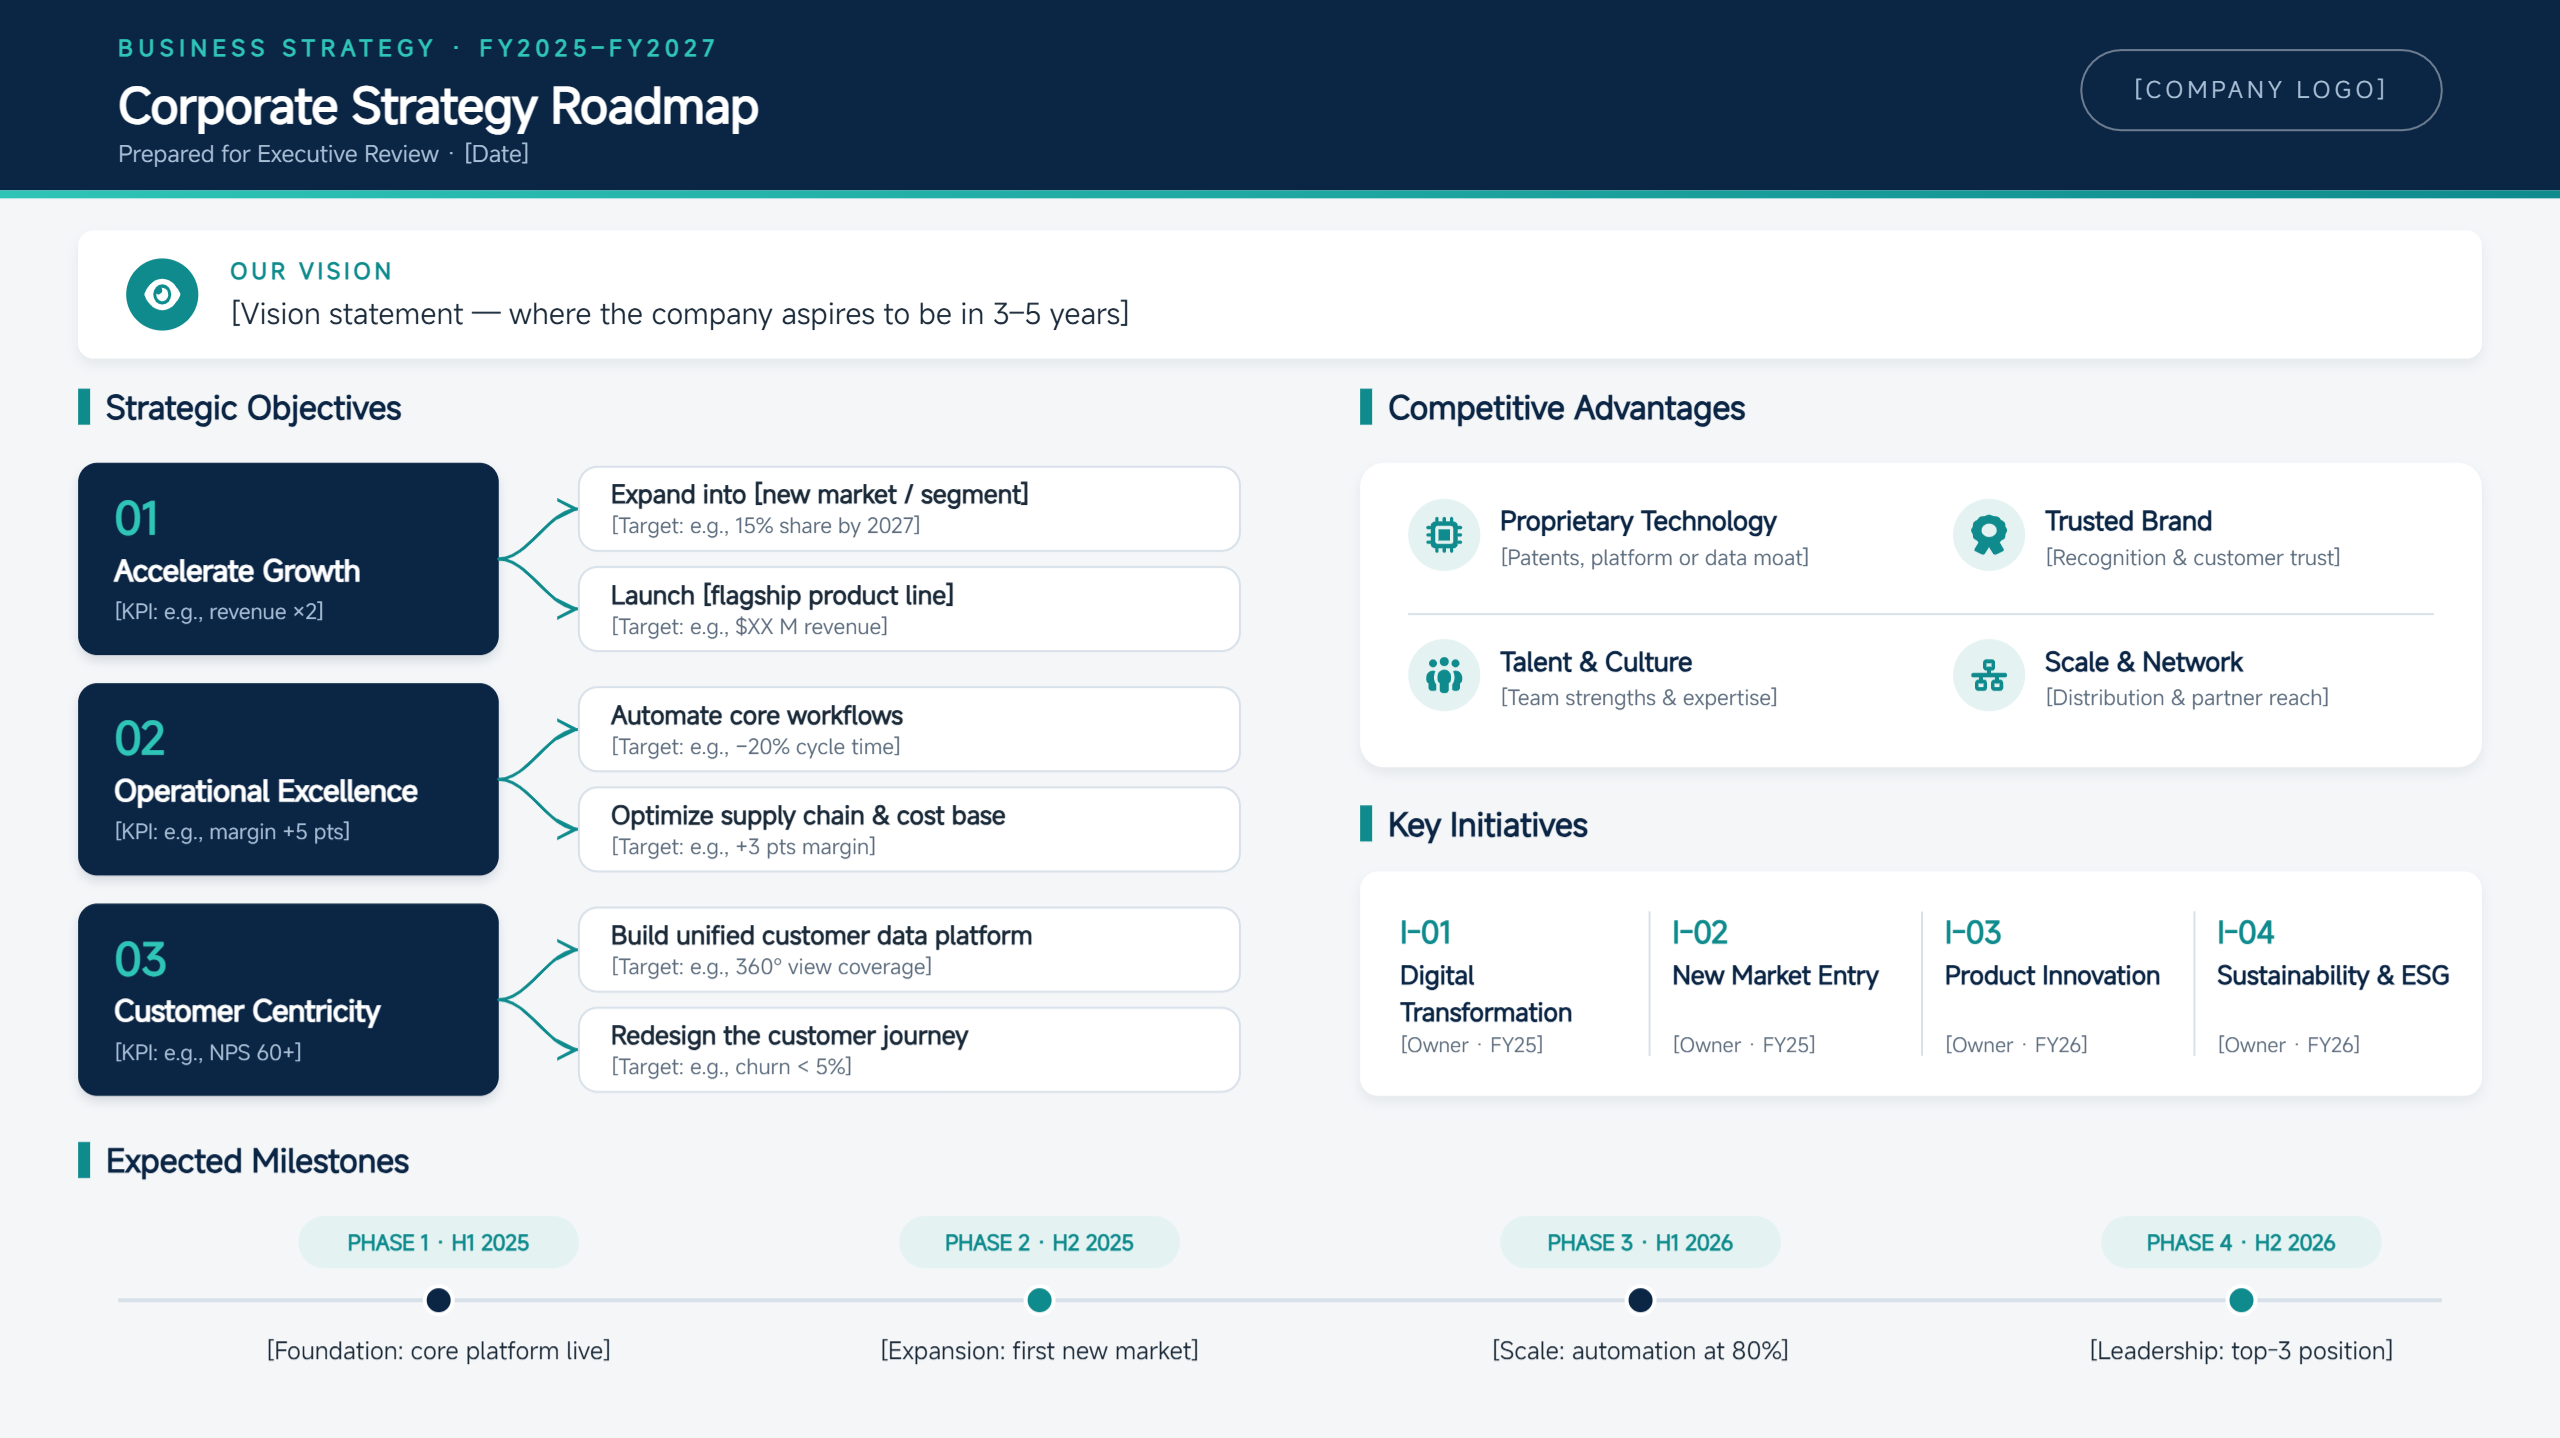
| Business strategy infographic | Communicates goals and action plans. | Objectives, priorities, timelines | Strategic planning and presentations | Outlining a company's growth strategy |
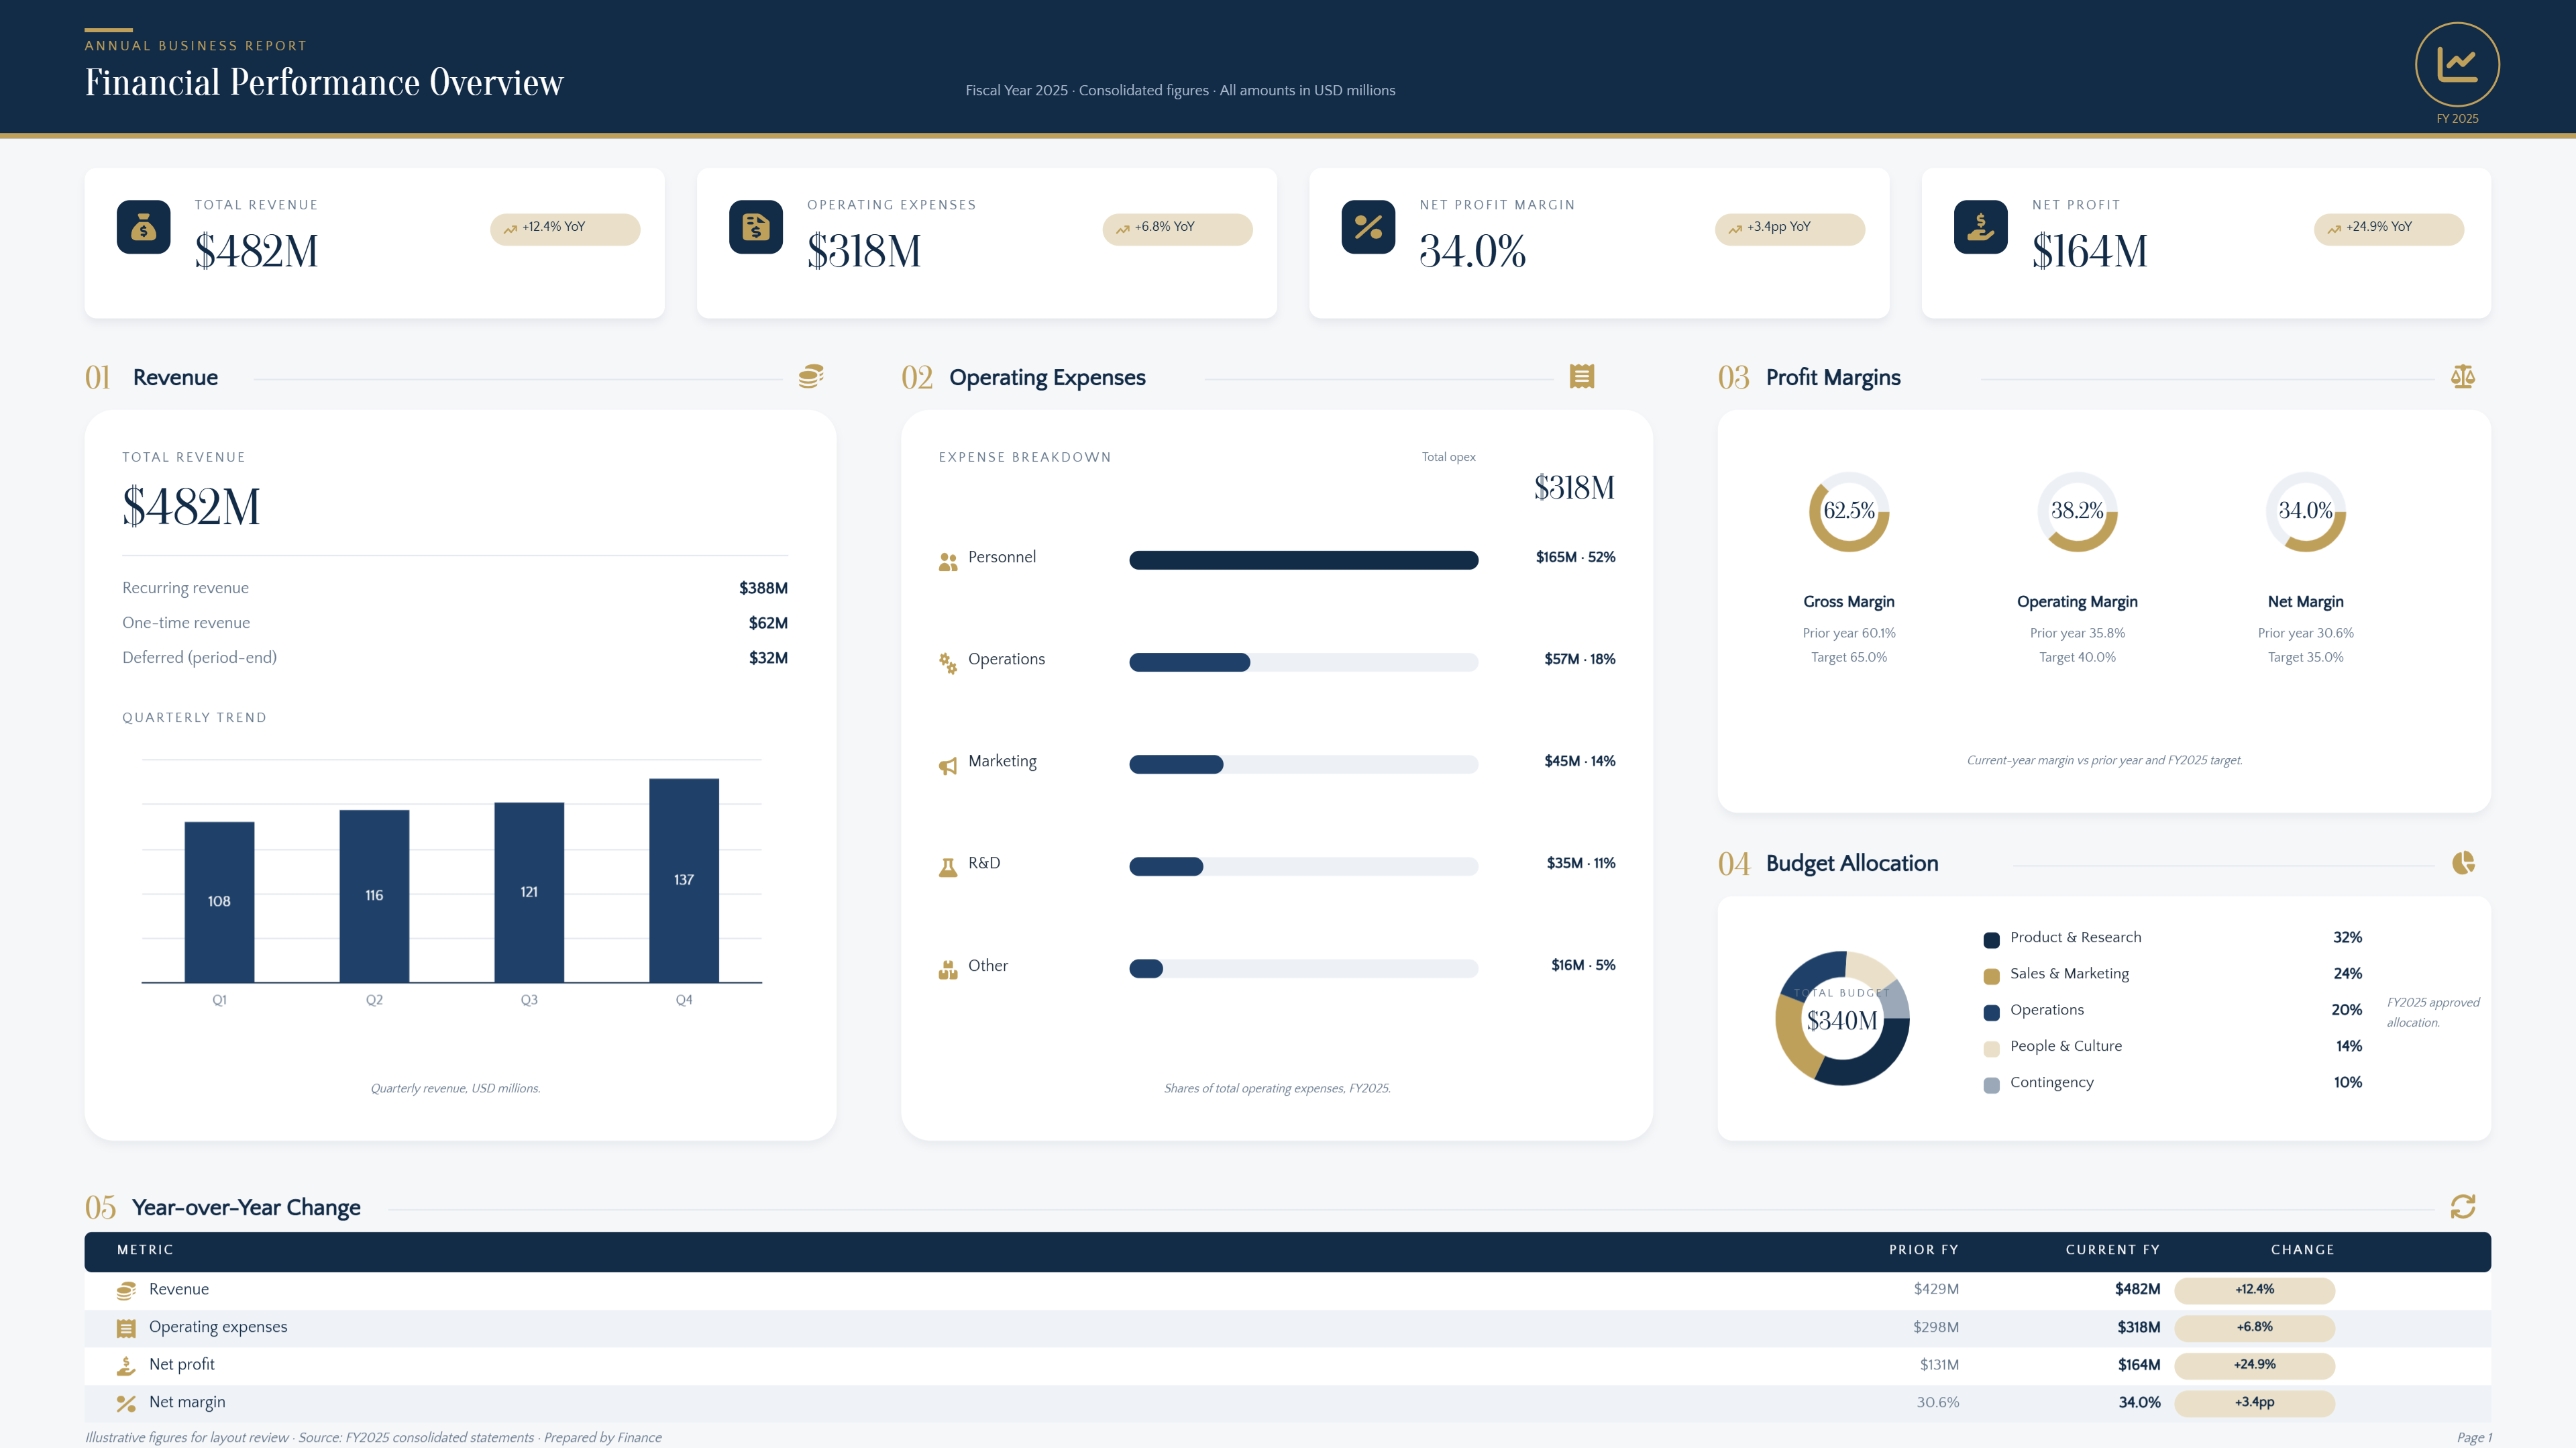
| Financial infographic | Summarizes financial data and results. | Budgets, expenses, revenue, profit charts | Financial reporting and budget reviews | Breaking down monthly expenses |
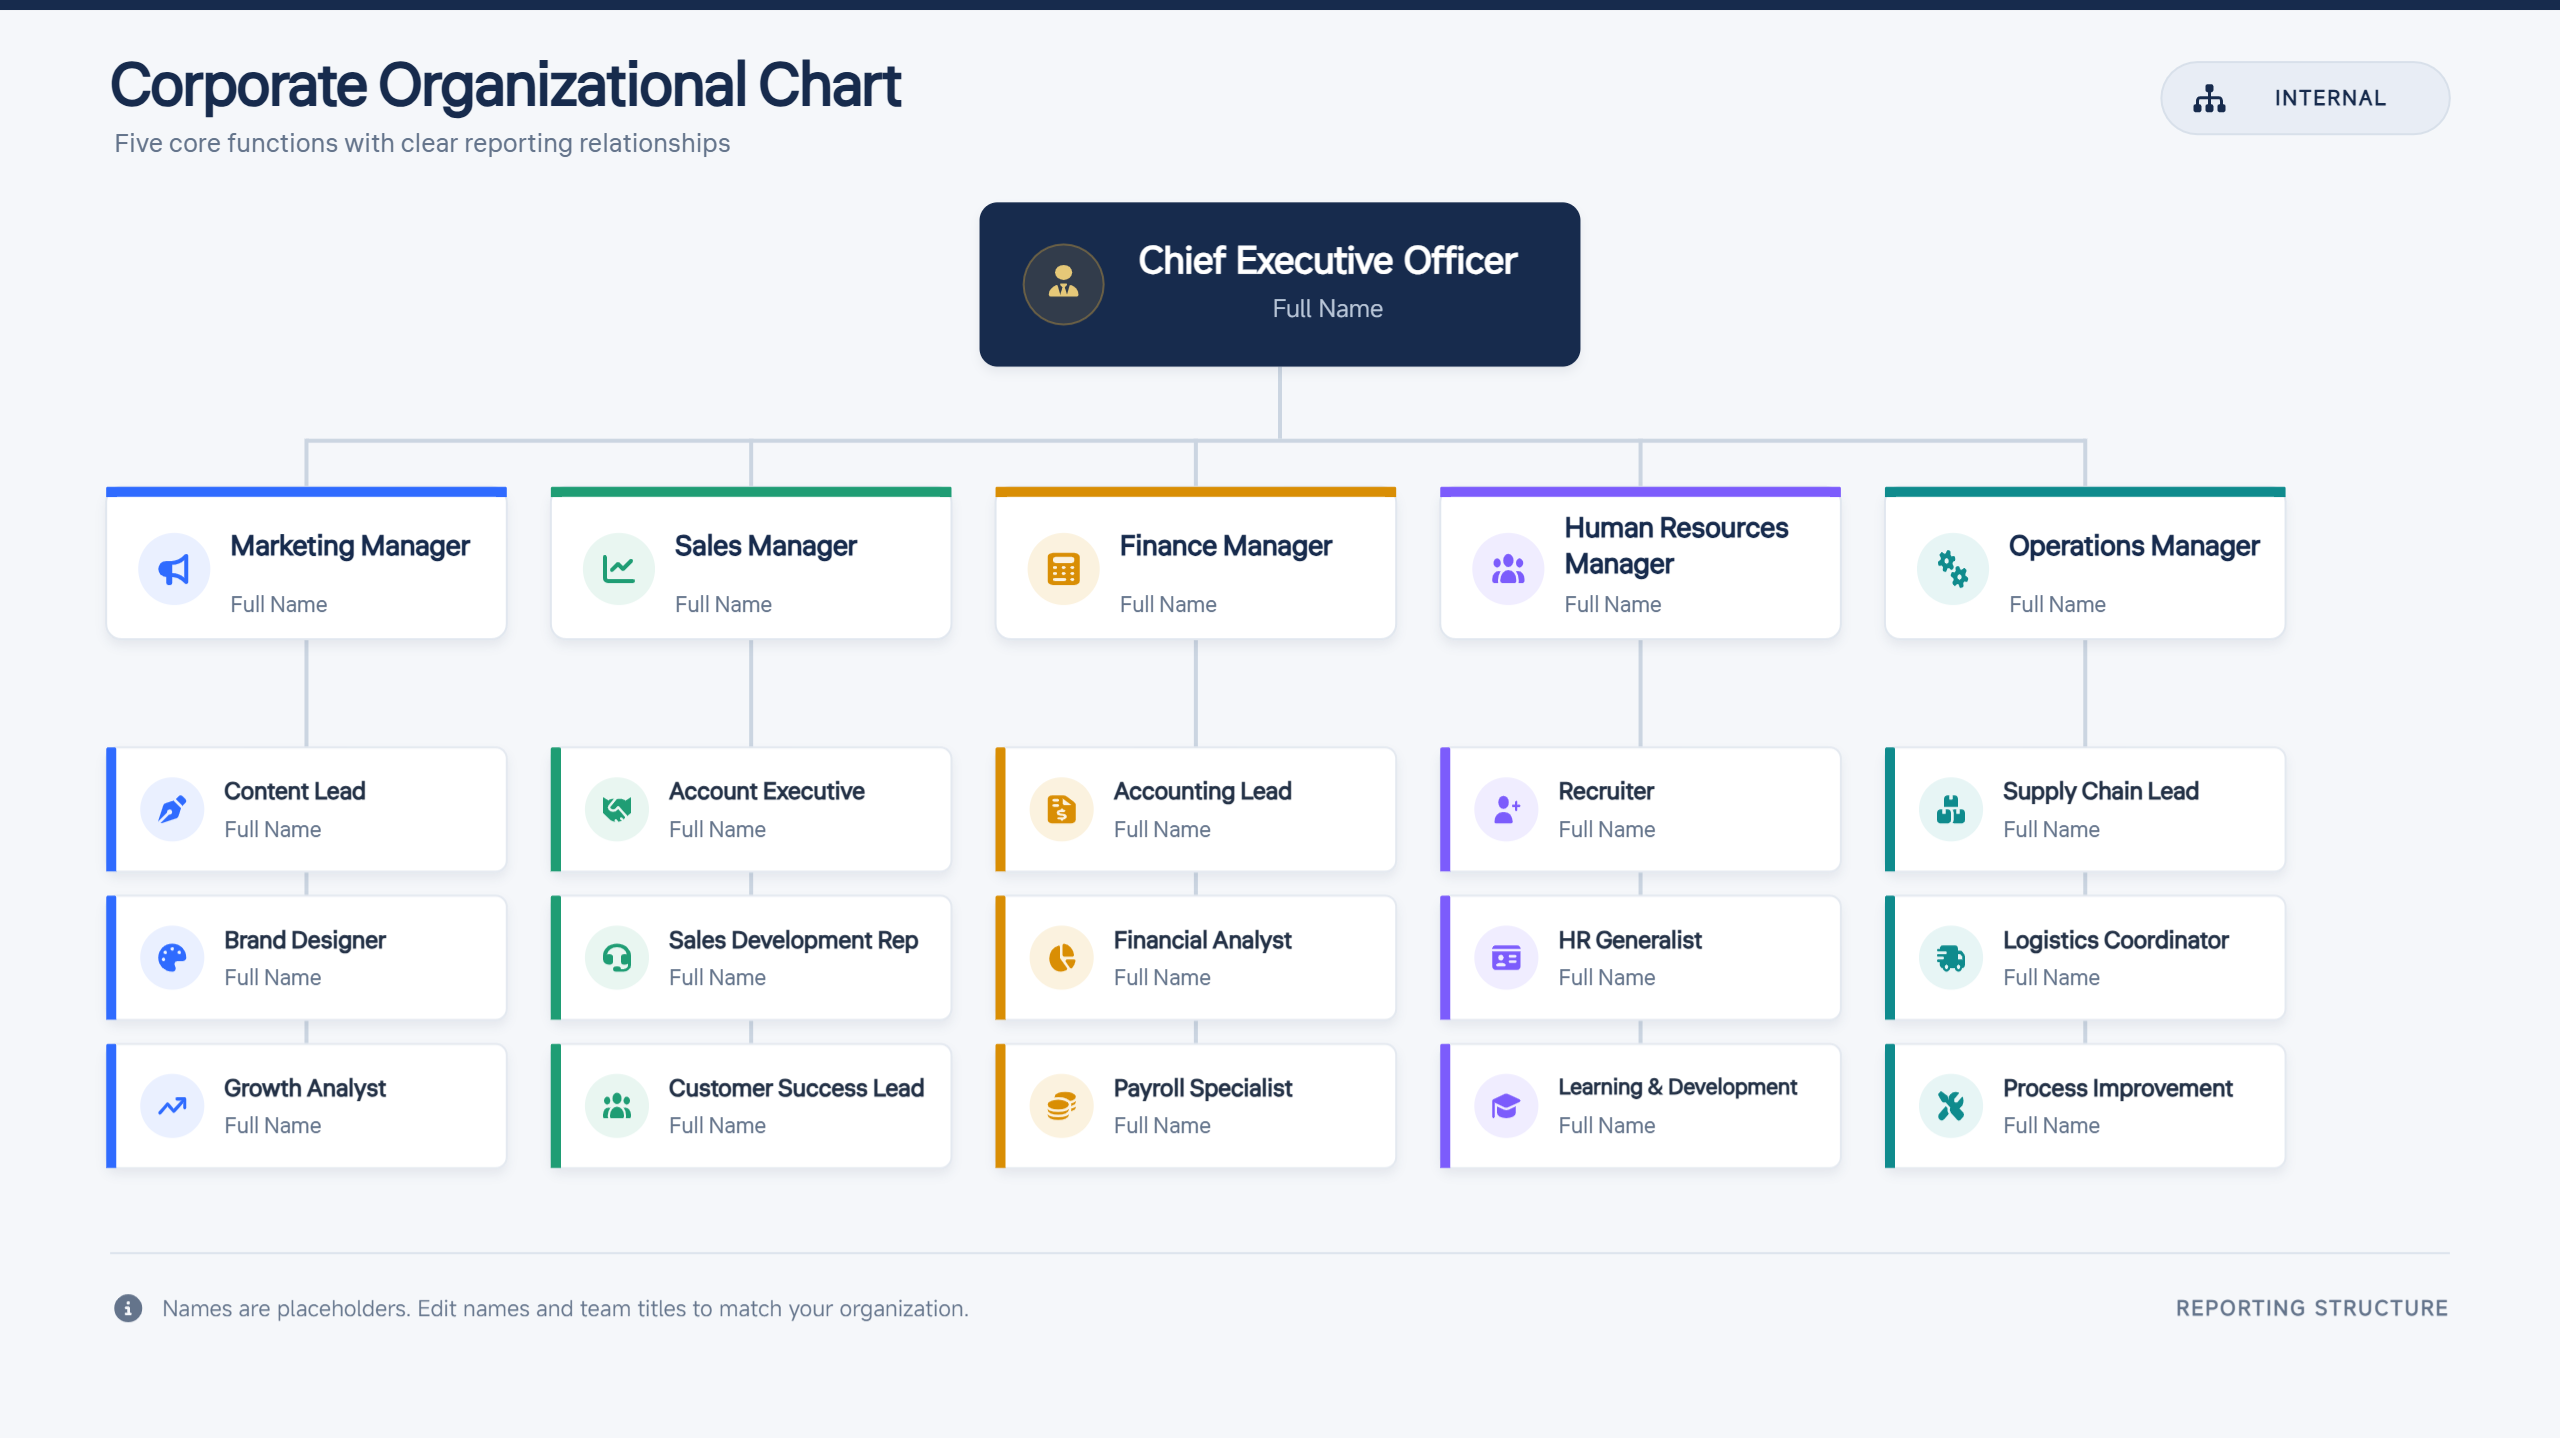
| Organizational chart infographic | Shows company structure and reporting lines. | Roles, departments, team connections | Team introductions and organizational planning | Presenting departmental responsibilities |
| Product launch infographic | Highlights launch details and product benefits. | Features, launch dates, campaign milestones | Product marketing and announcements | Promoting a new software release |
| Customer journey infographic | Maps customer interactions across stages. | Touchpoints, customer actions, pain points | Customer experience and marketing | Visualizing the path from discovery to purchase |
| SWOT analysis infographic | Evaluates internal strengths and weaknesses alongside external opportunities and threats. | Four SWOT quadrants, concise findings | Business analysis and decision-making | Assessing a new market opportunity |
10 business infographic templates for common business scenarios
Business infographics help turn complex information into clear visuals that teams, clients, and stakeholders can understand quickly. With Kimi Design, an AI design generator, you can describe your infographic requirements in a text prompt and use AI to create a design that fits your topic. A clear prompt should specify the audience, key information, layout, color palette, and visual style. You can then review the generated design, refine it, and export the finished result.
Business growth infographic
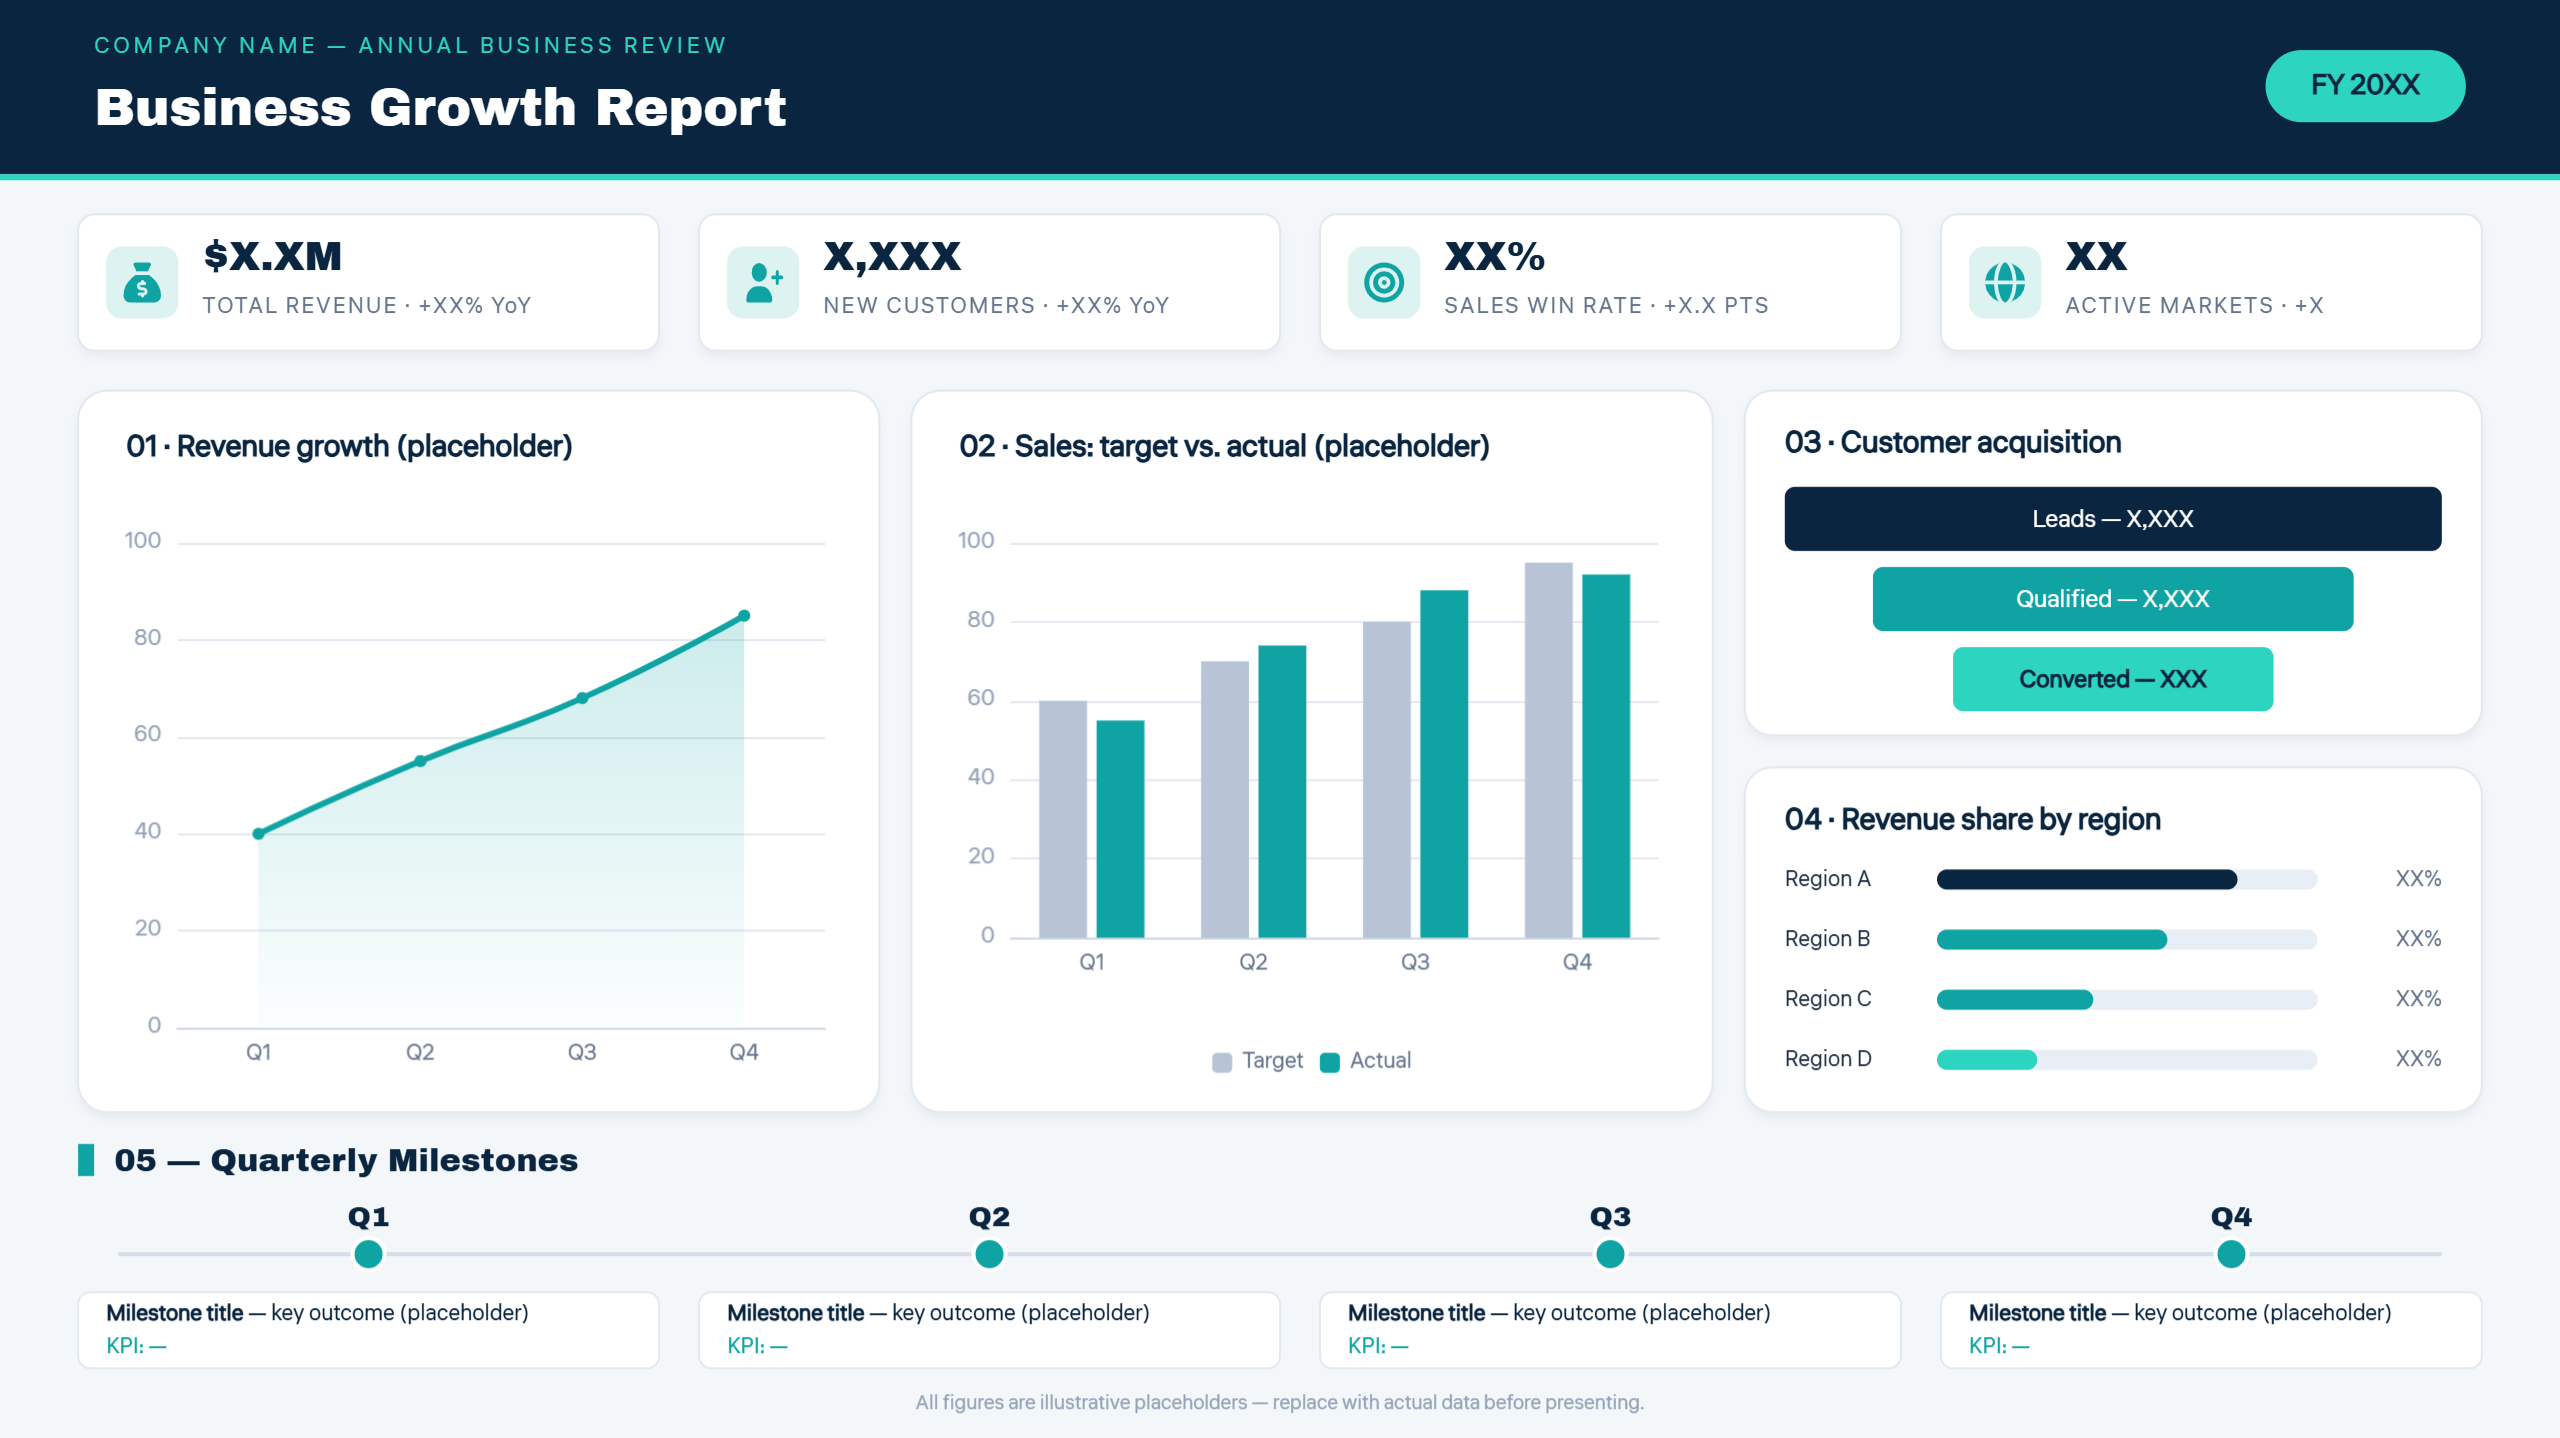
A business growth infographic presents important performance indicators in a visual format. Use it to highlight revenue increases, customer acquisition, sales performance, or expansion milestones over a specific period. A well-organized layout helps business owners and stakeholders understand progress and identify the metrics that deserve attention.
Prompt:
Business process infographic
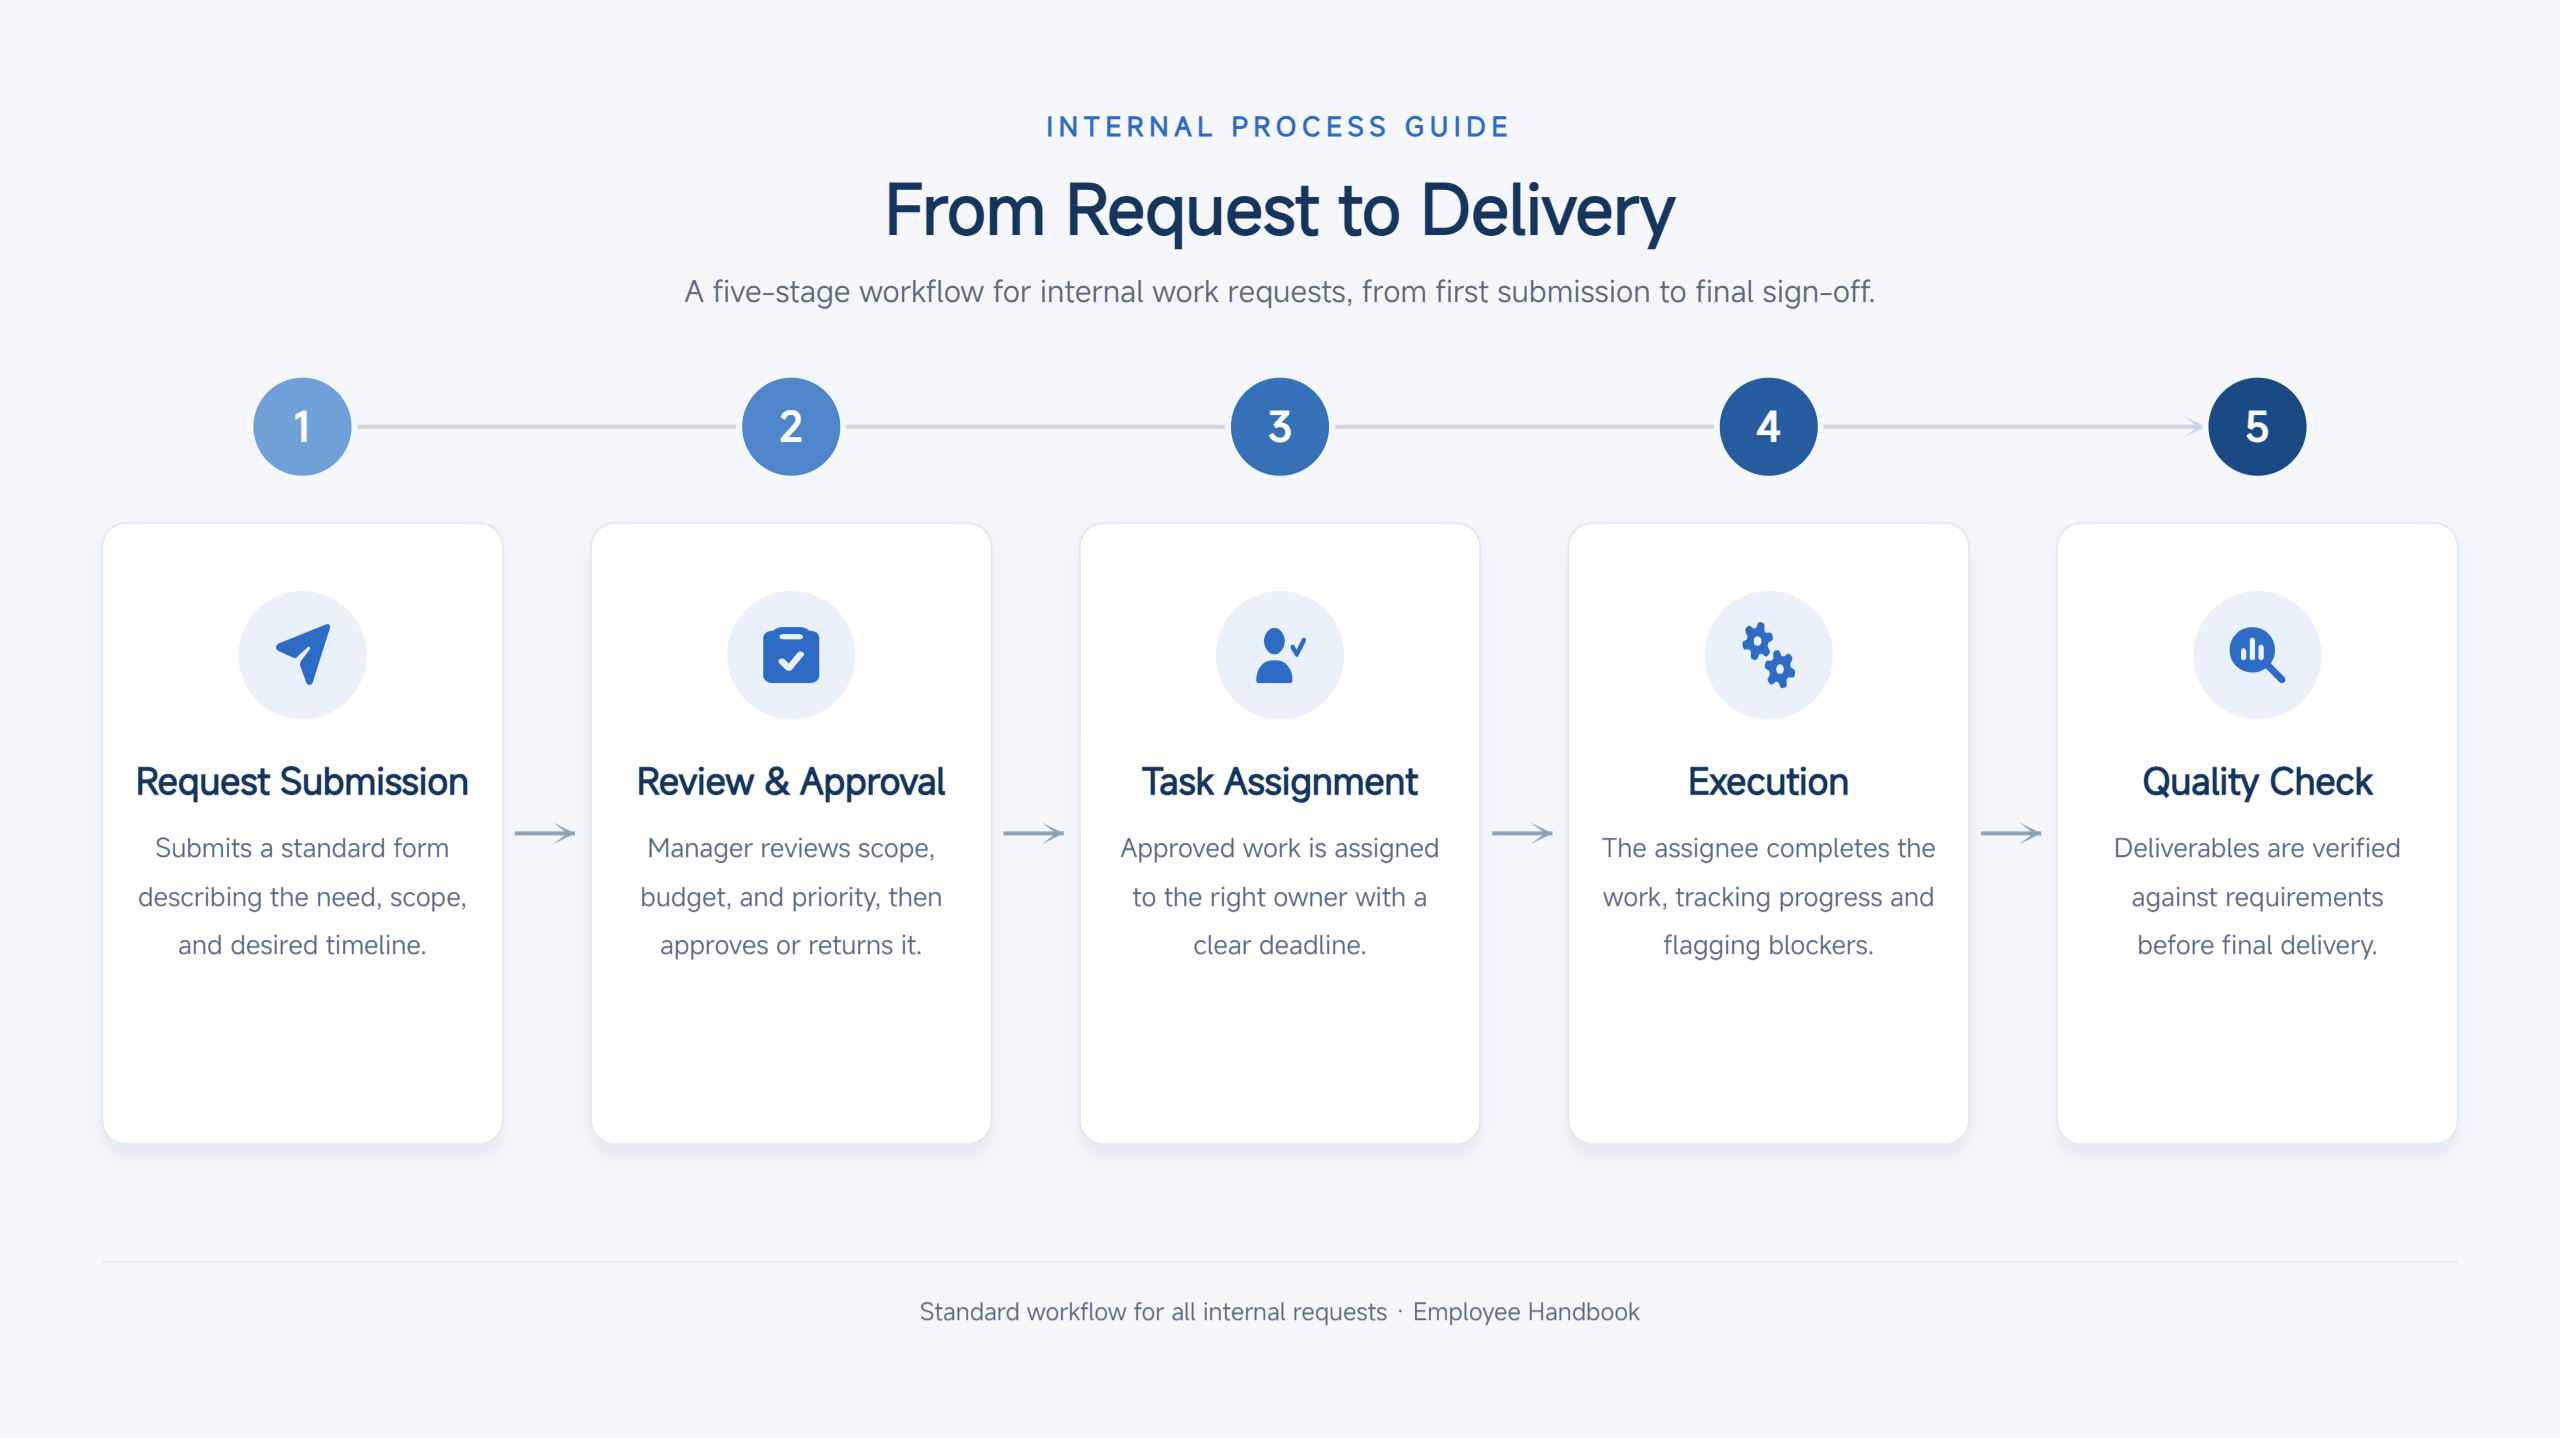
A business process infographic explains how a task moves from one stage to the next. It works well for onboarding, internal procedures, project handoffs, and operational workflows. Use a flowchart-style layout to show the sequence of activities, decision points, and responsible teams without overwhelming readers with long explanations.
Prompt:
Market research infographic
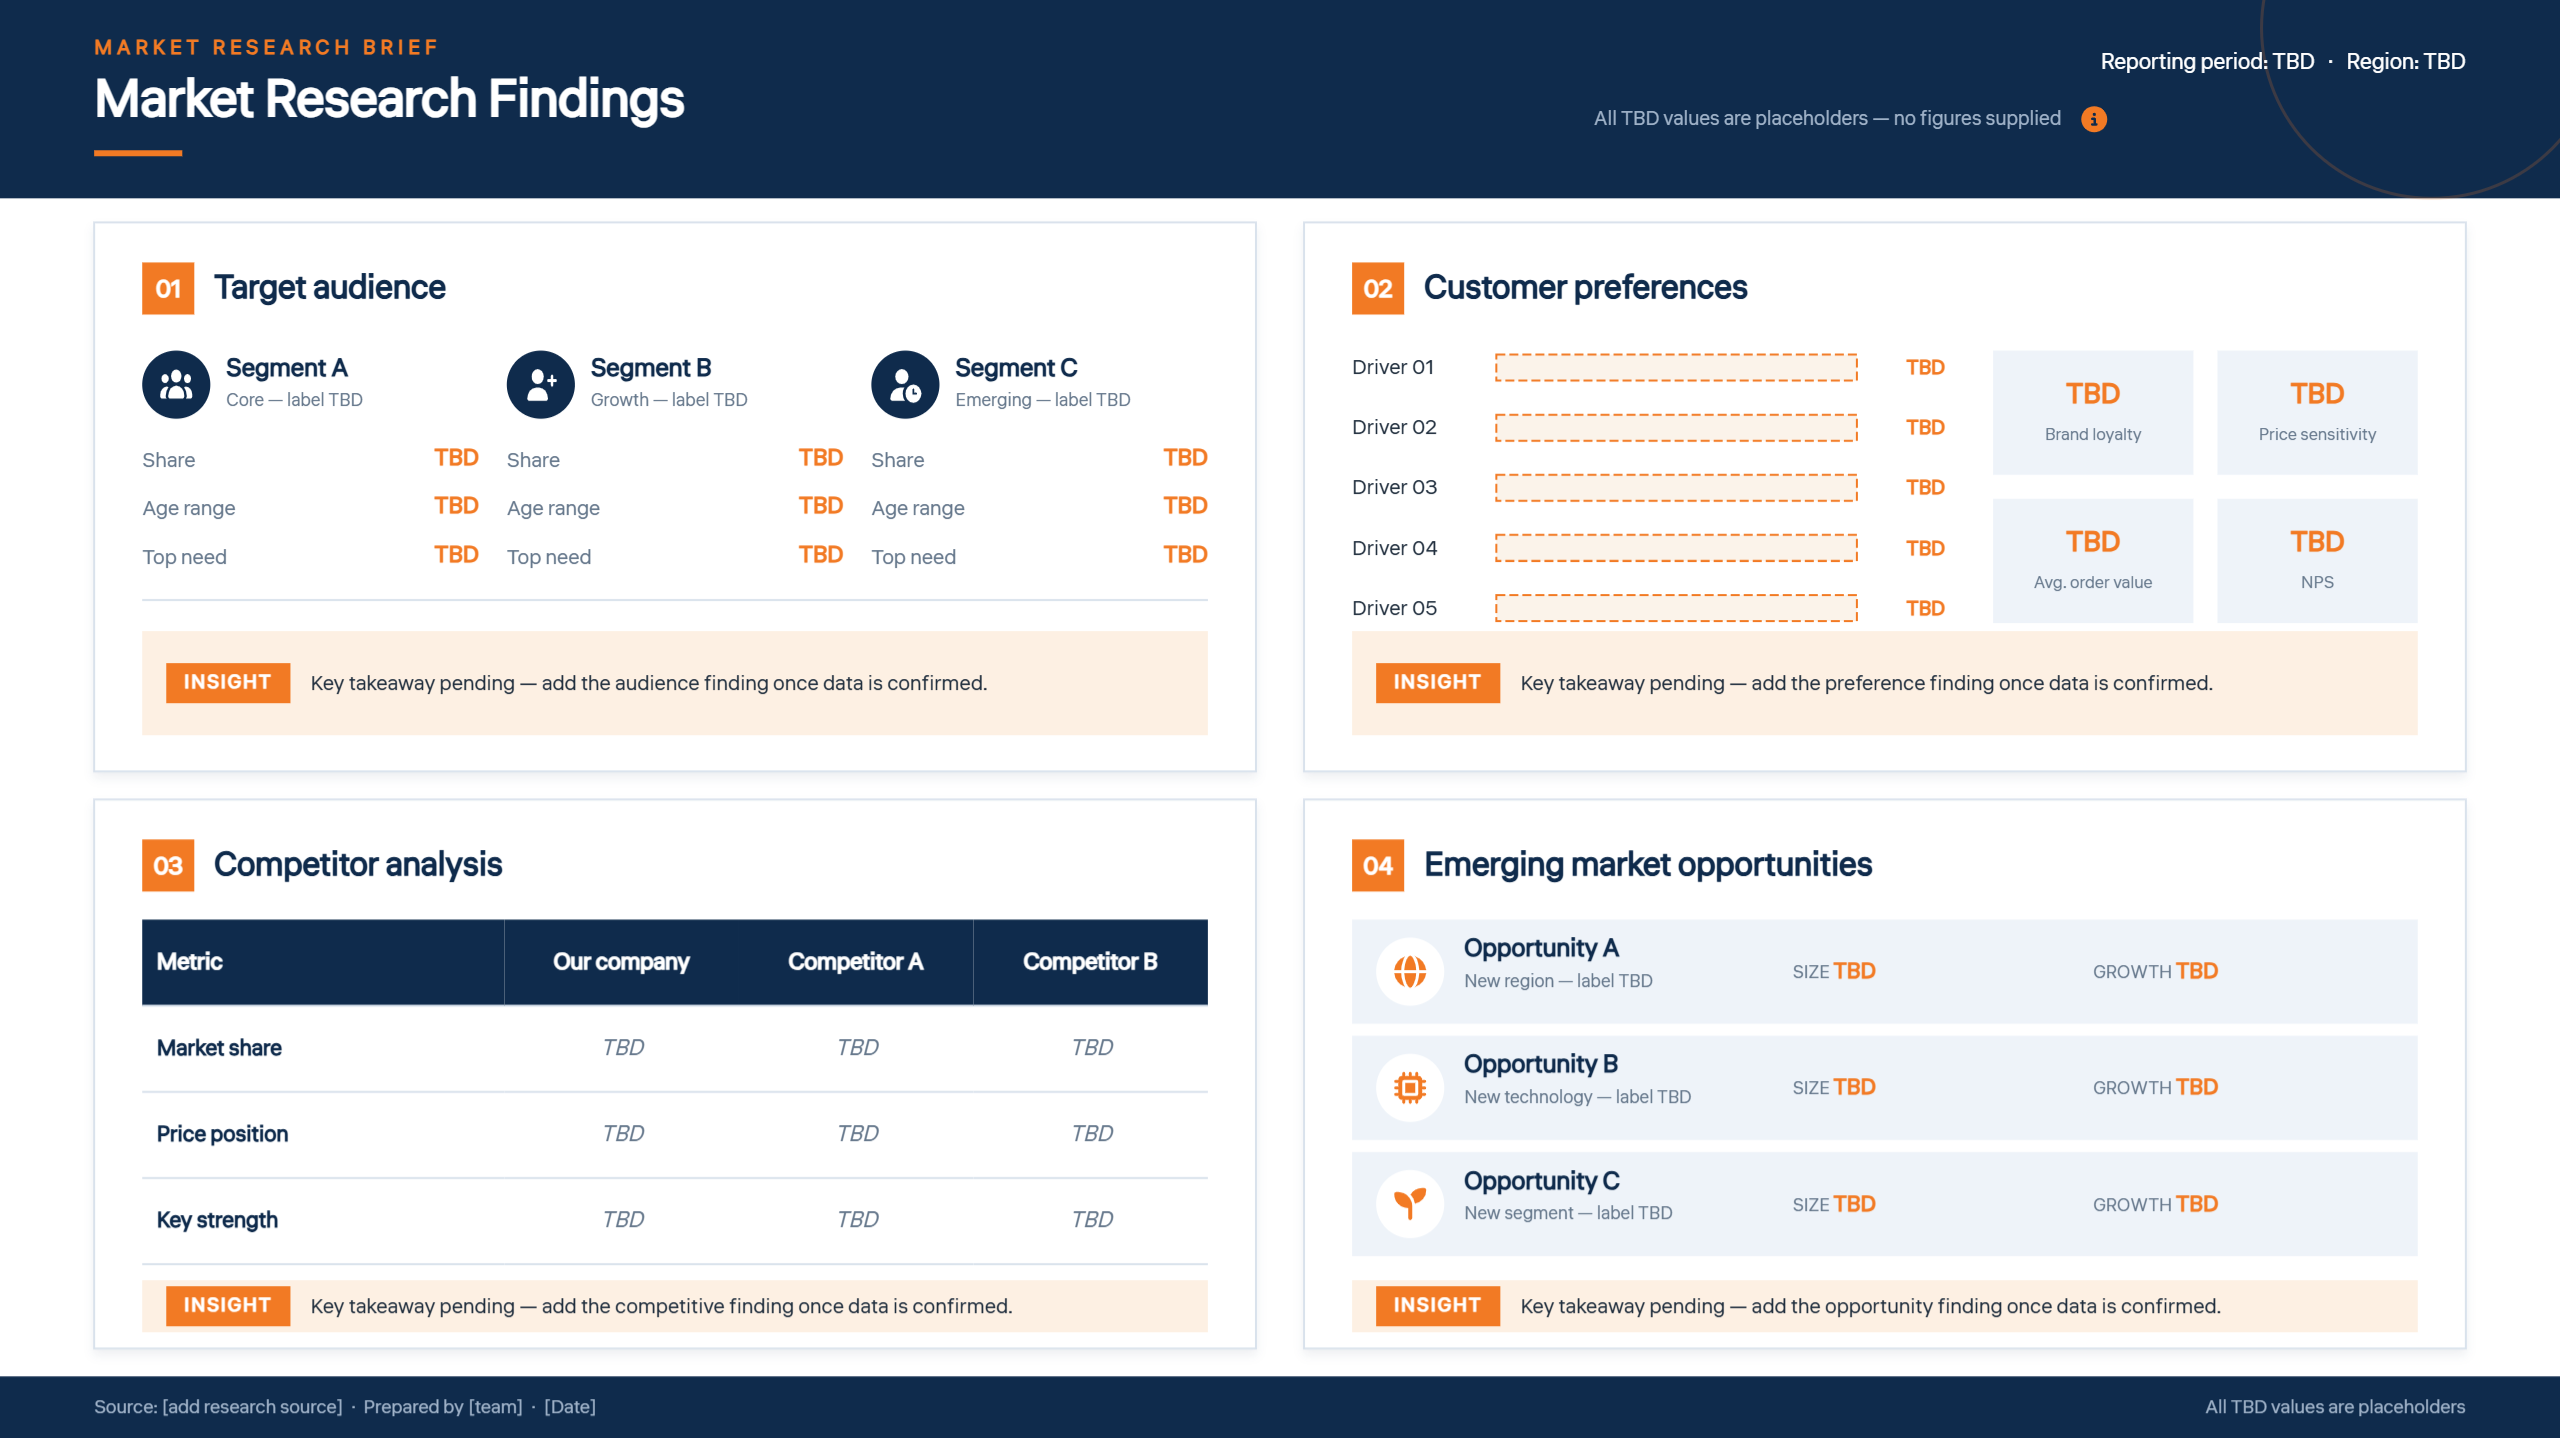
A market research infographic summarizes findings about customers, competitors, industry trends, and market opportunities. It can help teams present research findings without relying on dense paragraphs or lengthy reports. Use a structured layout that separates market insights, customer preferences, competitor comparisons, and key takeaways.
Prompt:
Sales performance infographic
Sales teams need a quick way to understand whether they are meeting their targets and where performance is changing. A sales performance infographic turns figures such as monthly revenue, conversion rates, sales volume, and target completion into an easy-to-read visual report. Use it during team meetings or quarterly reviews to highlight achievements and areas that need improvement.
Prompt:
Business strategy infographic
A business strategy infographic helps communicate where a company wants to go and how it plans to get there. It can outline strategic priorities, competitive advantages, long-term objectives, and key initiatives in one cohesive design. This format is useful for leadership presentations, annual planning sessions, and team alignment.
Prompt:
Financial infographic
Financial information can be difficult to interpret when it appears in dense spreadsheets or lengthy reports. A financial infographic presents essential figures, including expenses, revenue, profit margins, and budget allocation, in a more accessible format. It can help business owners explain financial performance, communicate budget decisions, and identify spending patterns.
Prompt:
Organizational chart infographic
An organizational chart infographic clarifies how a company is structured and how different roles connect. It can display departments, reporting relationships, management levels, and team responsibilities in a single visual. This format is particularly useful for employee onboarding, company presentations, and internal communication when people need a clear view of the reporting structure.
Prompt:
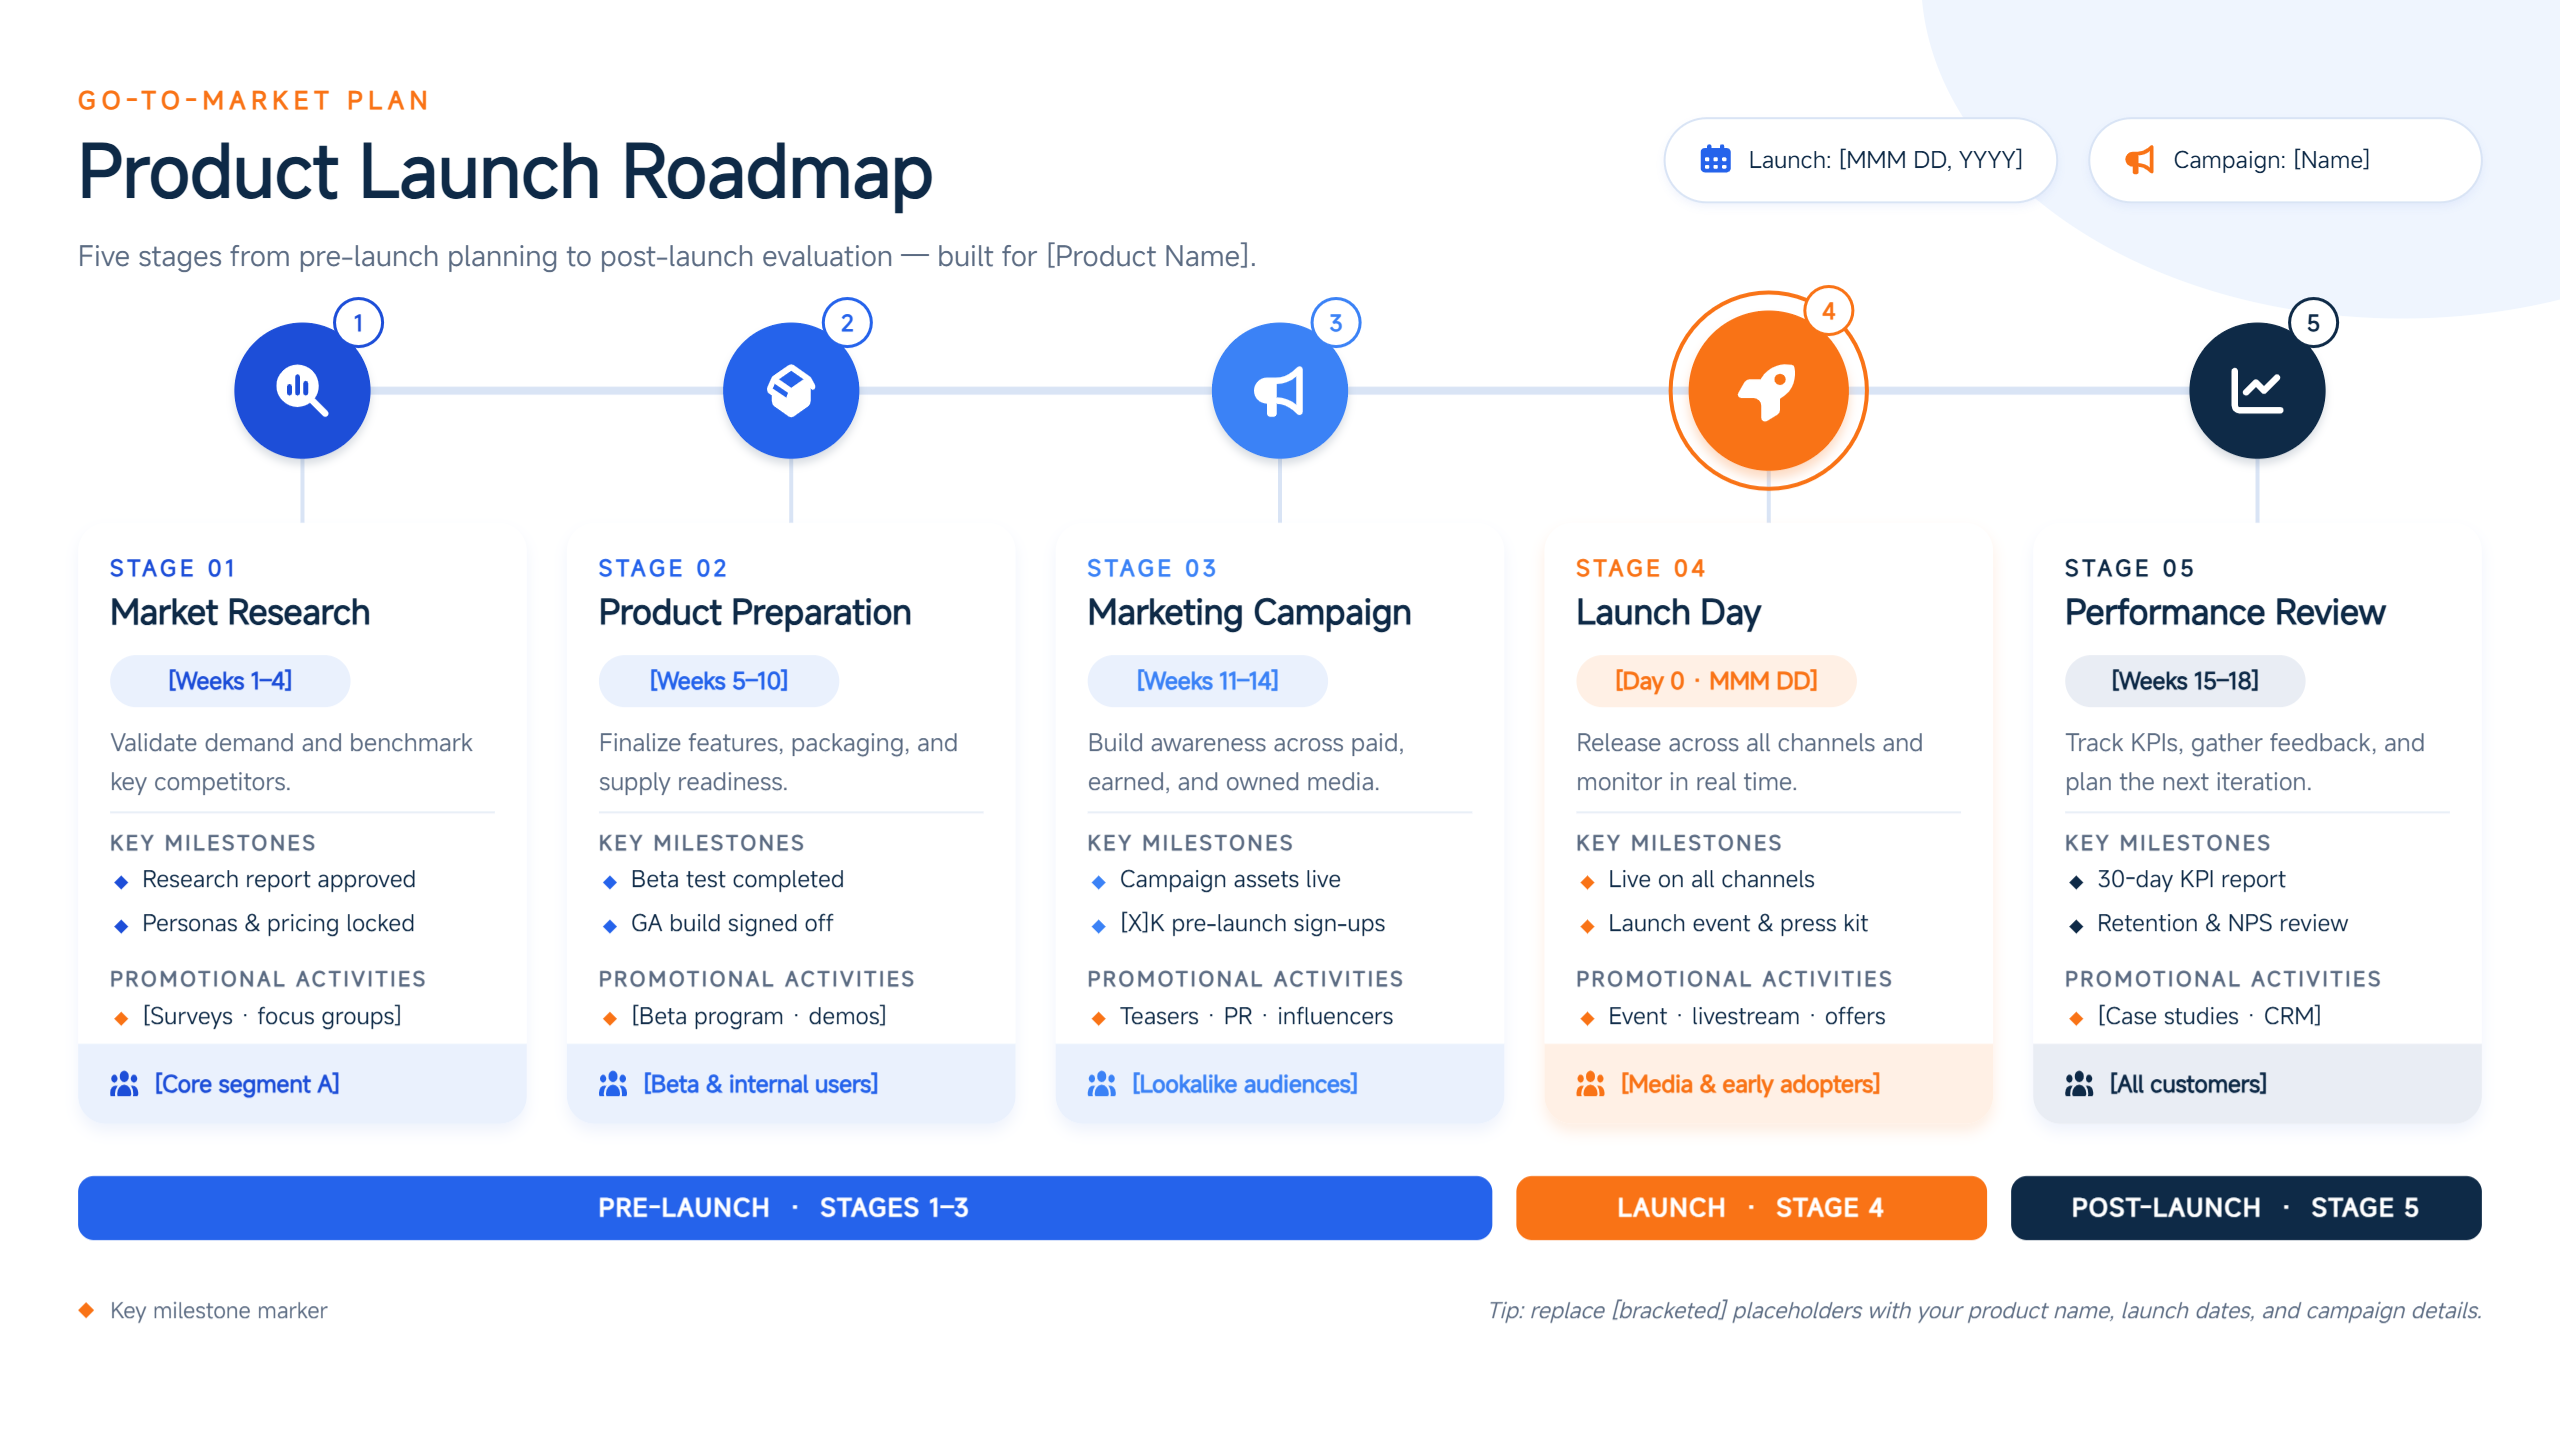
Product launch infographic
A successful product launch involves several activities, from introducing the product to building awareness and encouraging customers to take action. A product launch infographic brings these activities together in a visual timeline or roadmap. Use it to communicate launch dates, promotional campaigns, product benefits, and key milestones to your marketing team or stakeholders.
Prompt:
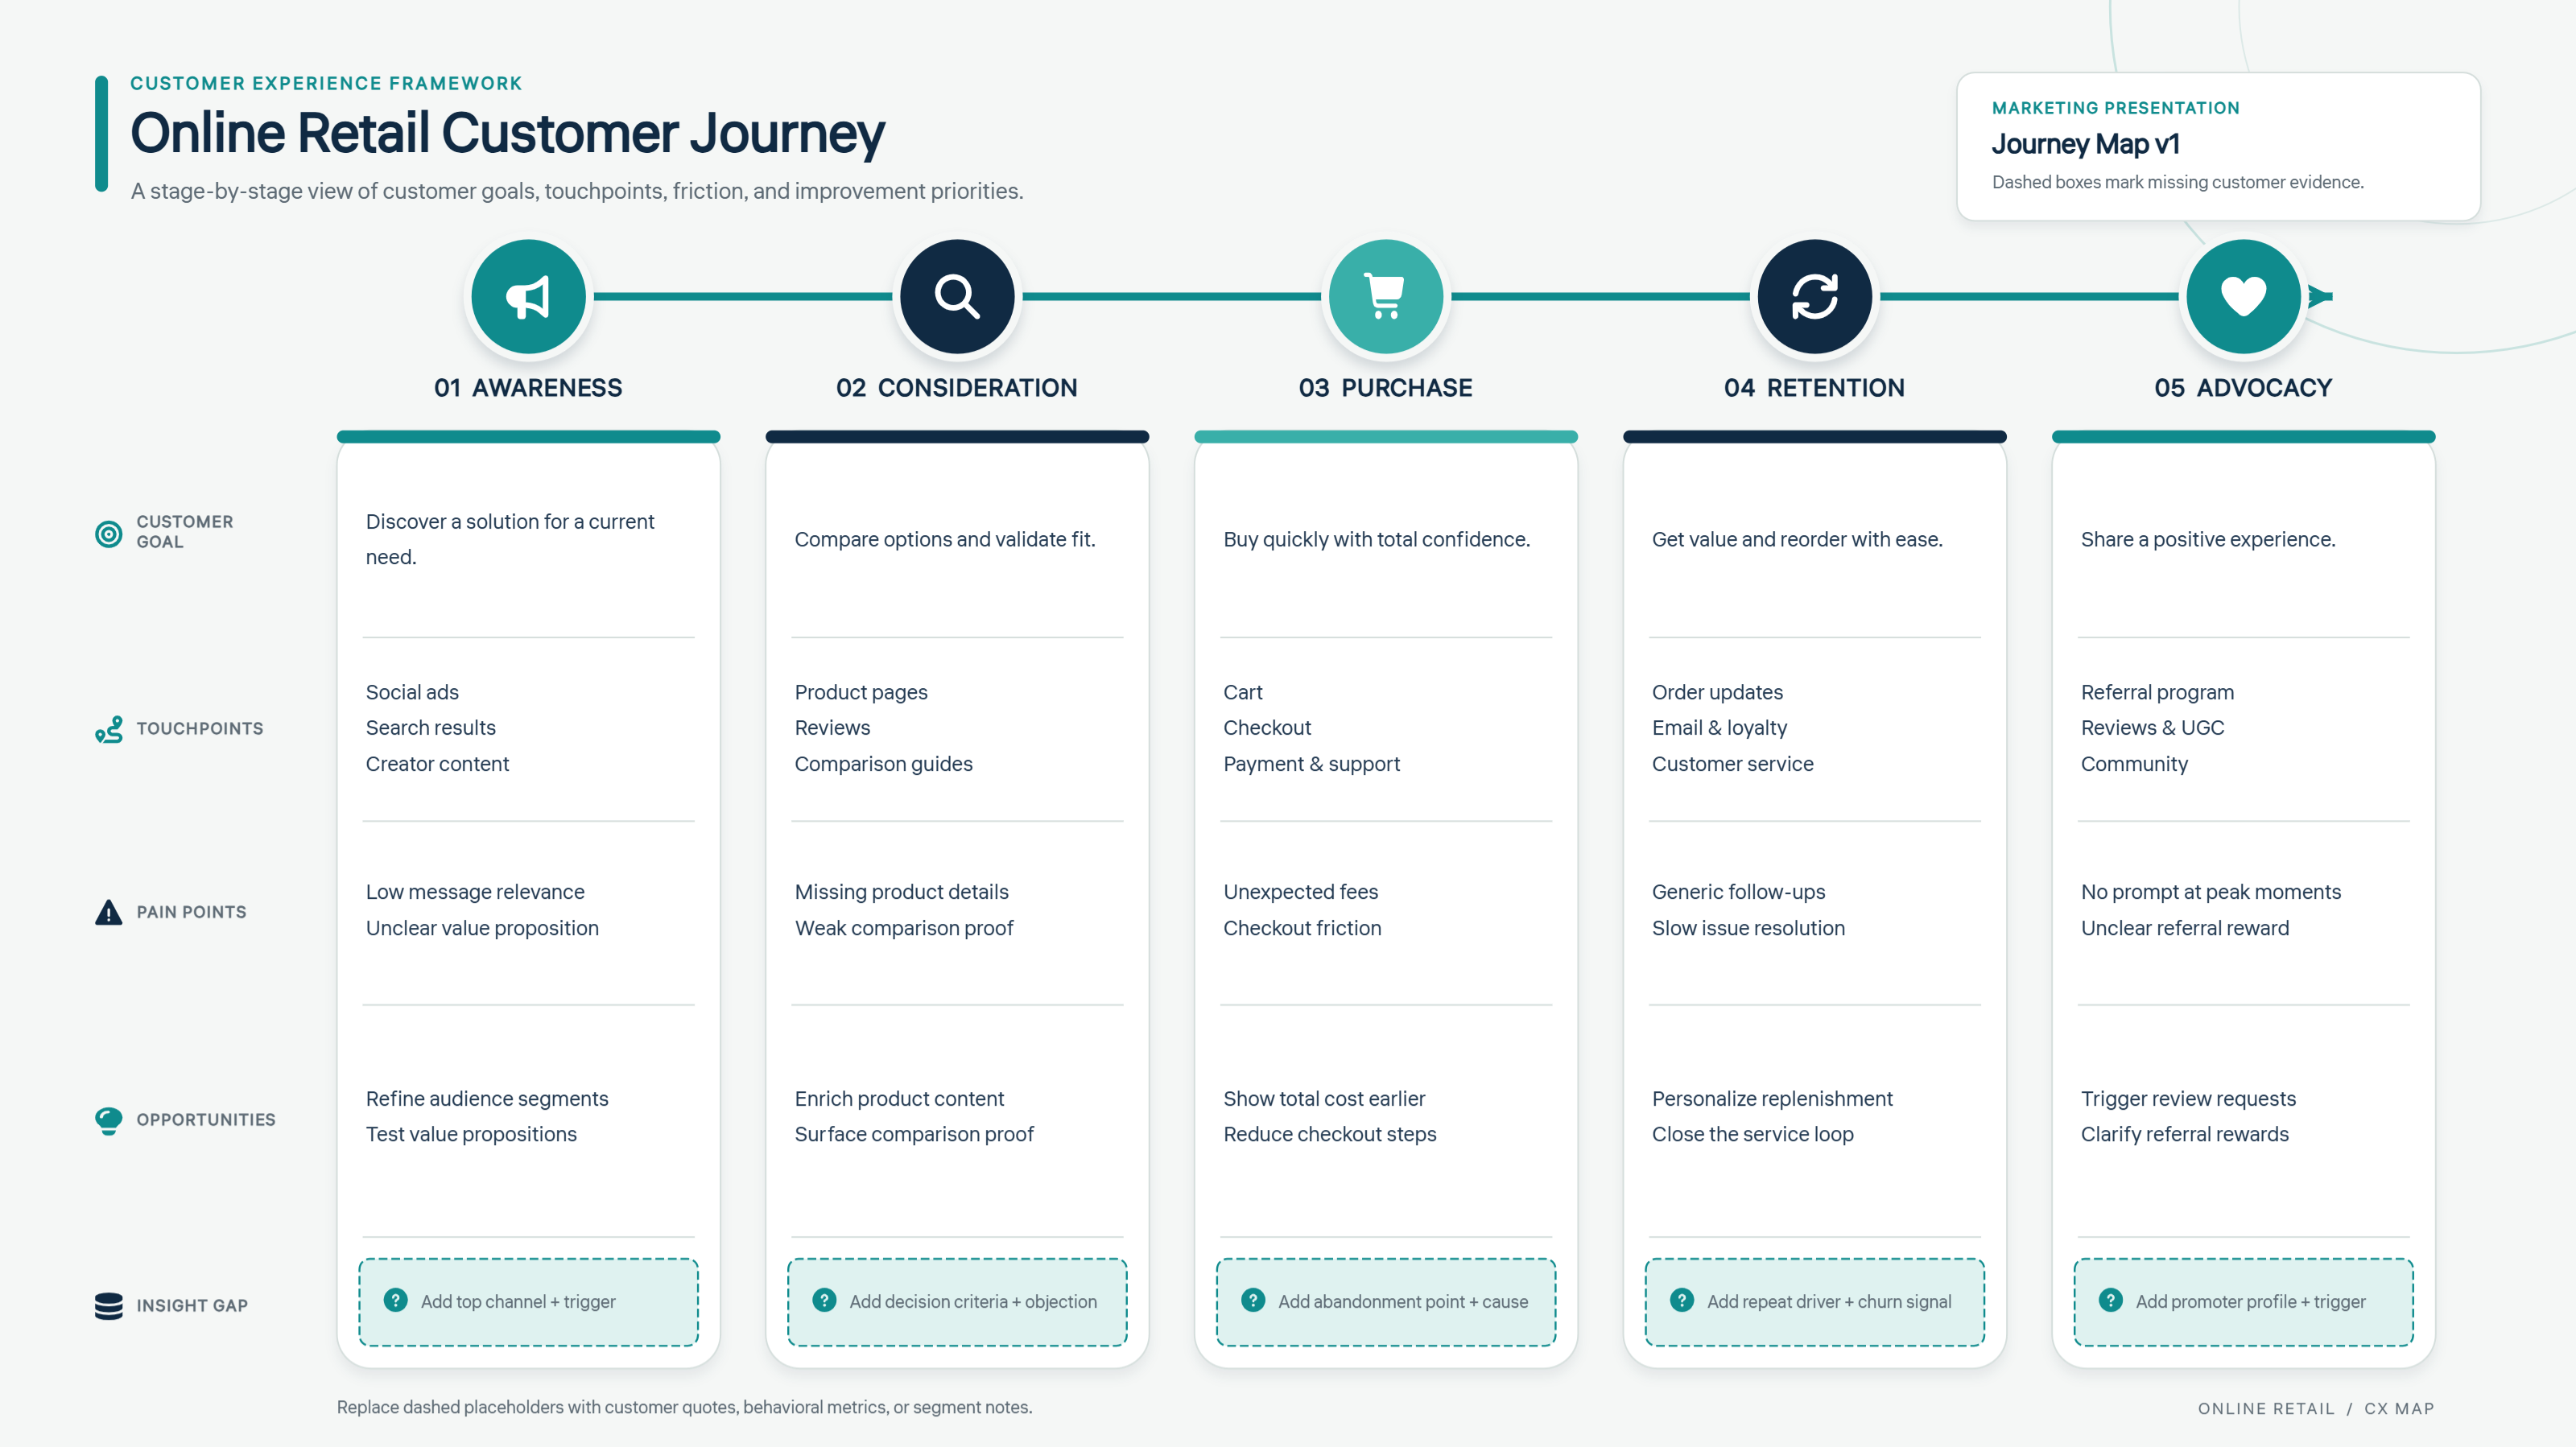
Customer journey infographic
Understanding the customer journey helps businesses identify what customers experience before, during, and after a purchase. A customer journey infographic maps these interactions, from discovering a product to evaluating it and becoming a repeat customer. It can help marketing and customer experience teams spot friction points, understand customer needs, and improve engagement at each stage.
Prompt:
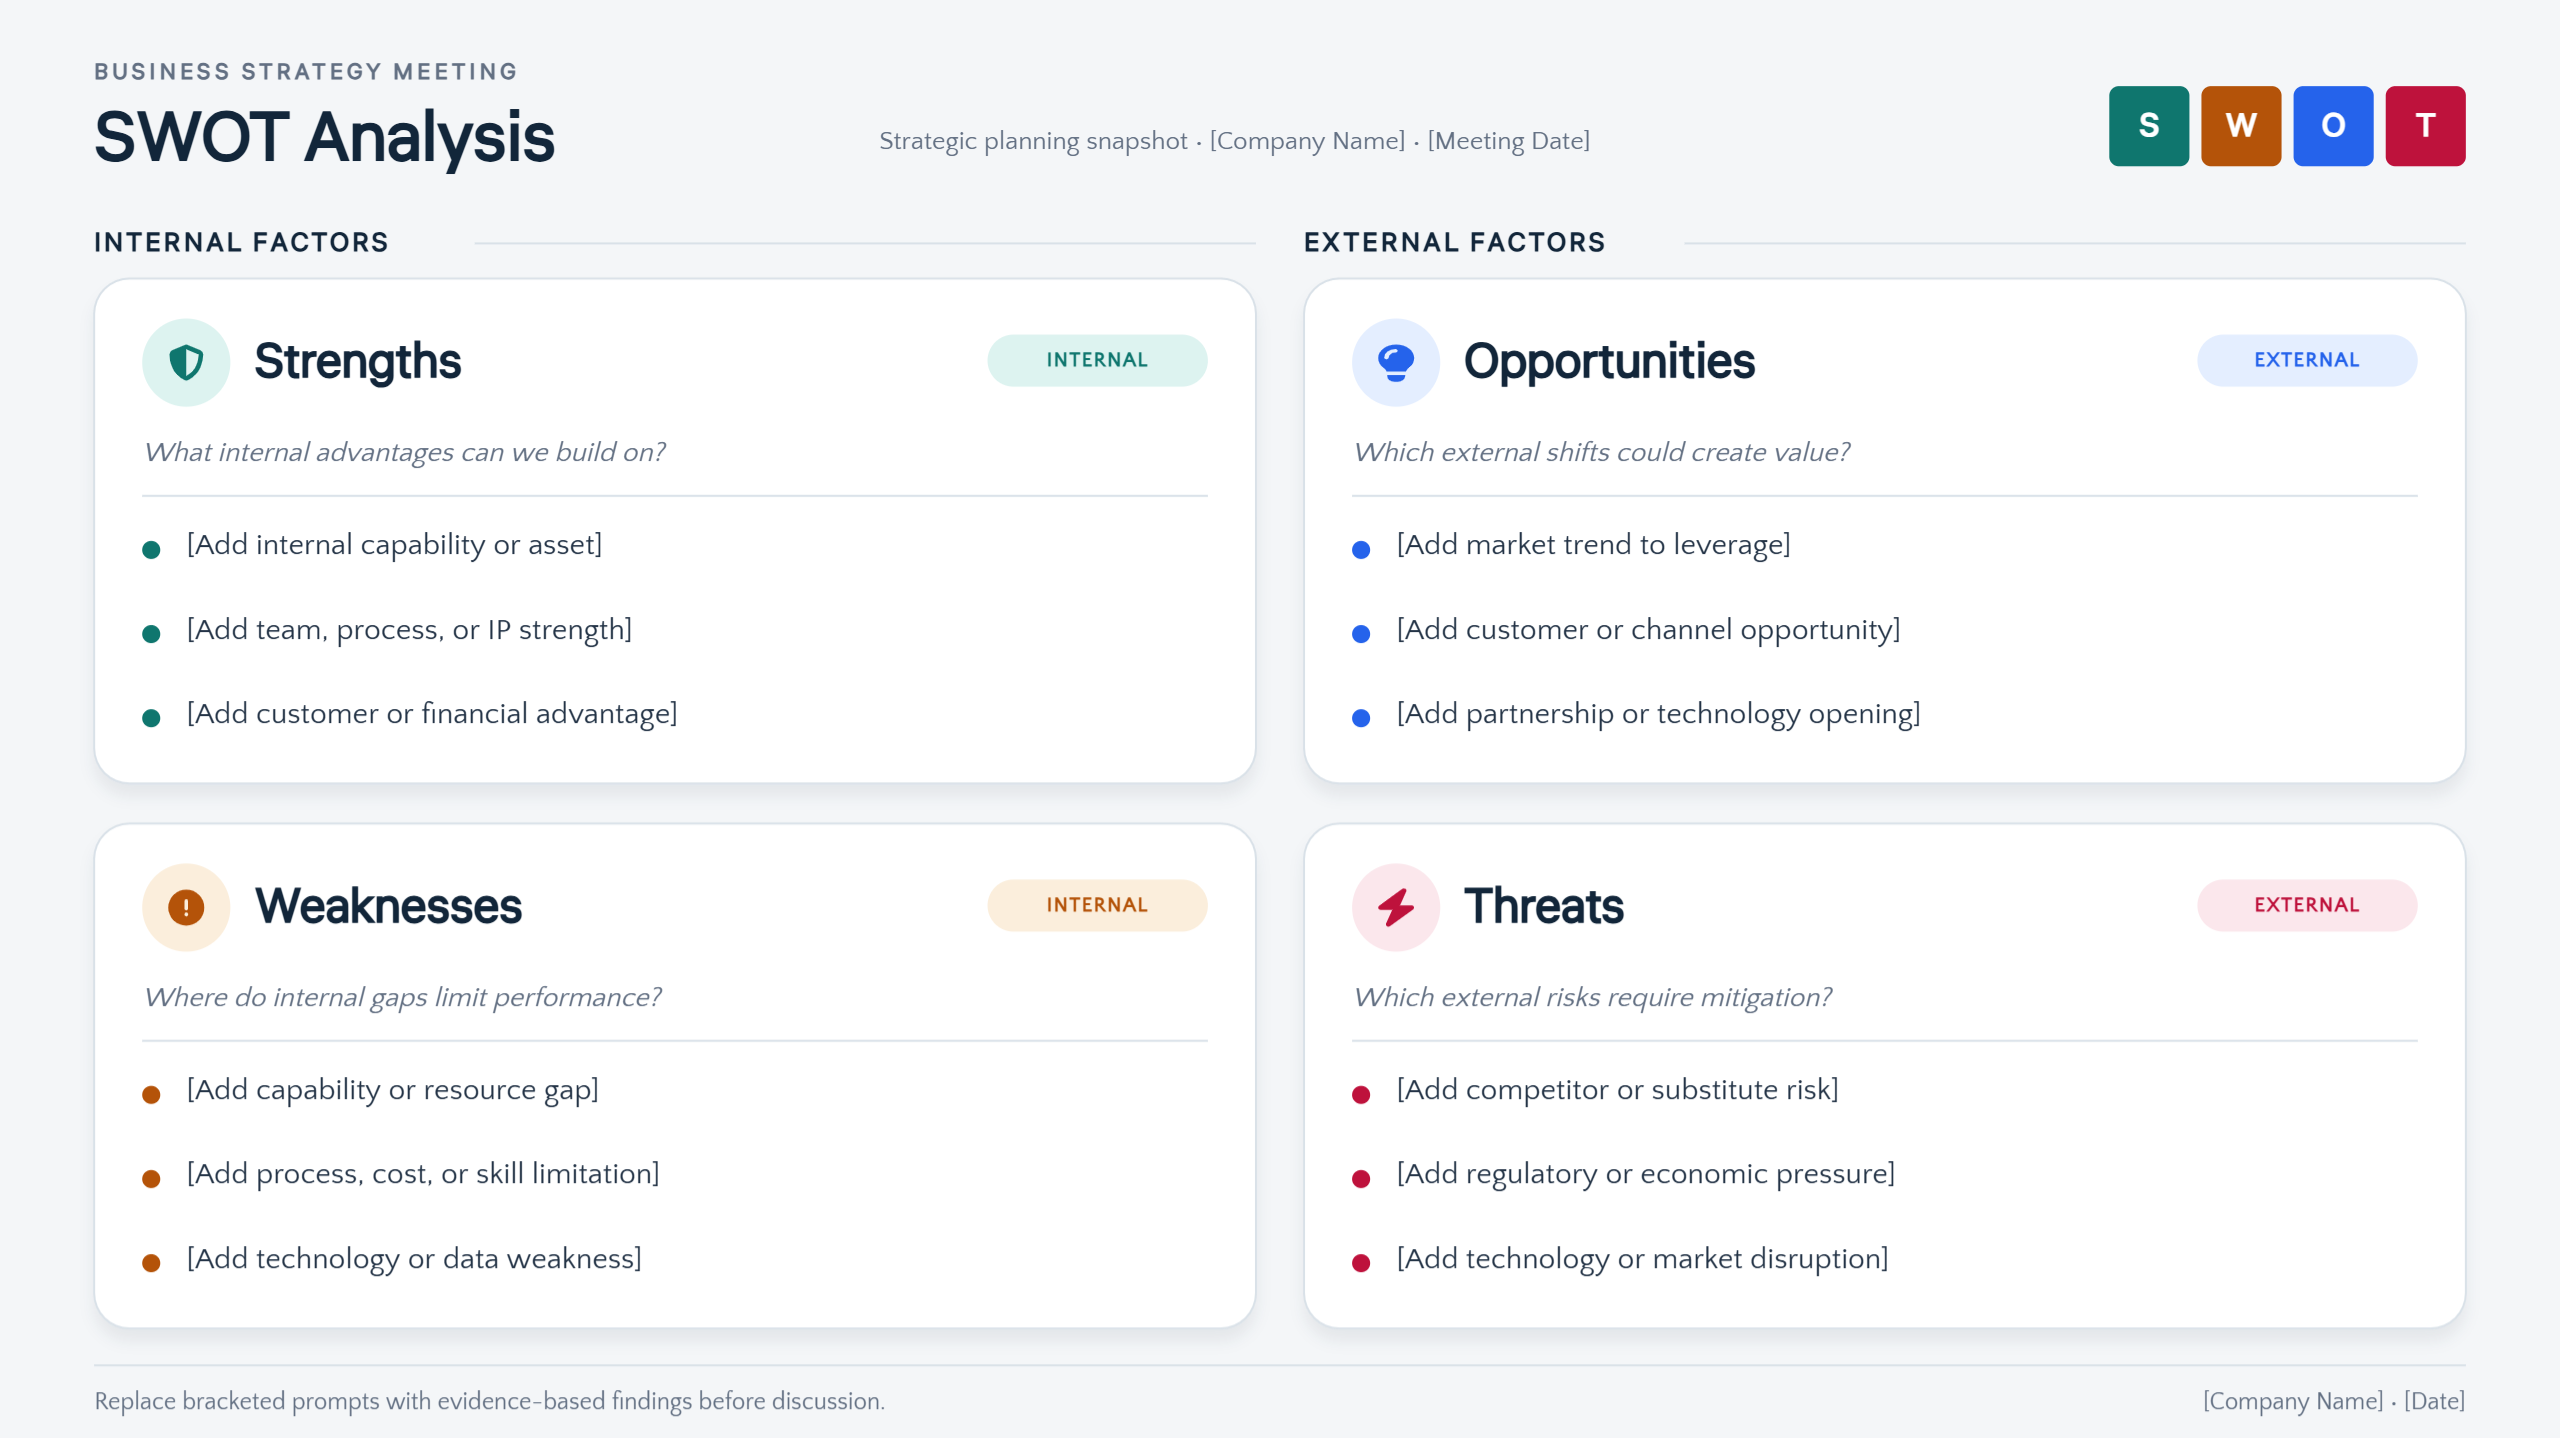
SWOT analysis infographic
A SWOT analysis helps businesses assess their internal strengths and weaknesses alongside external opportunities and threats. This infographic format organizes the four areas into a clear visual layout, helping teams review strategic insights and identify areas for improvement. It is useful for business planning, competitor analysis, project evaluations, and decision-making meetings.
Prompt:
Why use Kimi Design to create business infographics
In Kimi Design, the process to make a business infographic design can be simplified with AI-powered tools that turn your ideas and data into clear, visually appealing layouts. Here are the benefits of using Kimi Design.
Create business infographics from prompts and company data
Describe your business goals, key messages, or reporting needs in a text prompt, or upload documents, spreadsheets, and reference images. Kimi Design helps organize business information into a structured infographic, making important insights easier to understand and communicate.
Visualize business information for different needs
Create infographics for company overviews, sales performance, market research, project updates, business strategies, and team reports. Combine charts, icons, diagrams, and concise text to present key figures and ideas clearly to stakeholders.
Refine business infographics with flexible editing tools
Update text, colors, charts, layouts, and visual elements using natural-language prompts. Kimi Design also supports comments on specific elements and manual editing, helping you tailor each infographic to your brand guidelines and presentation goals.
Export business infographics for reports and presentations
Export finished designs in supported formats such as PNG, JPG, PDF, or PPTX. Add them to business presentations, internal reports, proposals, websites, and social media content to share information across teams and with clients.
Tips for designing business infographics
Effective business infographics require more than attractive visuals. Your infographic should present information clearly, guide readers through the main points, and make complex business data easier to understand. Follow these tips to create informative and professional infographics.
Start with one clear goal
Before creating your infographic, decide what you want your audience to learn, understand, or do after viewing it. Your goal could be explaining a business process, presenting sales results, or comparing market trends. A clear purpose helps you select relevant information and keep the design focused.
Use a simple visual hierarchy
Organize your infographic so readers can quickly identify the main heading, supporting points, and important details. Use different font sizes, bold headings, spacing, and visual elements to establish a natural reading order. A clear hierarchy guides the audience through information without making the design feel crowded or confusing.
Keep text short and easy to scan
Avoid long paragraphs and unnecessary explanations that make your infographic difficult to read. Use short sentences, descriptive headings, bullet points, and simple language to communicate your message efficiently. Focus on the most useful information so readers can understand the main ideas without spending too much time on each section.
Choose charts that fit your data
Select chart types based on the information you want to communicate rather than choosing them for appearance alone. Bar charts work well for comparing sales figures, line charts show changes over time, and pie charts can illustrate simple proportions. Choosing the right visualization helps readers understand business data, recognize patterns, and compare results accurately.
Stick to your brand colors and fonts
Use colors, fonts, and design elements that match your company's existing brand identity. Limit your palette to a few complementary colors and choose readable fonts that work well for headings and body text. Consistent styling makes your infographic look professional, strengthens brand recognition, and creates a unified visual experience.
Highlight key numbers and insights clearly
Draw attention to important figures, percentages, performance metrics, and findings that support your main message. Use bold typography, contrasting colors, icons, or callout boxes to make these details stand out without overwhelming the overall design. Highlighting meaningful insights helps readers identify important results quickly and understand what the data means for the business.
Conclusion
To sum up, good business infographics combine a clear purpose, relevant information, and a layout that suits your audience. Choose a design that supports your goal, keep the content easy to scan, and highlight the insights that matter most. With Kimi Design, you can turn text prompts and business information into visual layouts, then refine them for your needs.