Presenting information in a visual format makes it easier to understand, but designing an effective infographic can be difficult without the right skills. From organizing data to choosing layouts and colors, the process can be overwhelming. AI-powered tools offer a simpler way to create infographics without starting from scratch. In this guide, you'll learn how to turn your ideas and information into clear, engaging visuals with minimal design effort.
What should an infographic include
Before learning how to build an infographic, it is important to understand the elements that make it clear, engaging, and easy to follow. Include these essentials to communicate your message effectively.
A clear, catchy title
Choose a short, descriptive title that tells readers what the infographic is about. A strong heading attracts attention and helps readers understand the main topic at a glance.
One focused core message
Keep your infographic centered on one main idea instead of covering too many topics. A focused message helps readers understand the purpose of your design and remember the key takeaway.
Accurate, relevant data
Use reliable statistics, facts, and examples that support your main message. Select only the most relevant information to make an infographic informative without overwhelming your audience.
Simple icons and visuals
Use charts, icons, and illustrations to present complex information in an easy-to-understand format. Consistent colors and a clean layout help you make an infographic that readers can scan quickly.
Credible sources
Include references for statistics, research findings, and other factual claims. Citing trustworthy sources strengthens your infographic's credibility and allows readers to verify the information.
How to create an infographic with AI
Once you have your information ready, the next step is turning it into a clear, visually appealing design. AI tools simplify the process, even if you have no prior design experience.
Kimi Design, an AI design generator, makes it easier to create infographics using simple text prompts. Describe your topic, key information, preferred layout, and visual style to generate an infographic design. You can explore different layouts and visual elements without creating everything manually. Then, refine the result to better match your content and presentation needs. Here is how to create an infographic step by step using Kimi Design.
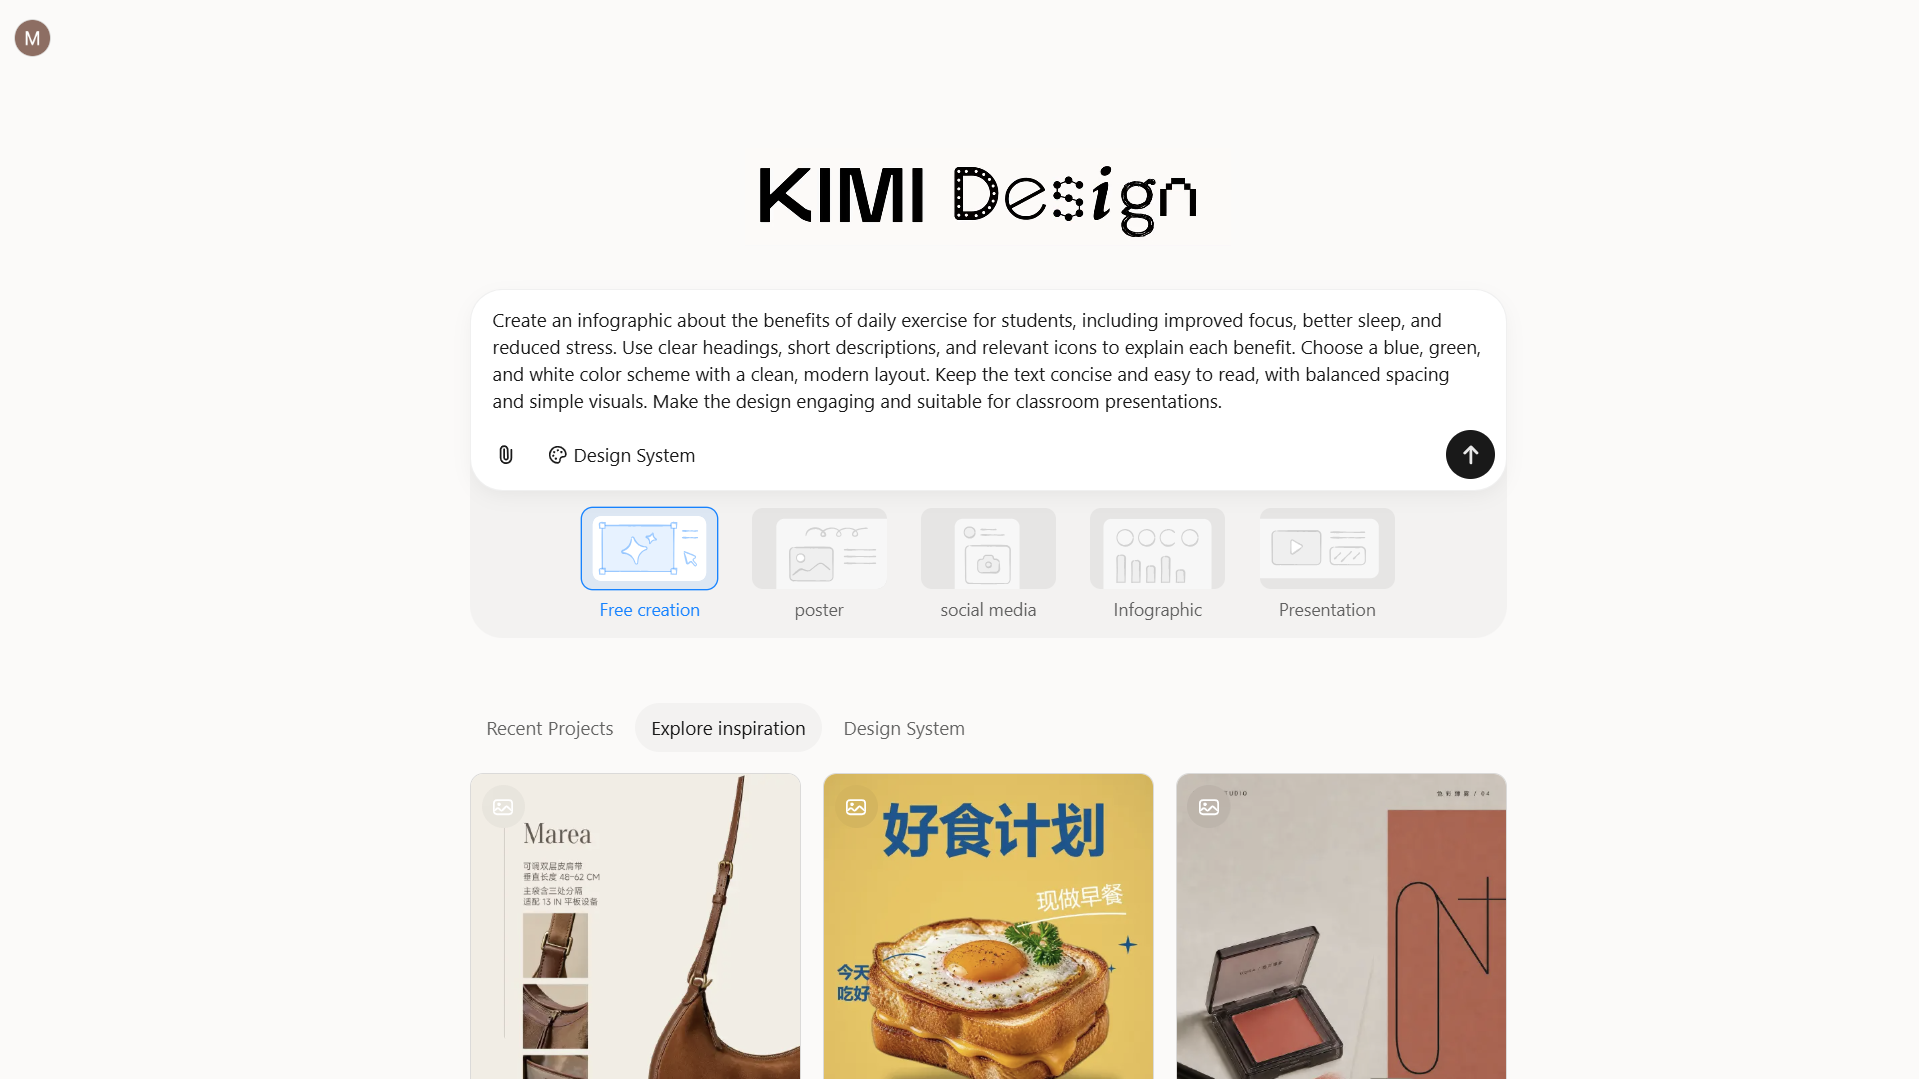
Step 1: Write a prompt for your infographic
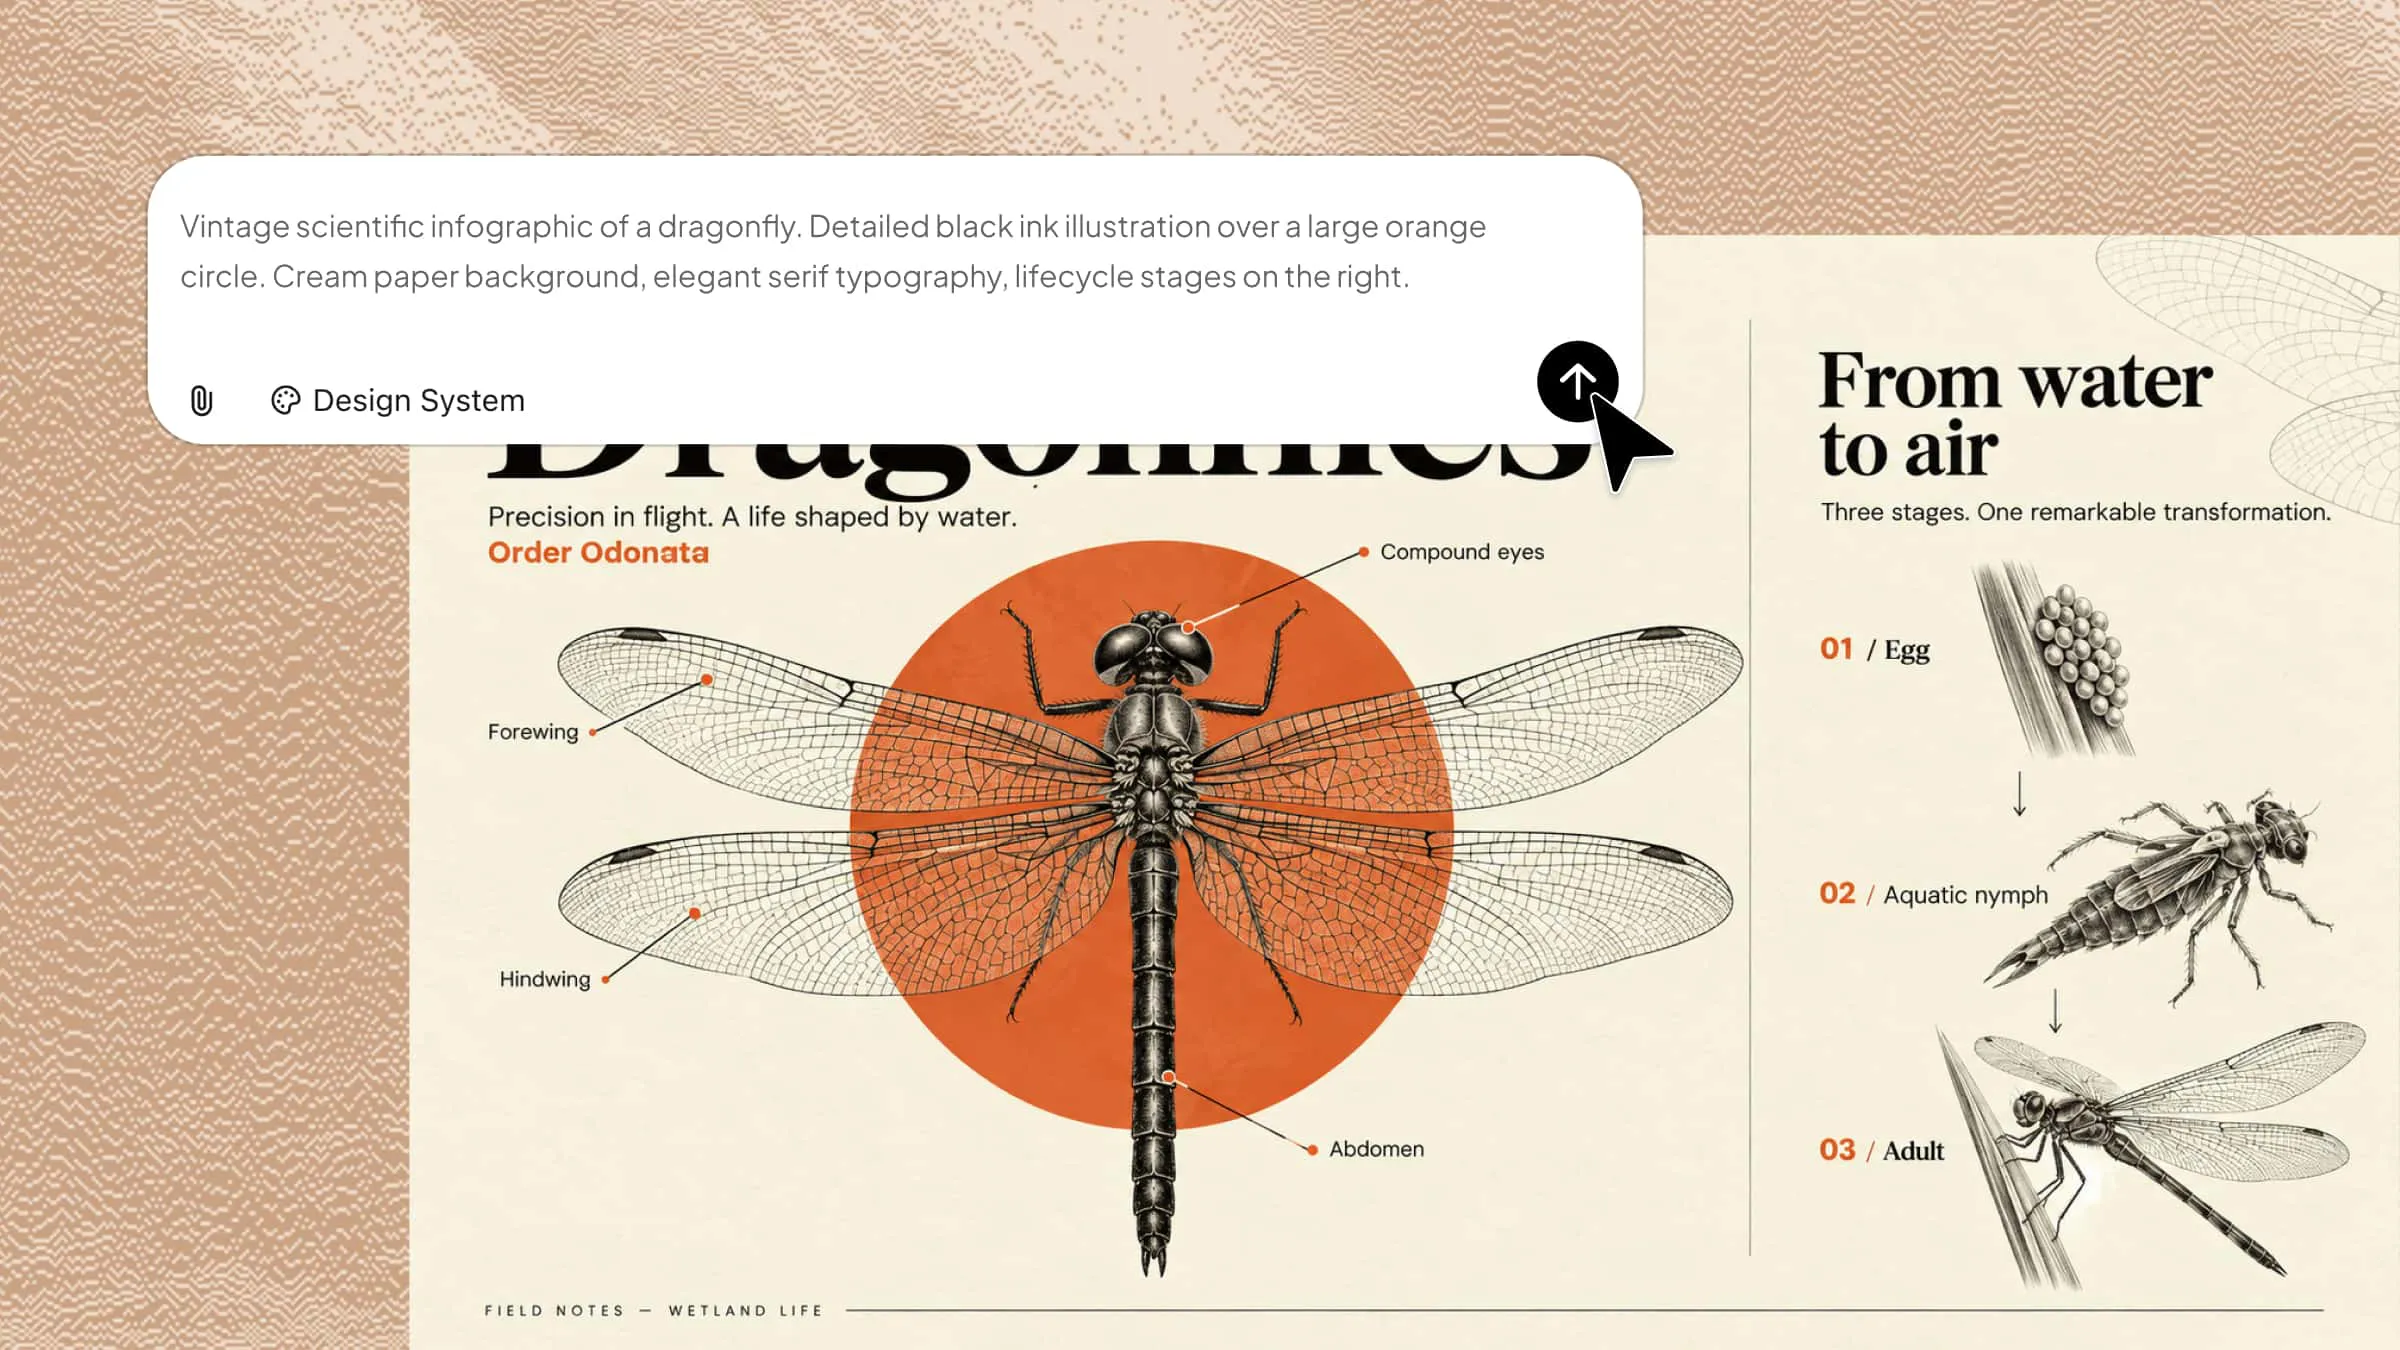
Describe your topic, target audience, key information, preferred layout, colors, and visual style. A clear prompt helps AI generate an infographic that matches your purpose. It also helps to name the infographic type in your prompt, such as a timeline, comparison, or process layout, so the AI can match the structure to your content on the first try.
Example prompt:
Step 2: Generate the infographic with Kimi Design
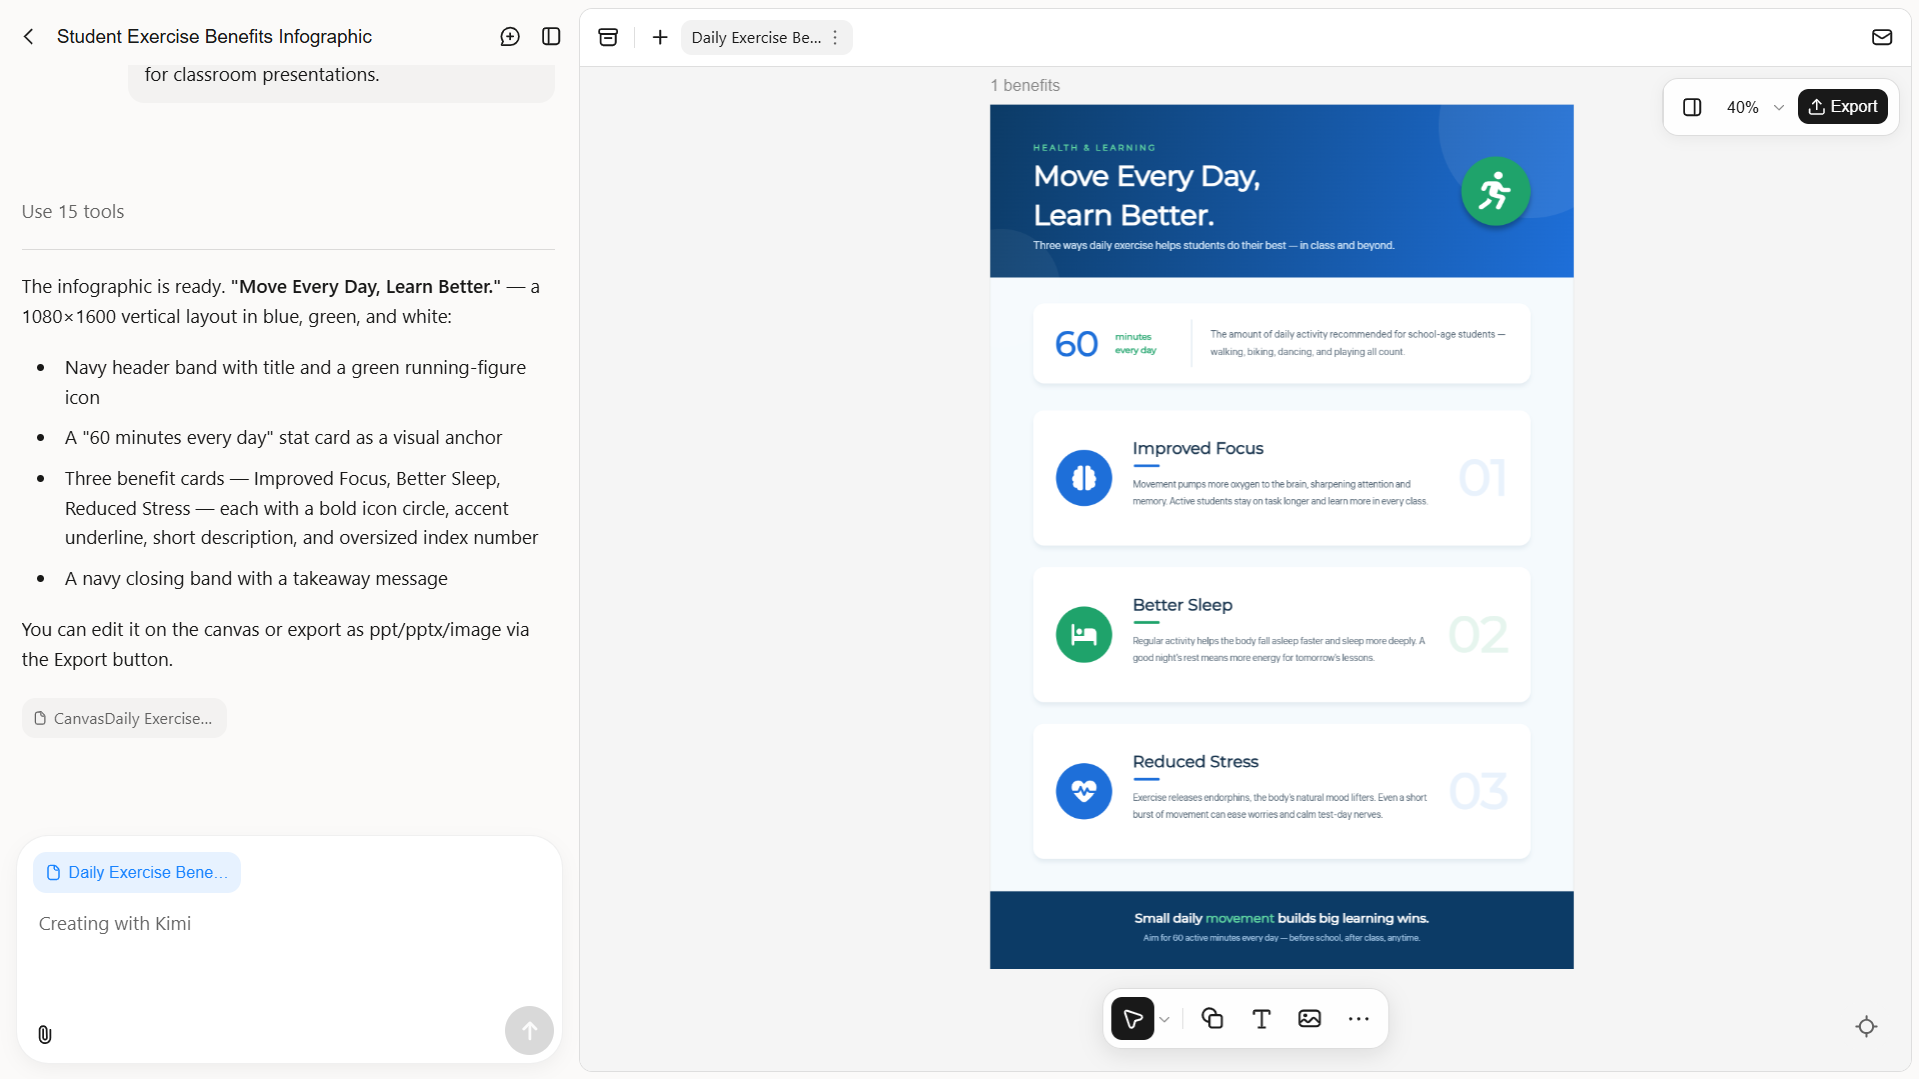
Enter your prompt in Kimi Design and generate the infographic. Review the result to check whether it includes the requested information, suitable visuals, and a clear layout.
Step 3: Edit and refine the design
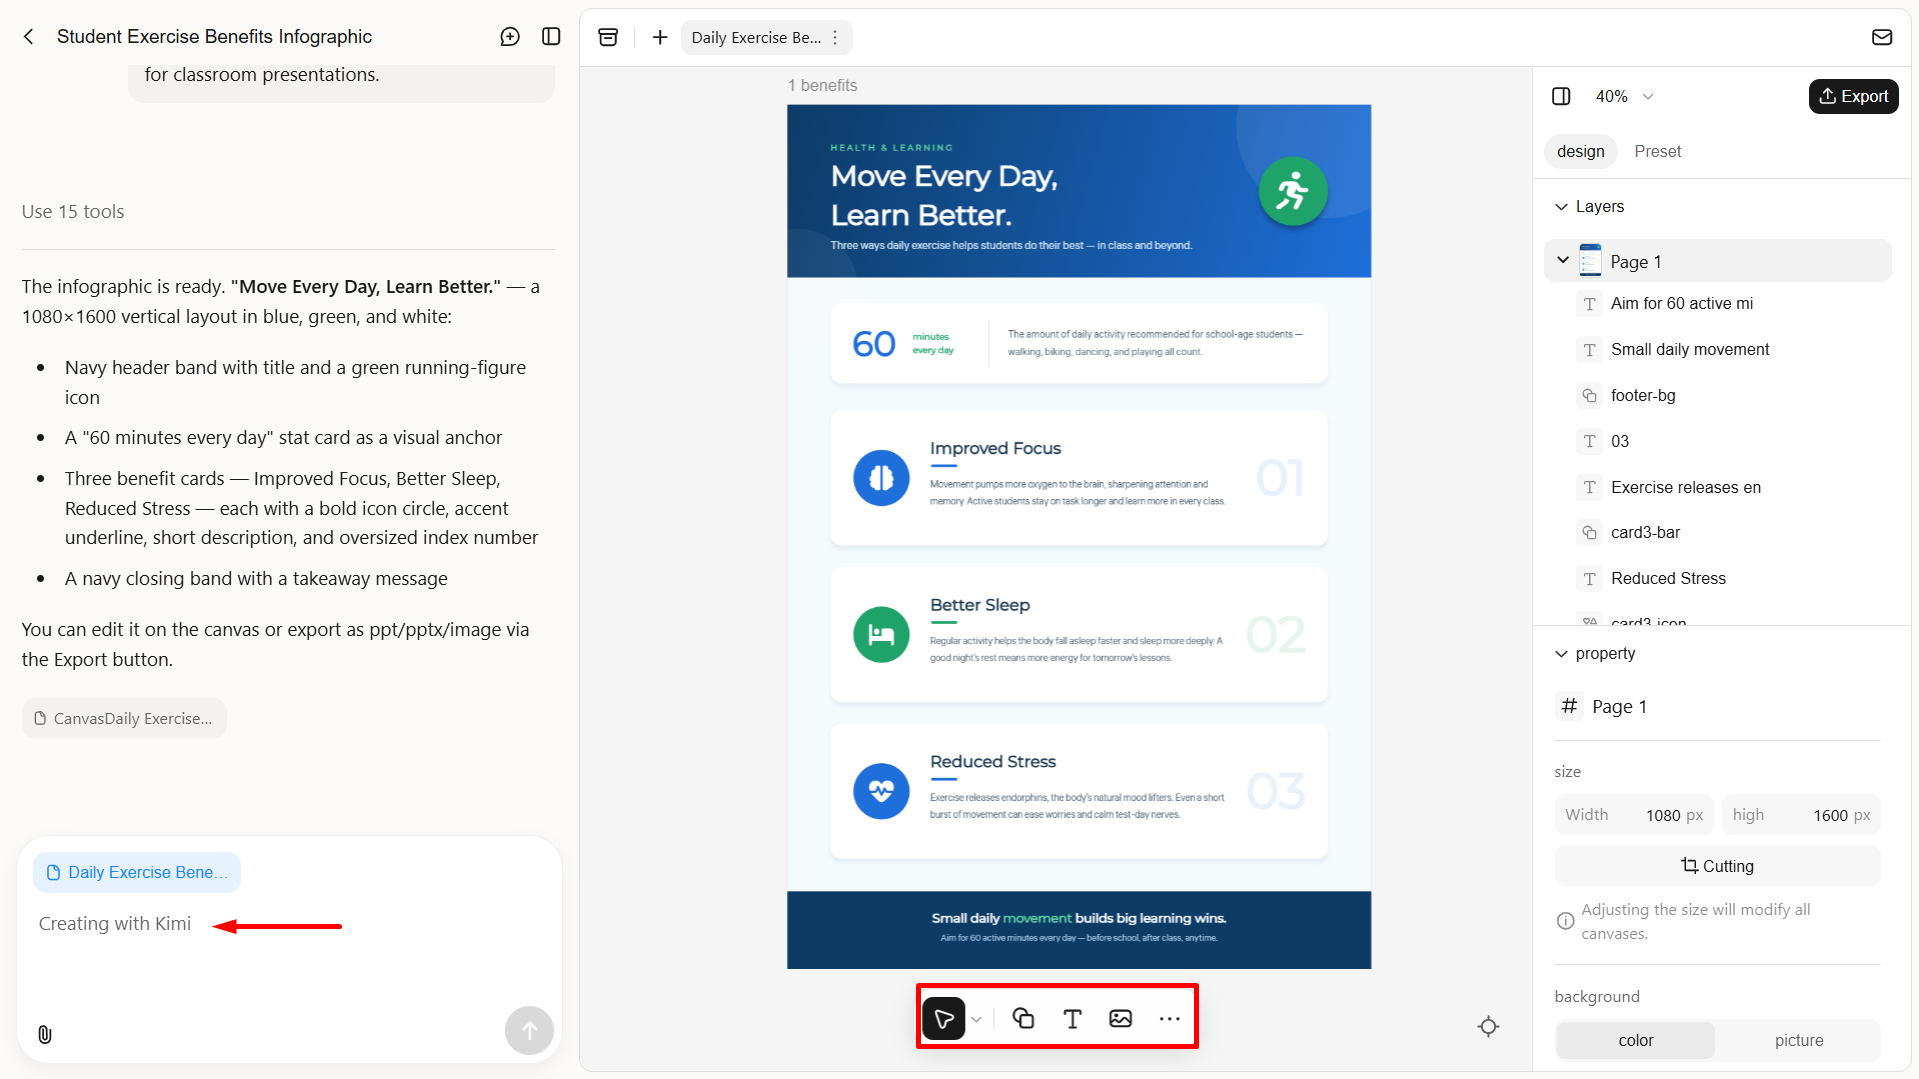
Review the generated infographic and make manual adjustments to the text, colors, and layout to suit your needs. You can also update your prompt or add comments to specific elements to request changes. Refine the design to improve readability and ensure the information is organized clearly.
Step 4: Preview and export your infographic
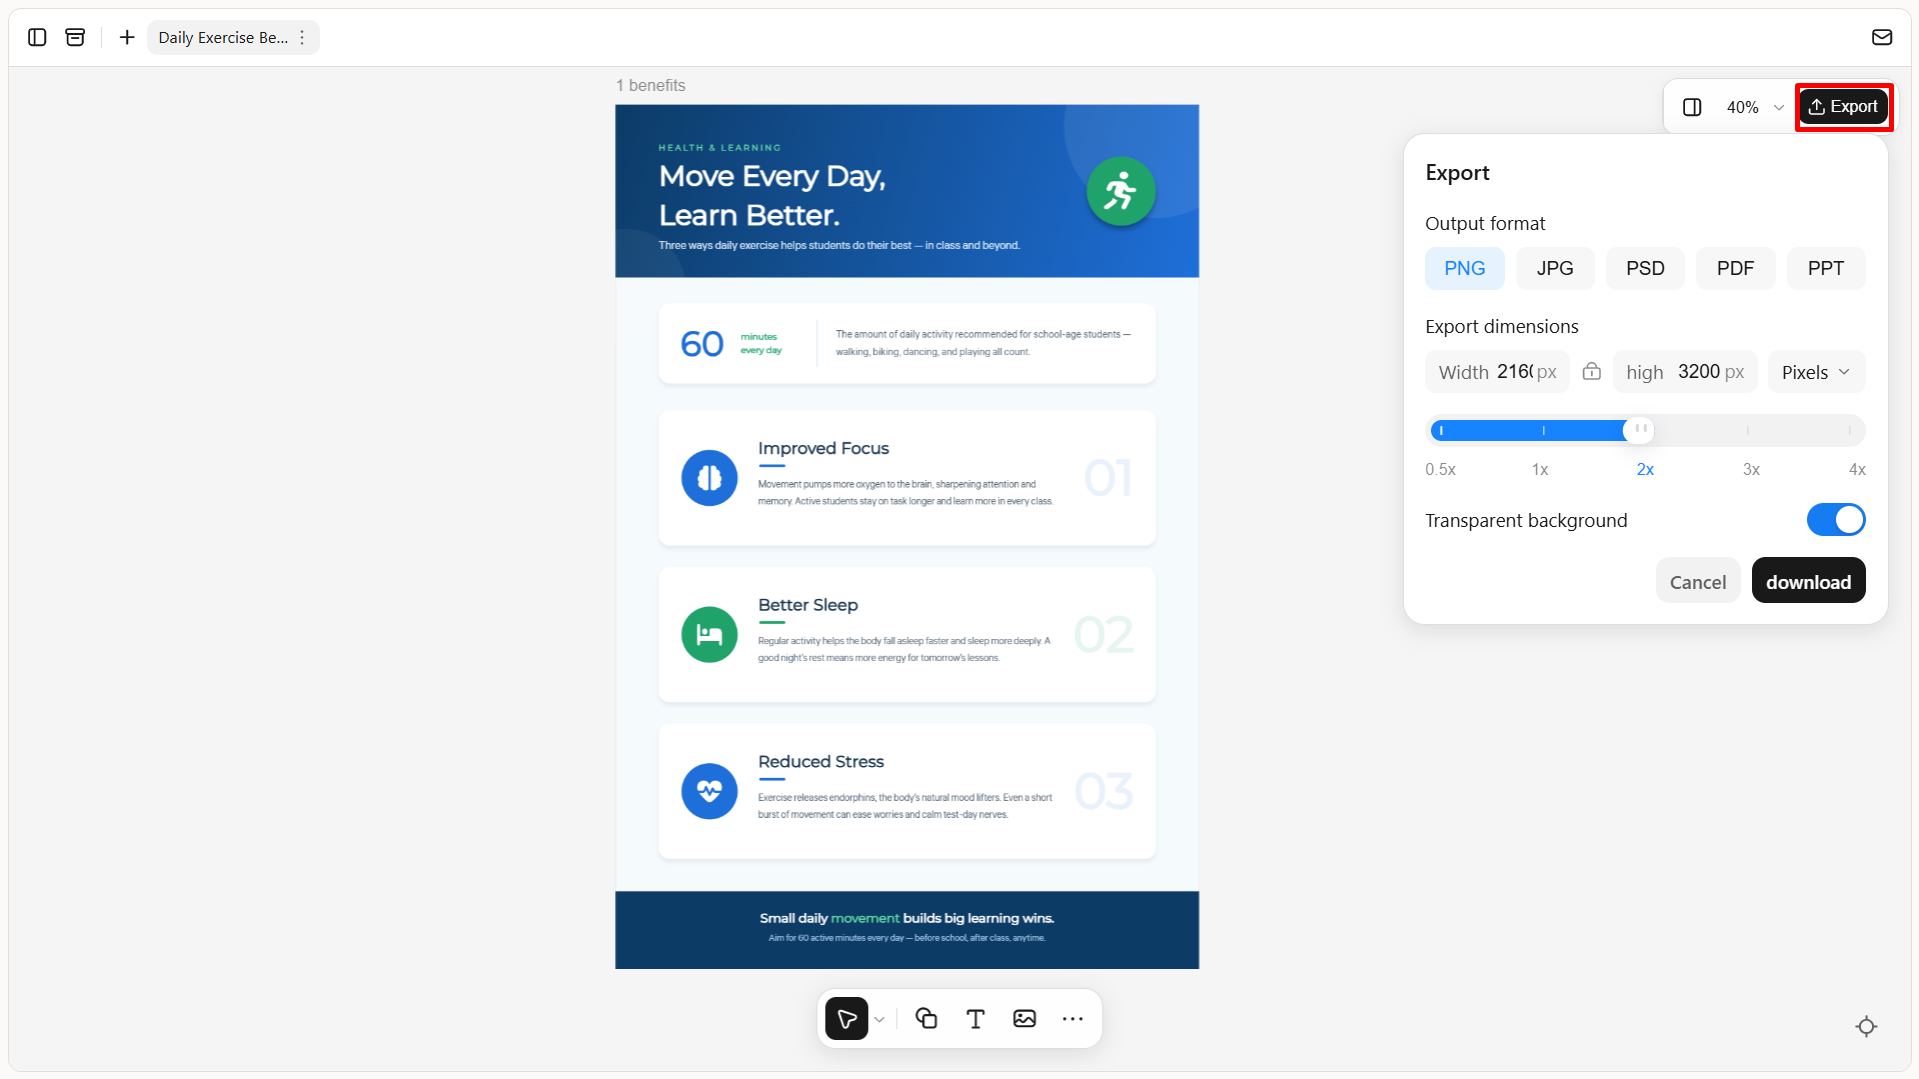
Preview the final infographic to check for spelling errors, inconsistent spacing, and missing details. Once everything looks right, export it in a suitable format, such as PNG, JPG, PDF or PPT, depending on your intended use, whether for presentations, social media, or educational materials.
Why make an infographic with Kimi Design
AI tools make it easier to organize information and create engaging visuals without advanced design skills, and Kimi Design helps turn your ideas into clear, visually appealing designs with simple prompts. Here is why using Kimi Design can make the process easier.
Infographics from prompts, documents, and reference images
Describe your topic, audience, and key message in a text prompt, or upload documents, spreadsheets, and reference images to provide context. Kimi Design turns your input into a visually organized infographic with clear headings, relevant graphics, and a coherent layout.
Icons, charts, and layouts matched to your content type
Create infographics for educational topics, business reports, marketing campaigns, product features, and data summaries. Use illustrations, icons, charts, and different layout styles to present information in a way that suits your message and audience.
Element-level refinement: prompts, comments, or manual editing
Revise text, colors, layouts, and graphic elements through natural-language prompts. Kimi Design also supports comments on specific elements and manual editing, so you can fine-tune individual details and keep your infographic aligned with your needs.
Multi-format export for presentations, print, and social media
Download your finished design in supported formats such as PNG, JPG, PDF, or PPTX. Use it in presentations, reports, websites, social media posts, and educational materials, and your design stays editable in Kimi Design whenever you need updates.
Tips for creating a great infographic
A well-designed infographic presents information clearly while keeping readers interested. When you want to make an infographic, follow these tips to balance visuals, text, and data for an effective result.
Focus on one core message
Build your infographic around a single main idea to avoid overwhelming readers with too much information. A focused message helps your audience understand the key takeaway quickly.
Use a clear visual hierarchy
Arrange the title, headings, key statistics, and supporting details in a logical order. Use size, spacing, and contrast to guide readers through the infographic naturally.
Stick to two or three colors
Choose two or three complementary colors that suit your topic and maintain a consistent look. A limited palette keeps the design organized and makes it easier to create infographics that look professional.
Keep text short and scannable
Use brief sentences, bullet points, and key statistics instead of long paragraphs. Concise text makes your infographic easier to read and helps readers find important information quickly.
Choose readable, consistent fonts
Use one or two fonts throughout the design and make sure the text is readable in different sizes. Clear typography helps distinguish headings from supporting information without making the layout look cluttered.
Add credible data sources
Support statistics and factual claims with reliable sources, such as research papers, official reports, or trusted websites. Include citations where appropriate to strengthen your infographic's accuracy and credibility.
Design for mobile viewing
Keep text readable, visuals clear, and sections well spaced, so the infographic works on smaller screens. Preview your design on a mobile device before sharing it online.
Conclusion
Creating an infographic doesn't require advanced design skills when you have the right tools and a clear plan. By organizing your information, choosing suitable visuals, and following simple design principles, you can make informative and engaging infographics easily. Kimi Design further simplifies the process with AI-powered generation, helping you turn your ideas into attractive visuals with less manual effort.