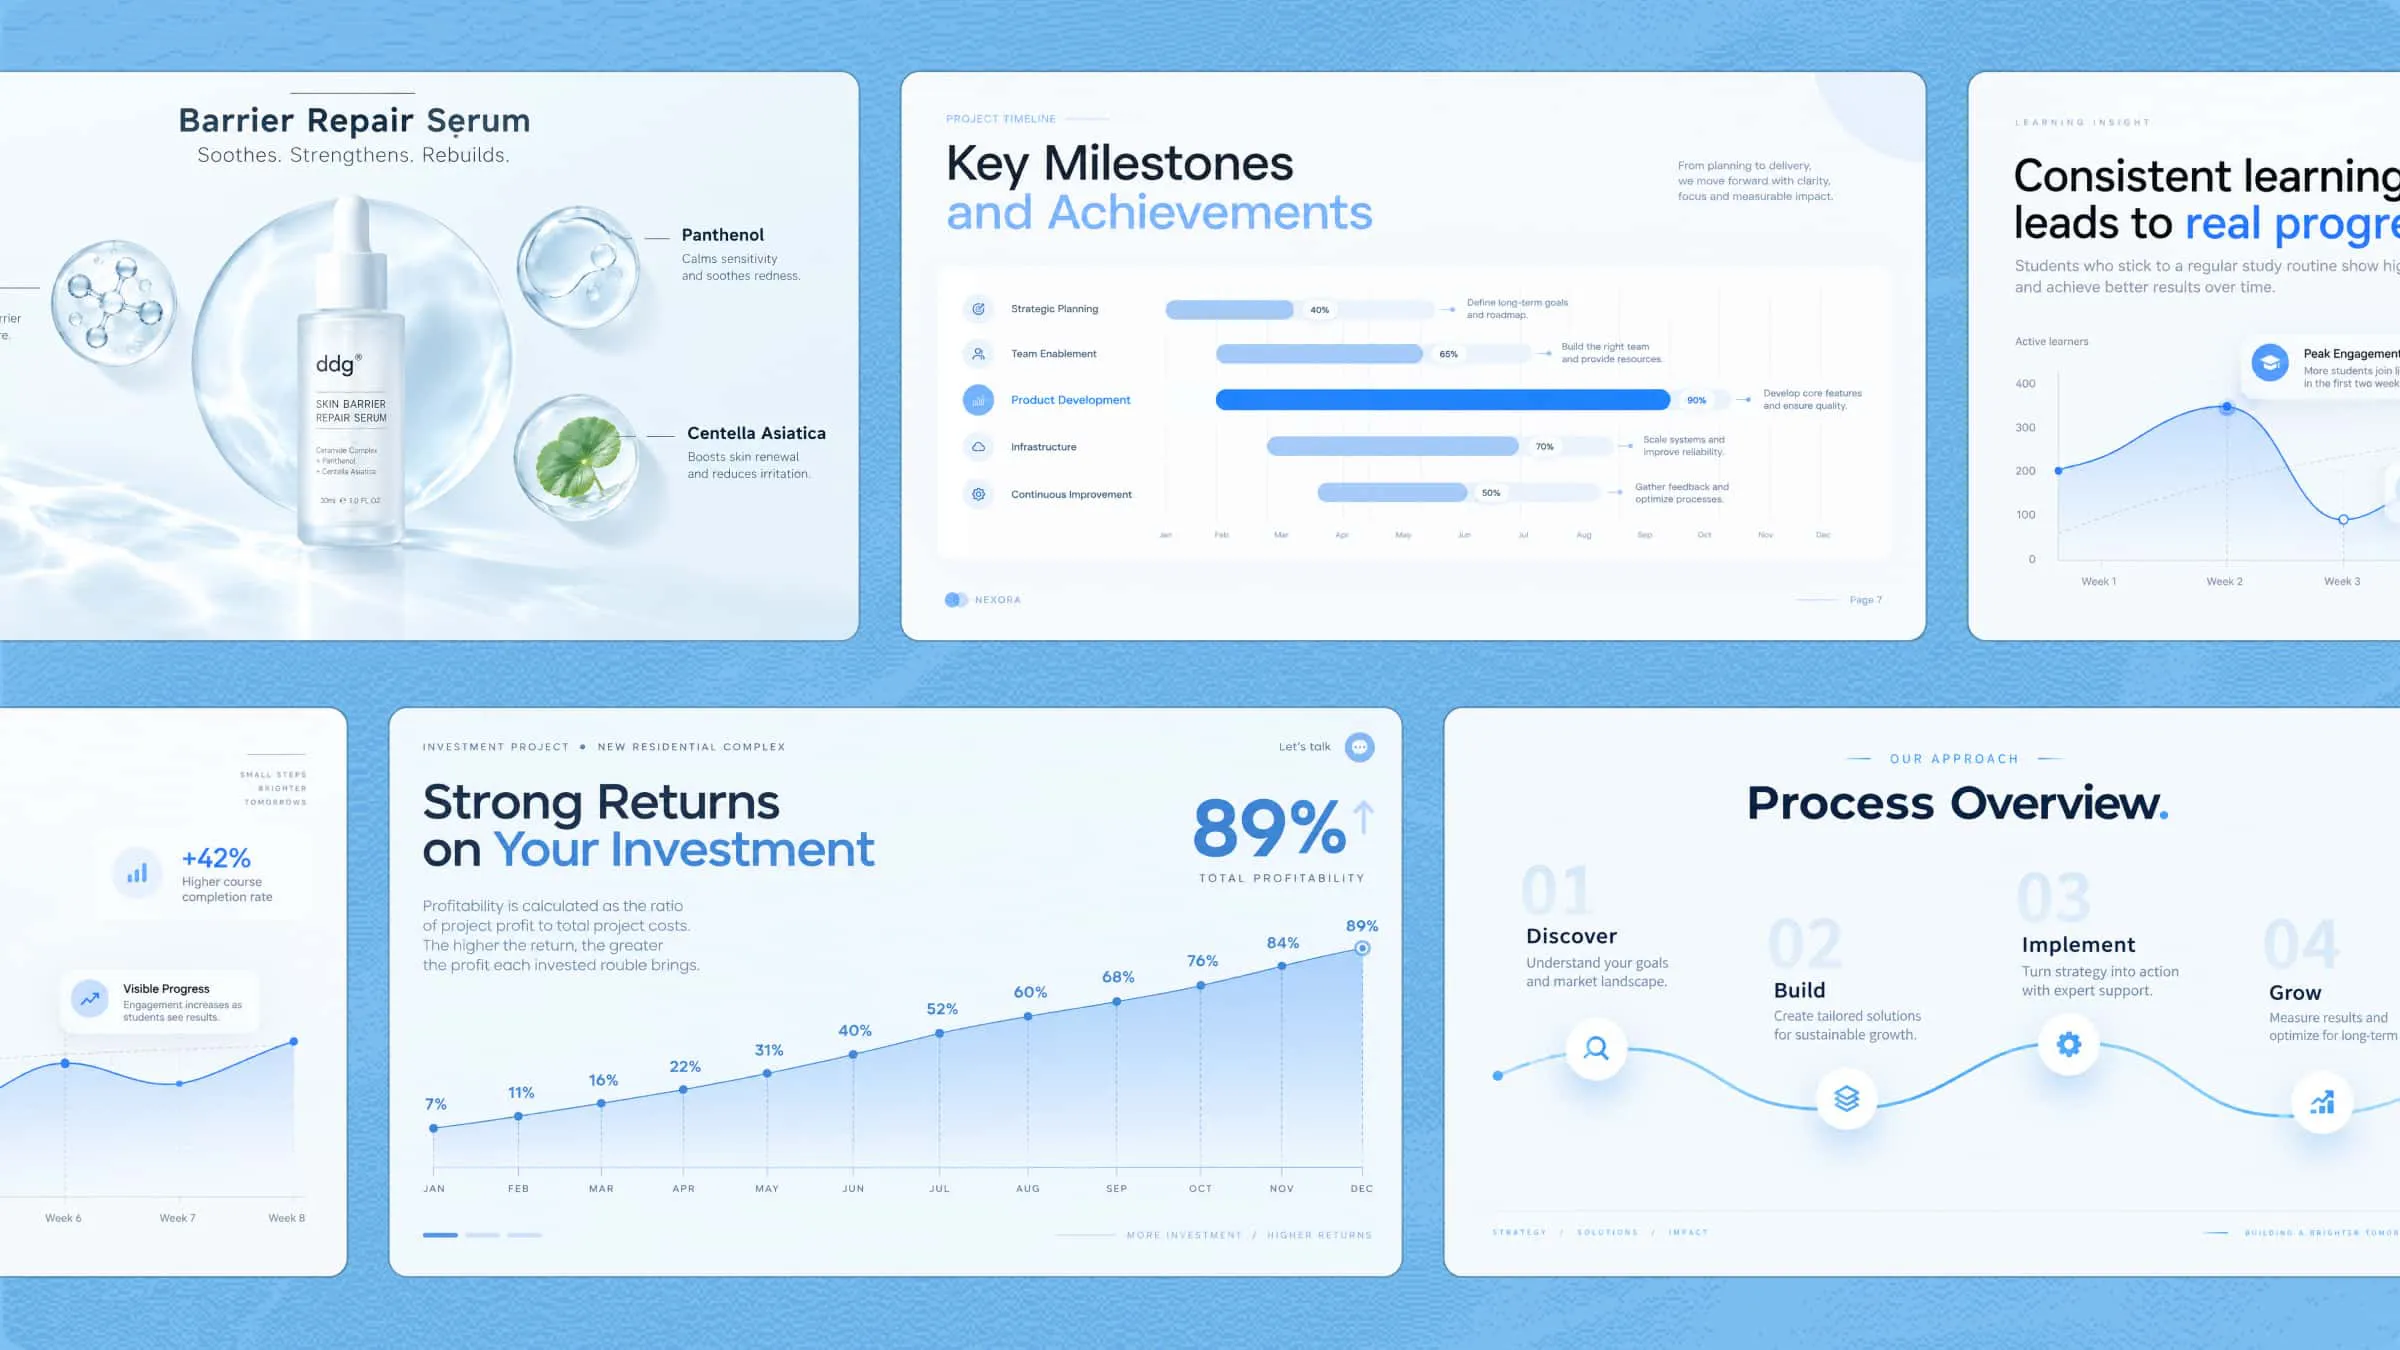
Finding the right infographic template can be challenging when you need to present information clearly without spending hours designing from scratch. A well-structured template simplifies the process by providing a ready-made layout for organizing text, visuals, and data. In this article, we'll explore creative infographic templates for different needs to help you find the right style for your project.
A quick overview of infographic templates
Infographic templates can be grouped by their purpose and the way they present information. Theme-based formats help you choose a design for a specific use case, such as business reporting, marketing, education, or product promotion. Structure-based formats help you decide how to organize content, whether you need to show a timeline, explain a process, compare options, or present data. The following overview covers 10 infographic types across these two categories to help you choose a suitable format for your project.
Theme-based infographic templates
| Infographic template type | Purpose | Key elements | Suitable for | Example use |
|---|---|---|---|---|
| Business infographic template | Summarizes business performance, goals, and strategic priorities. | KPIs, business goals, performance highlights, and key takeaways | Business owners and management teams | Presenting quarterly business performance |
| Marketing infographic template | Communicates campaign messages and promotional strategies to a target audience. | Campaign objectives, audience insights, key messages, and calls to action | Marketers and brand teams | Outlining a social media campaign strategy |
| Educational infographic template | Explains an academic subject or concept to support learning. | Definitions, labeled illustrations, diagrams, and subject-specific facts | Teachers and students | Explaining the water cycle |
| Resume infographic template | Presents a person's professional background and qualifications visually. | Work experience, skills, education, achievements, and contact details | Job seekers and professionals | Showcasing a candidate's career history |
| Product infographic template | Highlights a product's features, specifications, and practical benefits. | Product images, feature callouts, specifications, and benefit labels | Retailers, e-commerce businesses, and product teams | Highlighting the features of a wireless speaker |
| Public awareness infographic template | Raises awareness of public issues and encourages practical actions. | Key facts, actionable tips, relevant icons, and a clear call to action | Nonprofits, public organizations, and community groups | Creating an energy-saving awareness guide |
Structure-based infographic templates
| Infographic template type | Purpose | Key elements | Suitable for | Example use |
|---|---|---|---|---|
| Timeline infographic template | Presents events or milestones in chronological order. | Dates, milestones, connecting lines, and brief descriptions | Project teams, historians, and organizations | Showing a company's development over time |
| Process infographic template | Explains how to complete a task or how a workflow progresses through sequential stages. | Numbered steps, arrows, icons, and concise instructions | Trainers, operations teams, and beginners | Demonstrating how to set up a new account |
| Comparison infographic template | Shows similarities and differences between two or more options. | Side-by-side sections, shared criteria, advantages, and limitations | Consumers, buyers, and business teams | Comparing two software plans |
| Statistical infographic template | Presents numerical data to reveal patterns, proportions, or trends. | Charts, percentages, figures, data labels, and source notes | Researchers, analysts, and data-focused teams | Visualizing survey results on remote work |
| Informational infographic template | Organizes practical facts and guidance into sections for quick reference. | Section headings, short explanations, icons, and actionable tips | Creating an energy-saving awareness guide |
Explore 10 infographic templates for every purpose
Choosing the right infographic layout helps you present information clearly while keeping your audience engaged. With Kimi Design, an AI design generator, you can describe your topic in a text prompt, generate an infographic with AI, review the result, and refine the layout, colors, and content before exporting it. The following 10 infographic templates offer ideas for different needs, from business reports and marketing campaigns to educational content and personal resumes.
Business infographic template
A business infographic template helps present company performance, goals, and key metrics in a clear, professional format. It combines charts, statistics, and concise text to make business information easier to understand. Use this layout for reports, presentations, and strategic planning.
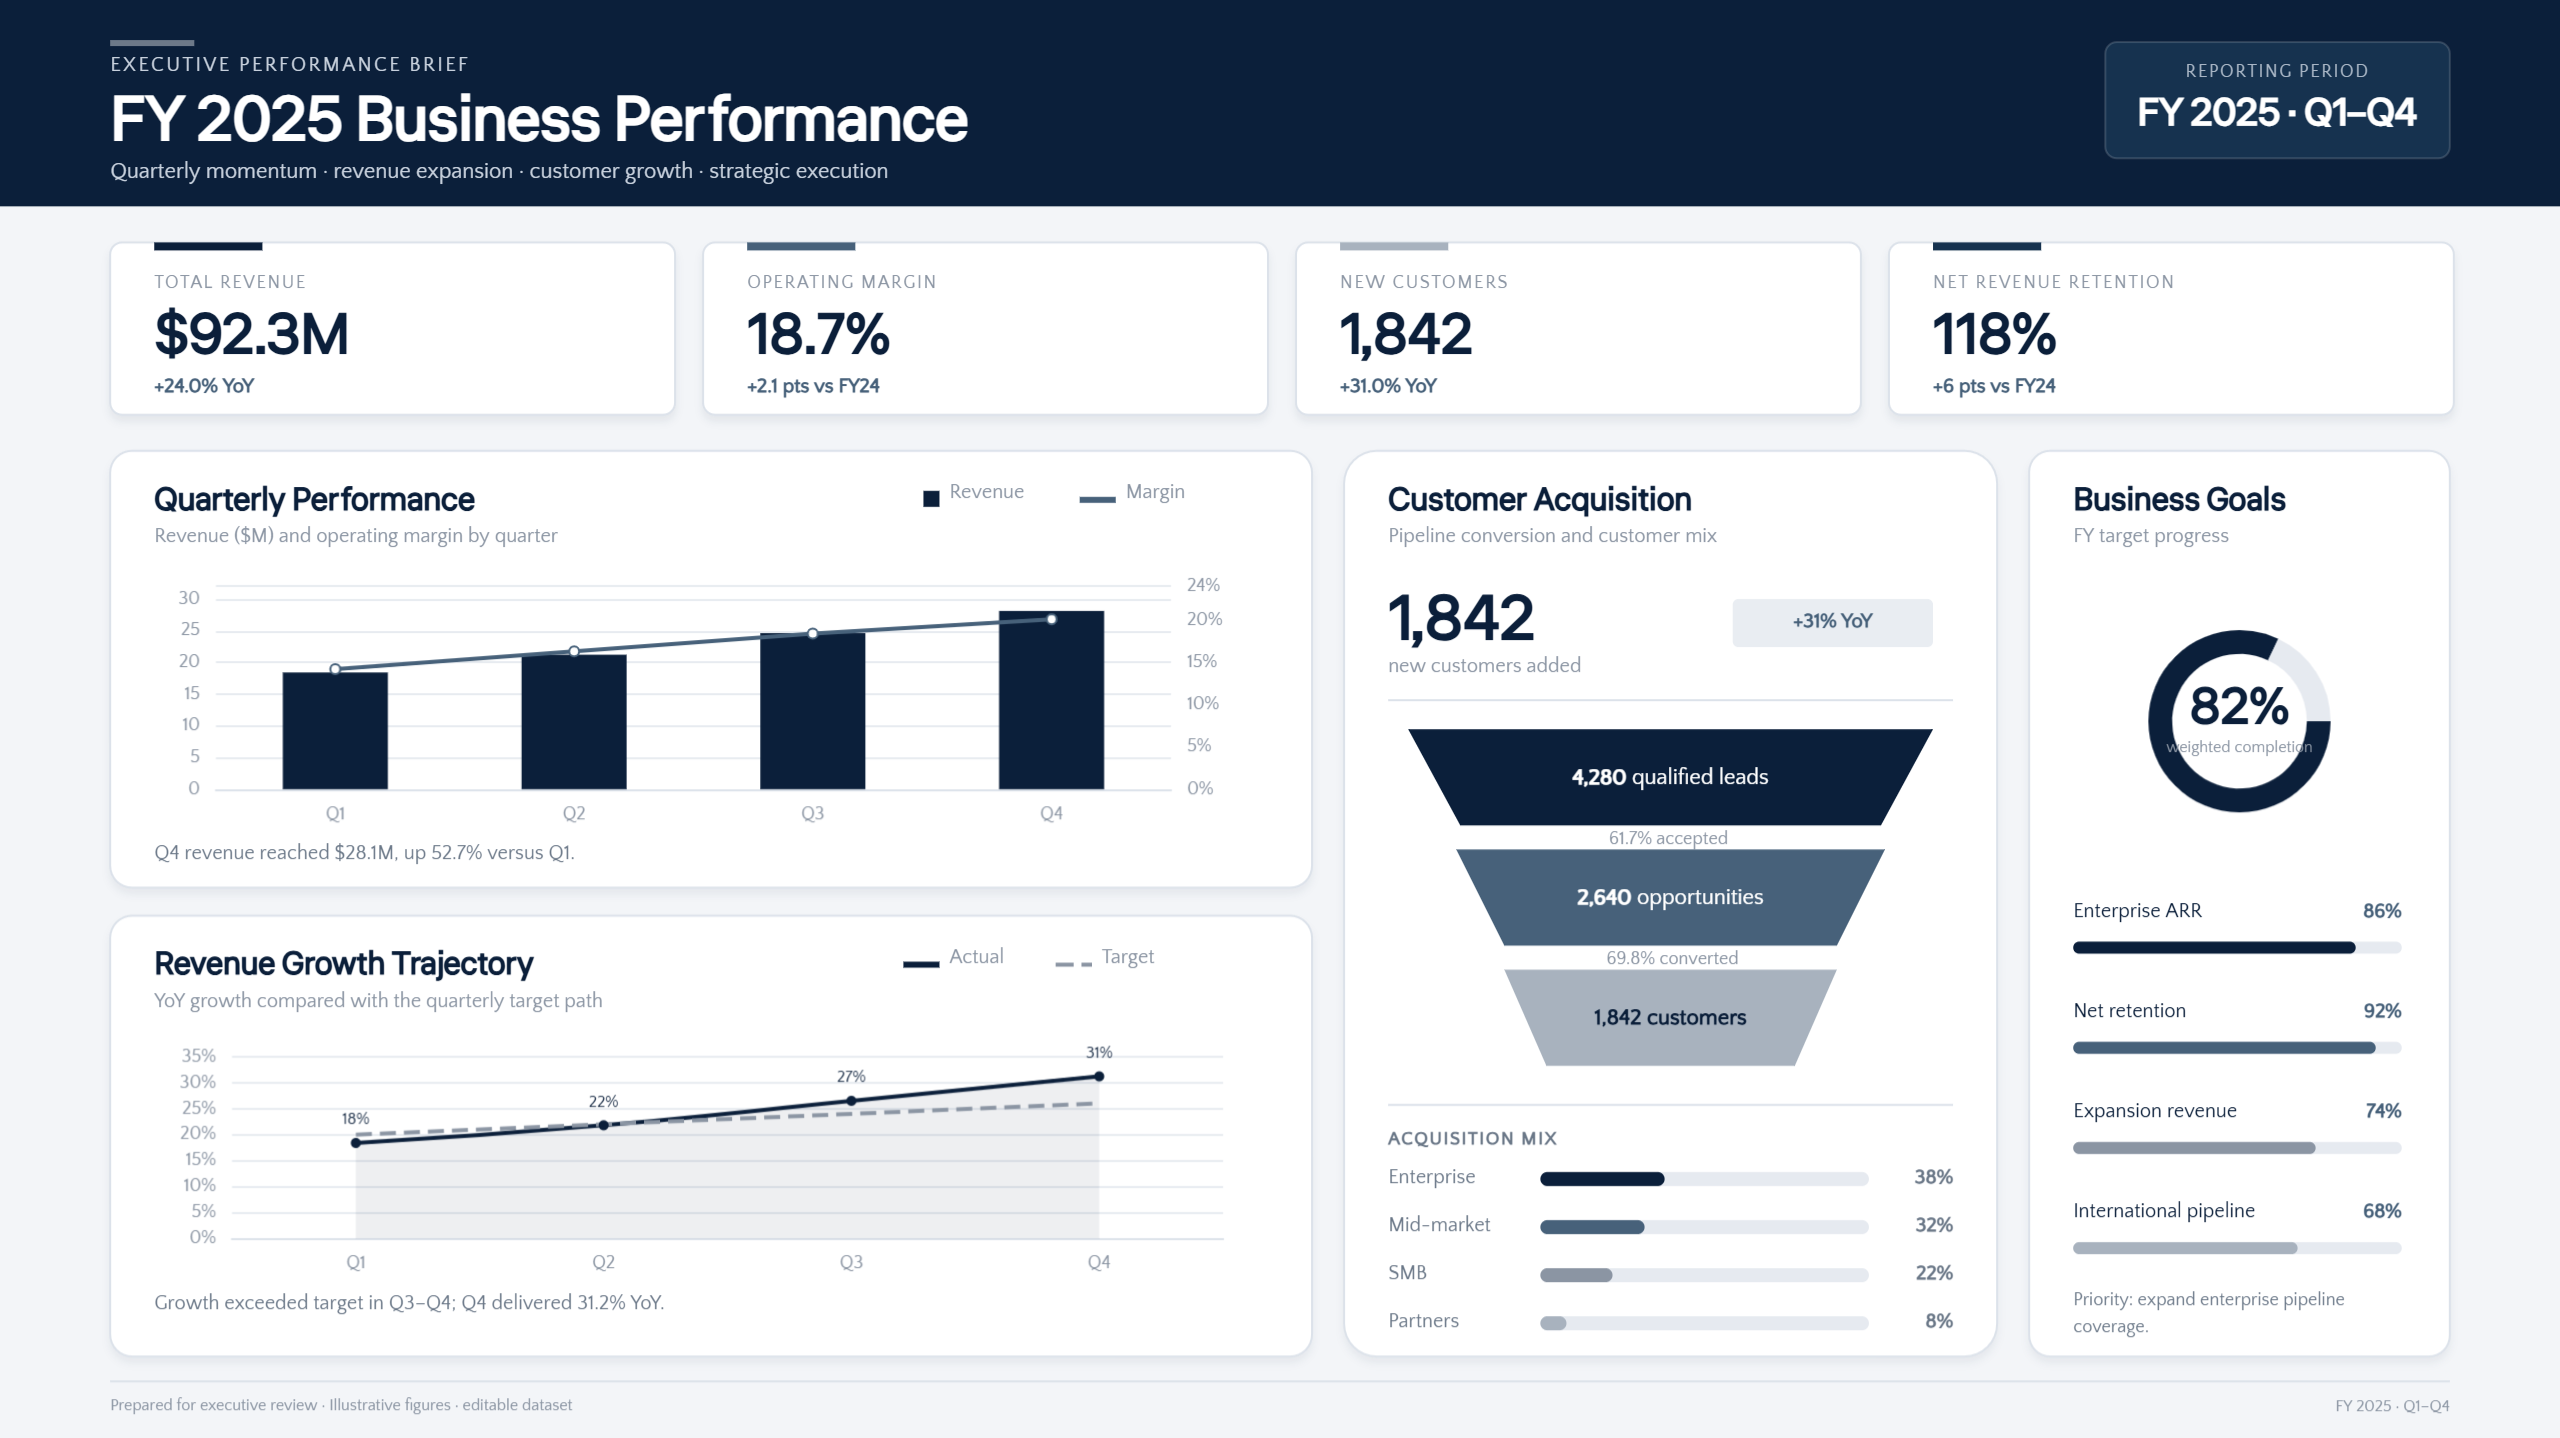
Prompt:
Marketing infographic template
A marketing infographic template helps brands communicate campaign results, product value, and promotional messages. It uses engaging visuals and short text to capture attention and highlight important information. This infographic design template works well for social media, email campaigns, and marketing presentations.
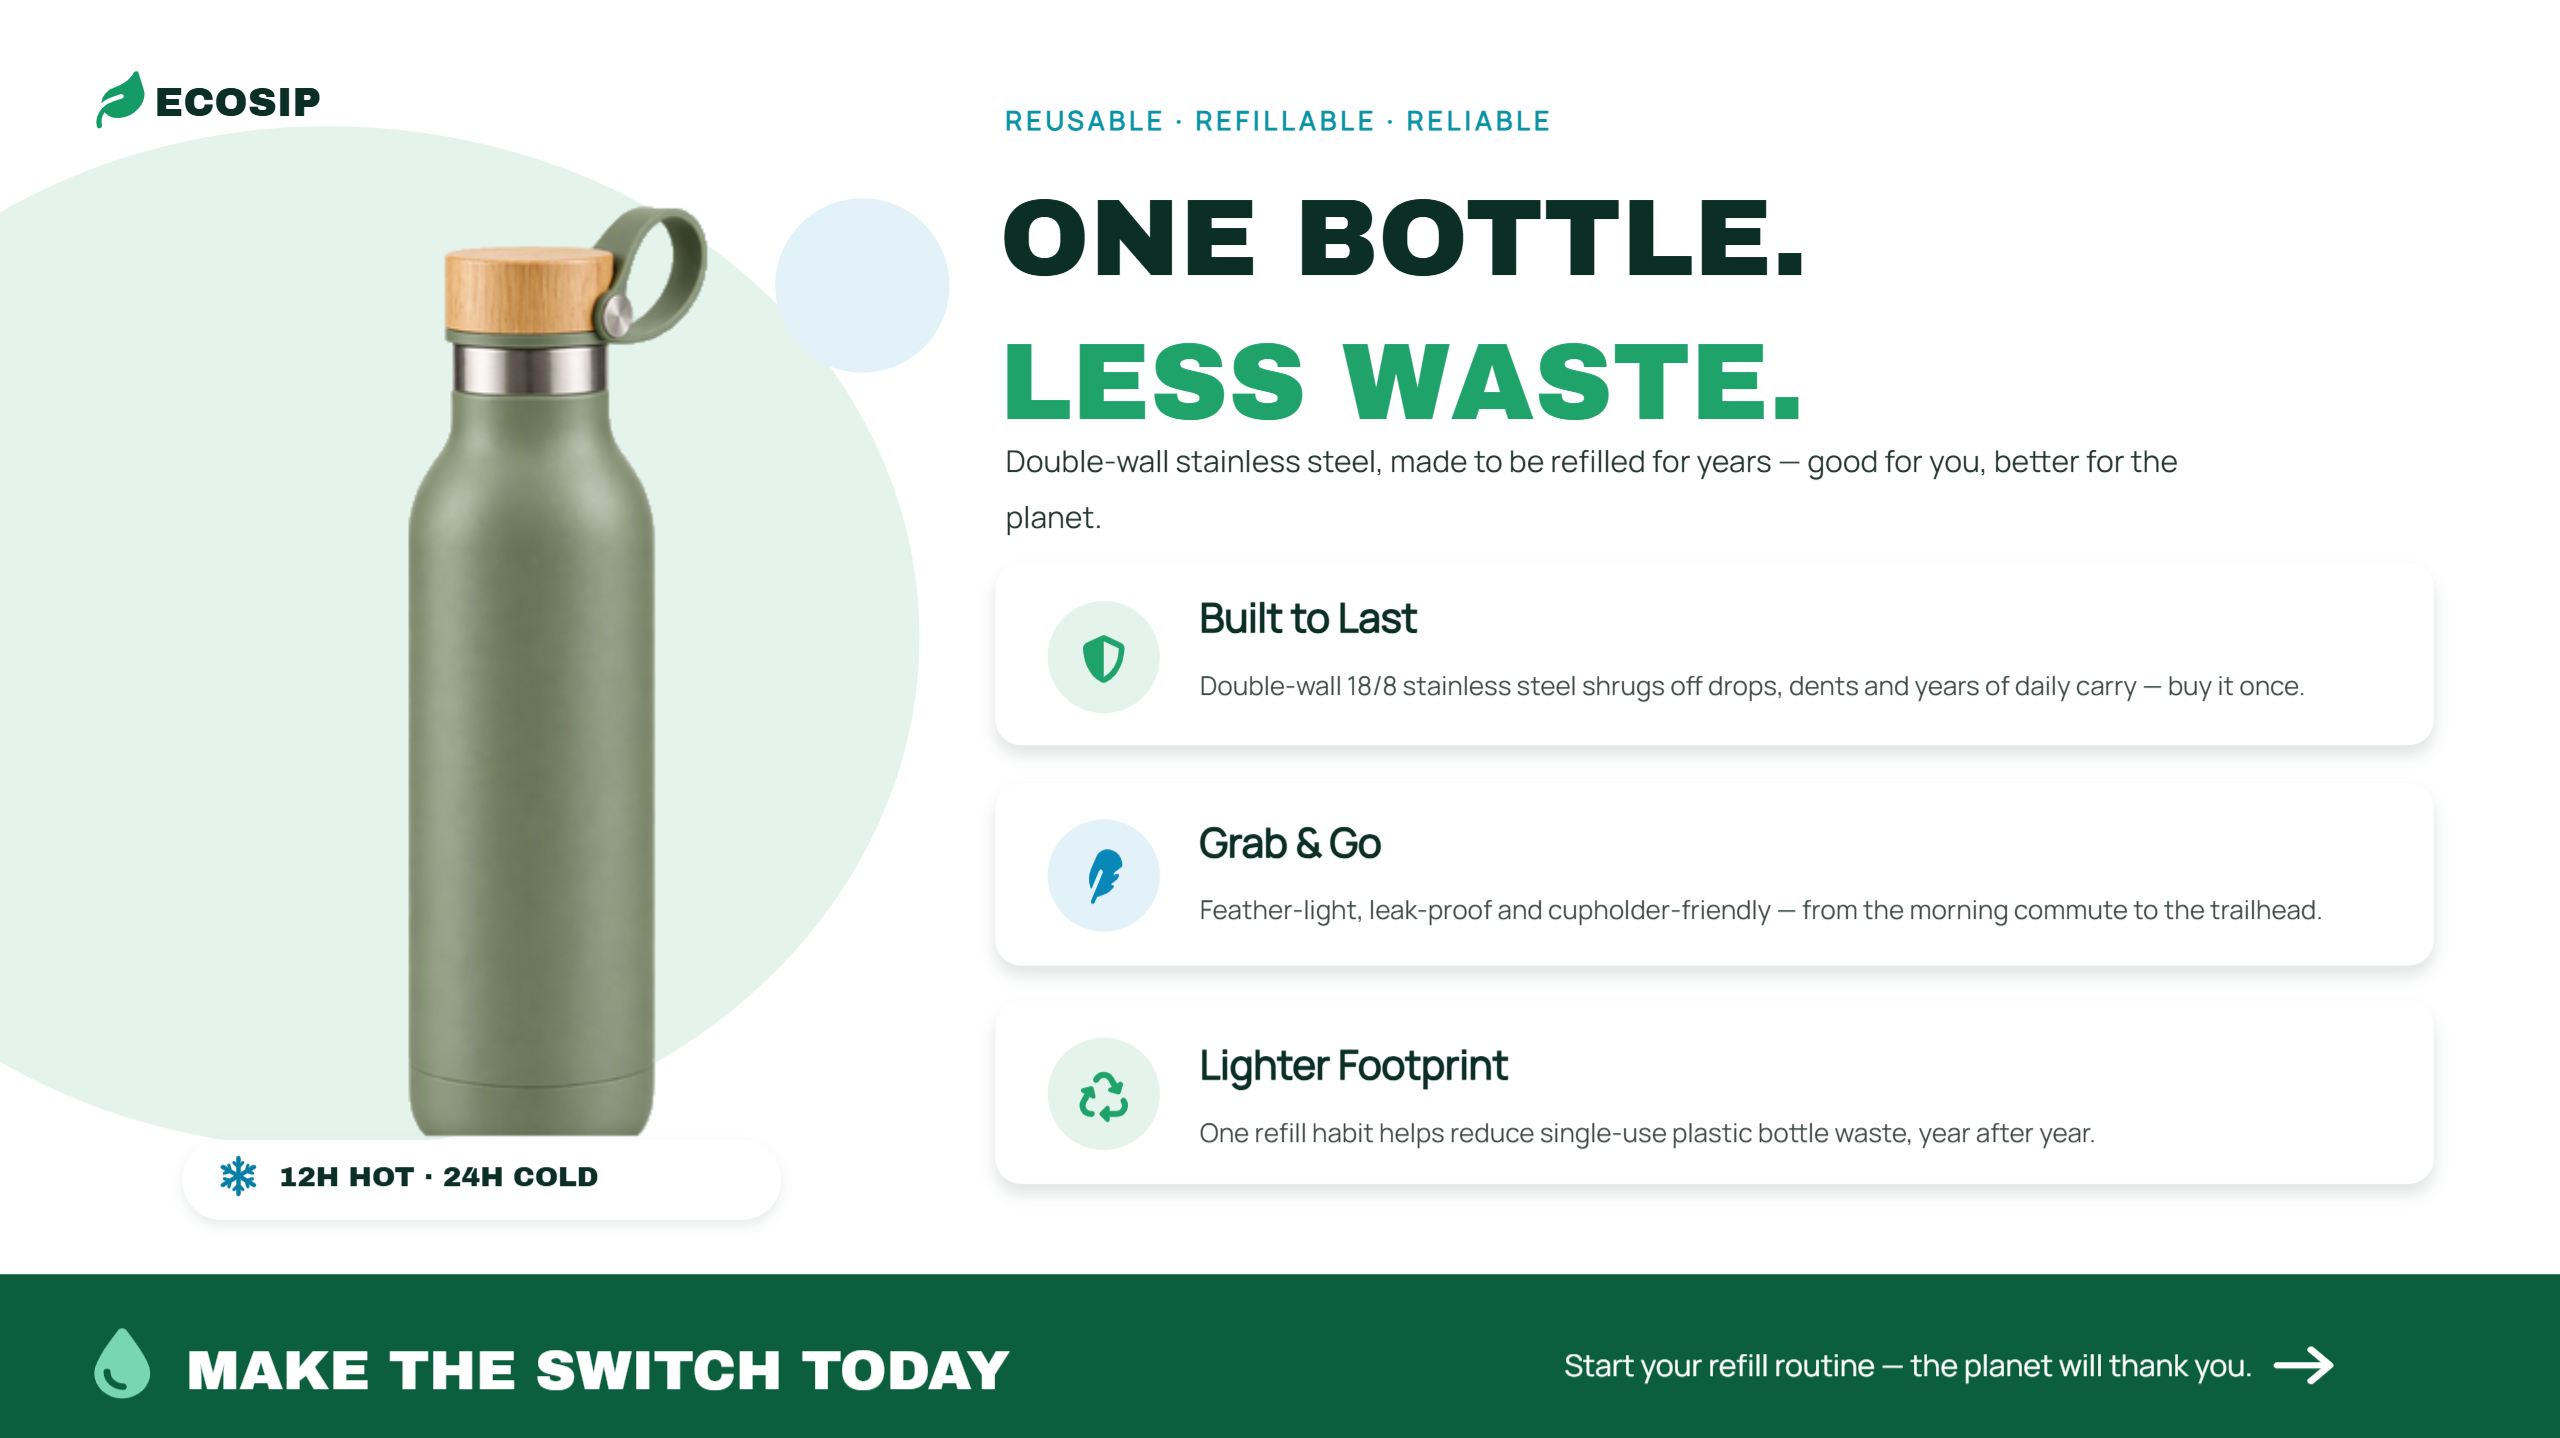
Prompt:
Educational infographic template
An educational infographic template simplifies complex subjects through illustrations, facts, and organized explanations. It helps students understand important concepts without reading lengthy paragraphs. Teachers can use this format for classroom materials, revision notes, and educational presentations.
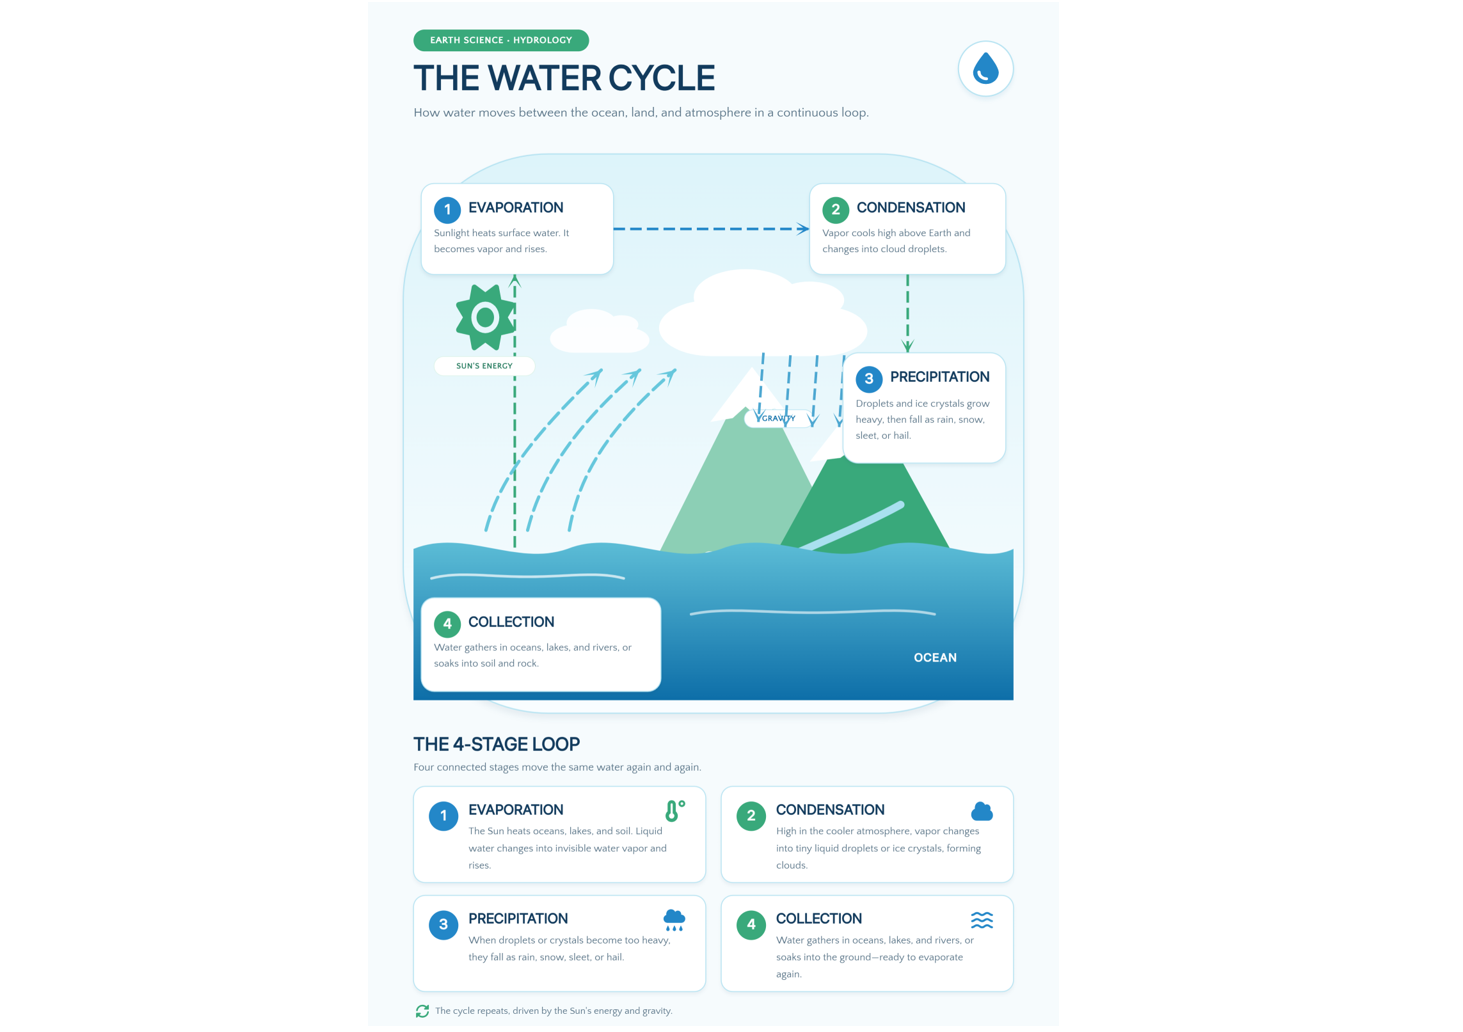
Prompt:
Resume infographic template
A resume infographic template presents professional experience, skills, education, and achievements in a visually organized format. It helps job seekers highlight their qualifications while making key details easy to scan. An infographic resume template can be useful for creative portfolios and personal branding, although traditional resumes are often preferable for applicant tracking systems.
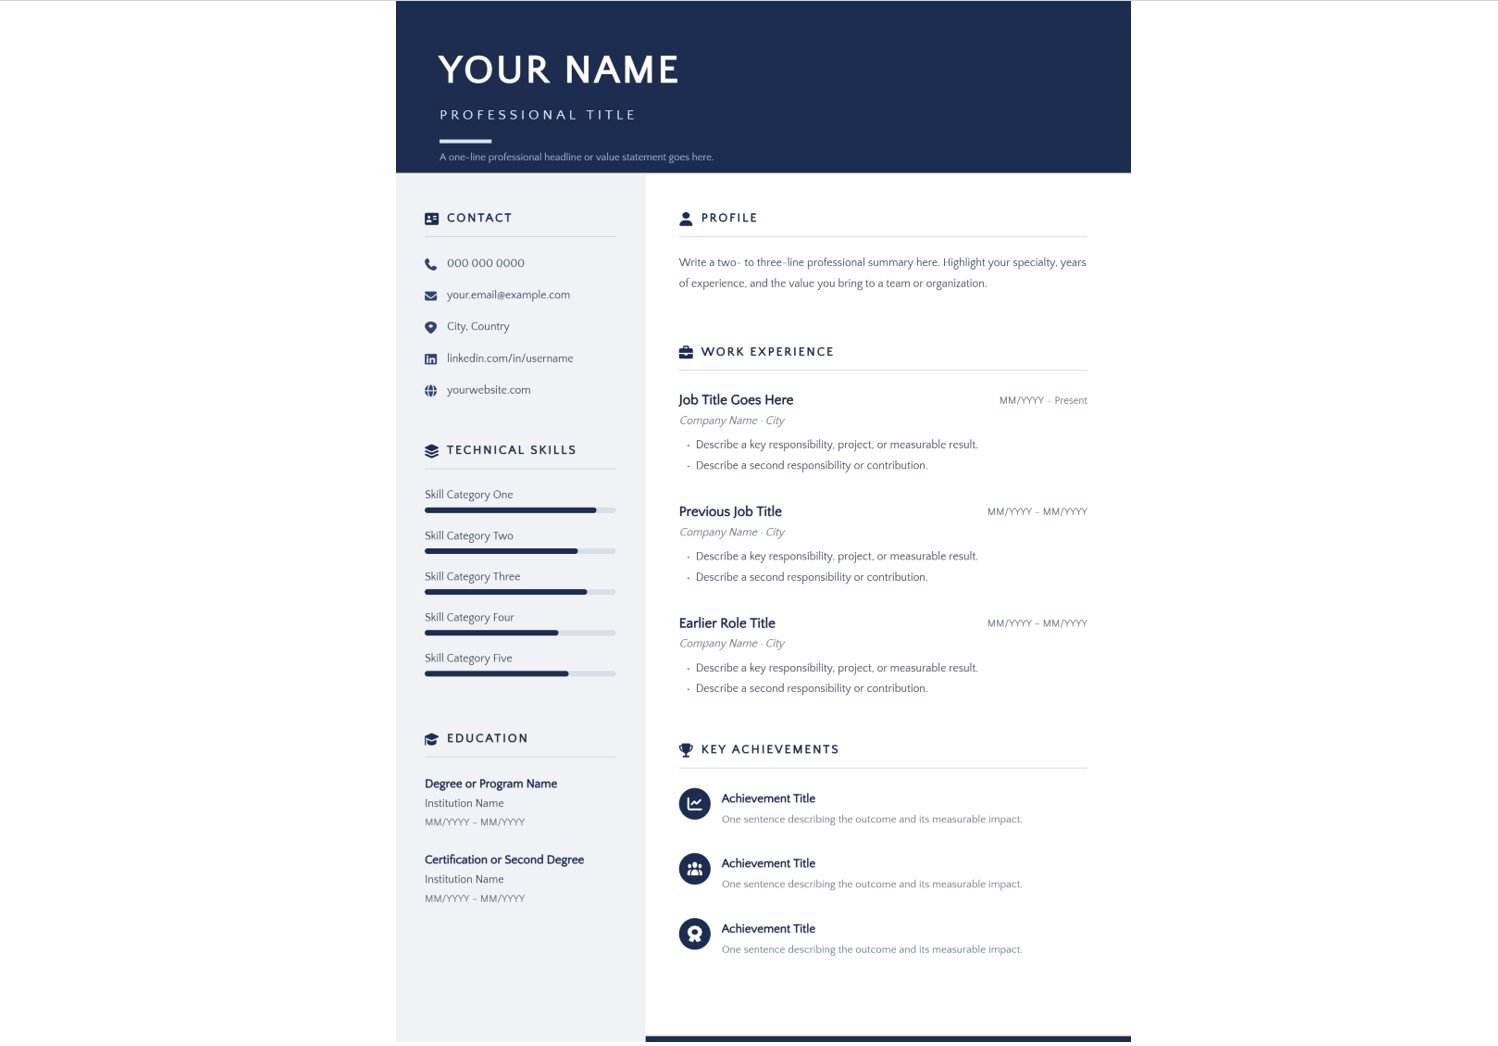
Prompt:
Product infographic template
A product infographic template highlights an item's features, specifications, and customer benefits through product images and concise labels. It helps shoppers understand what makes a product useful and supports e-commerce listings and promotional campaigns. An editable infographic template also makes it easier to update product details when information changes.
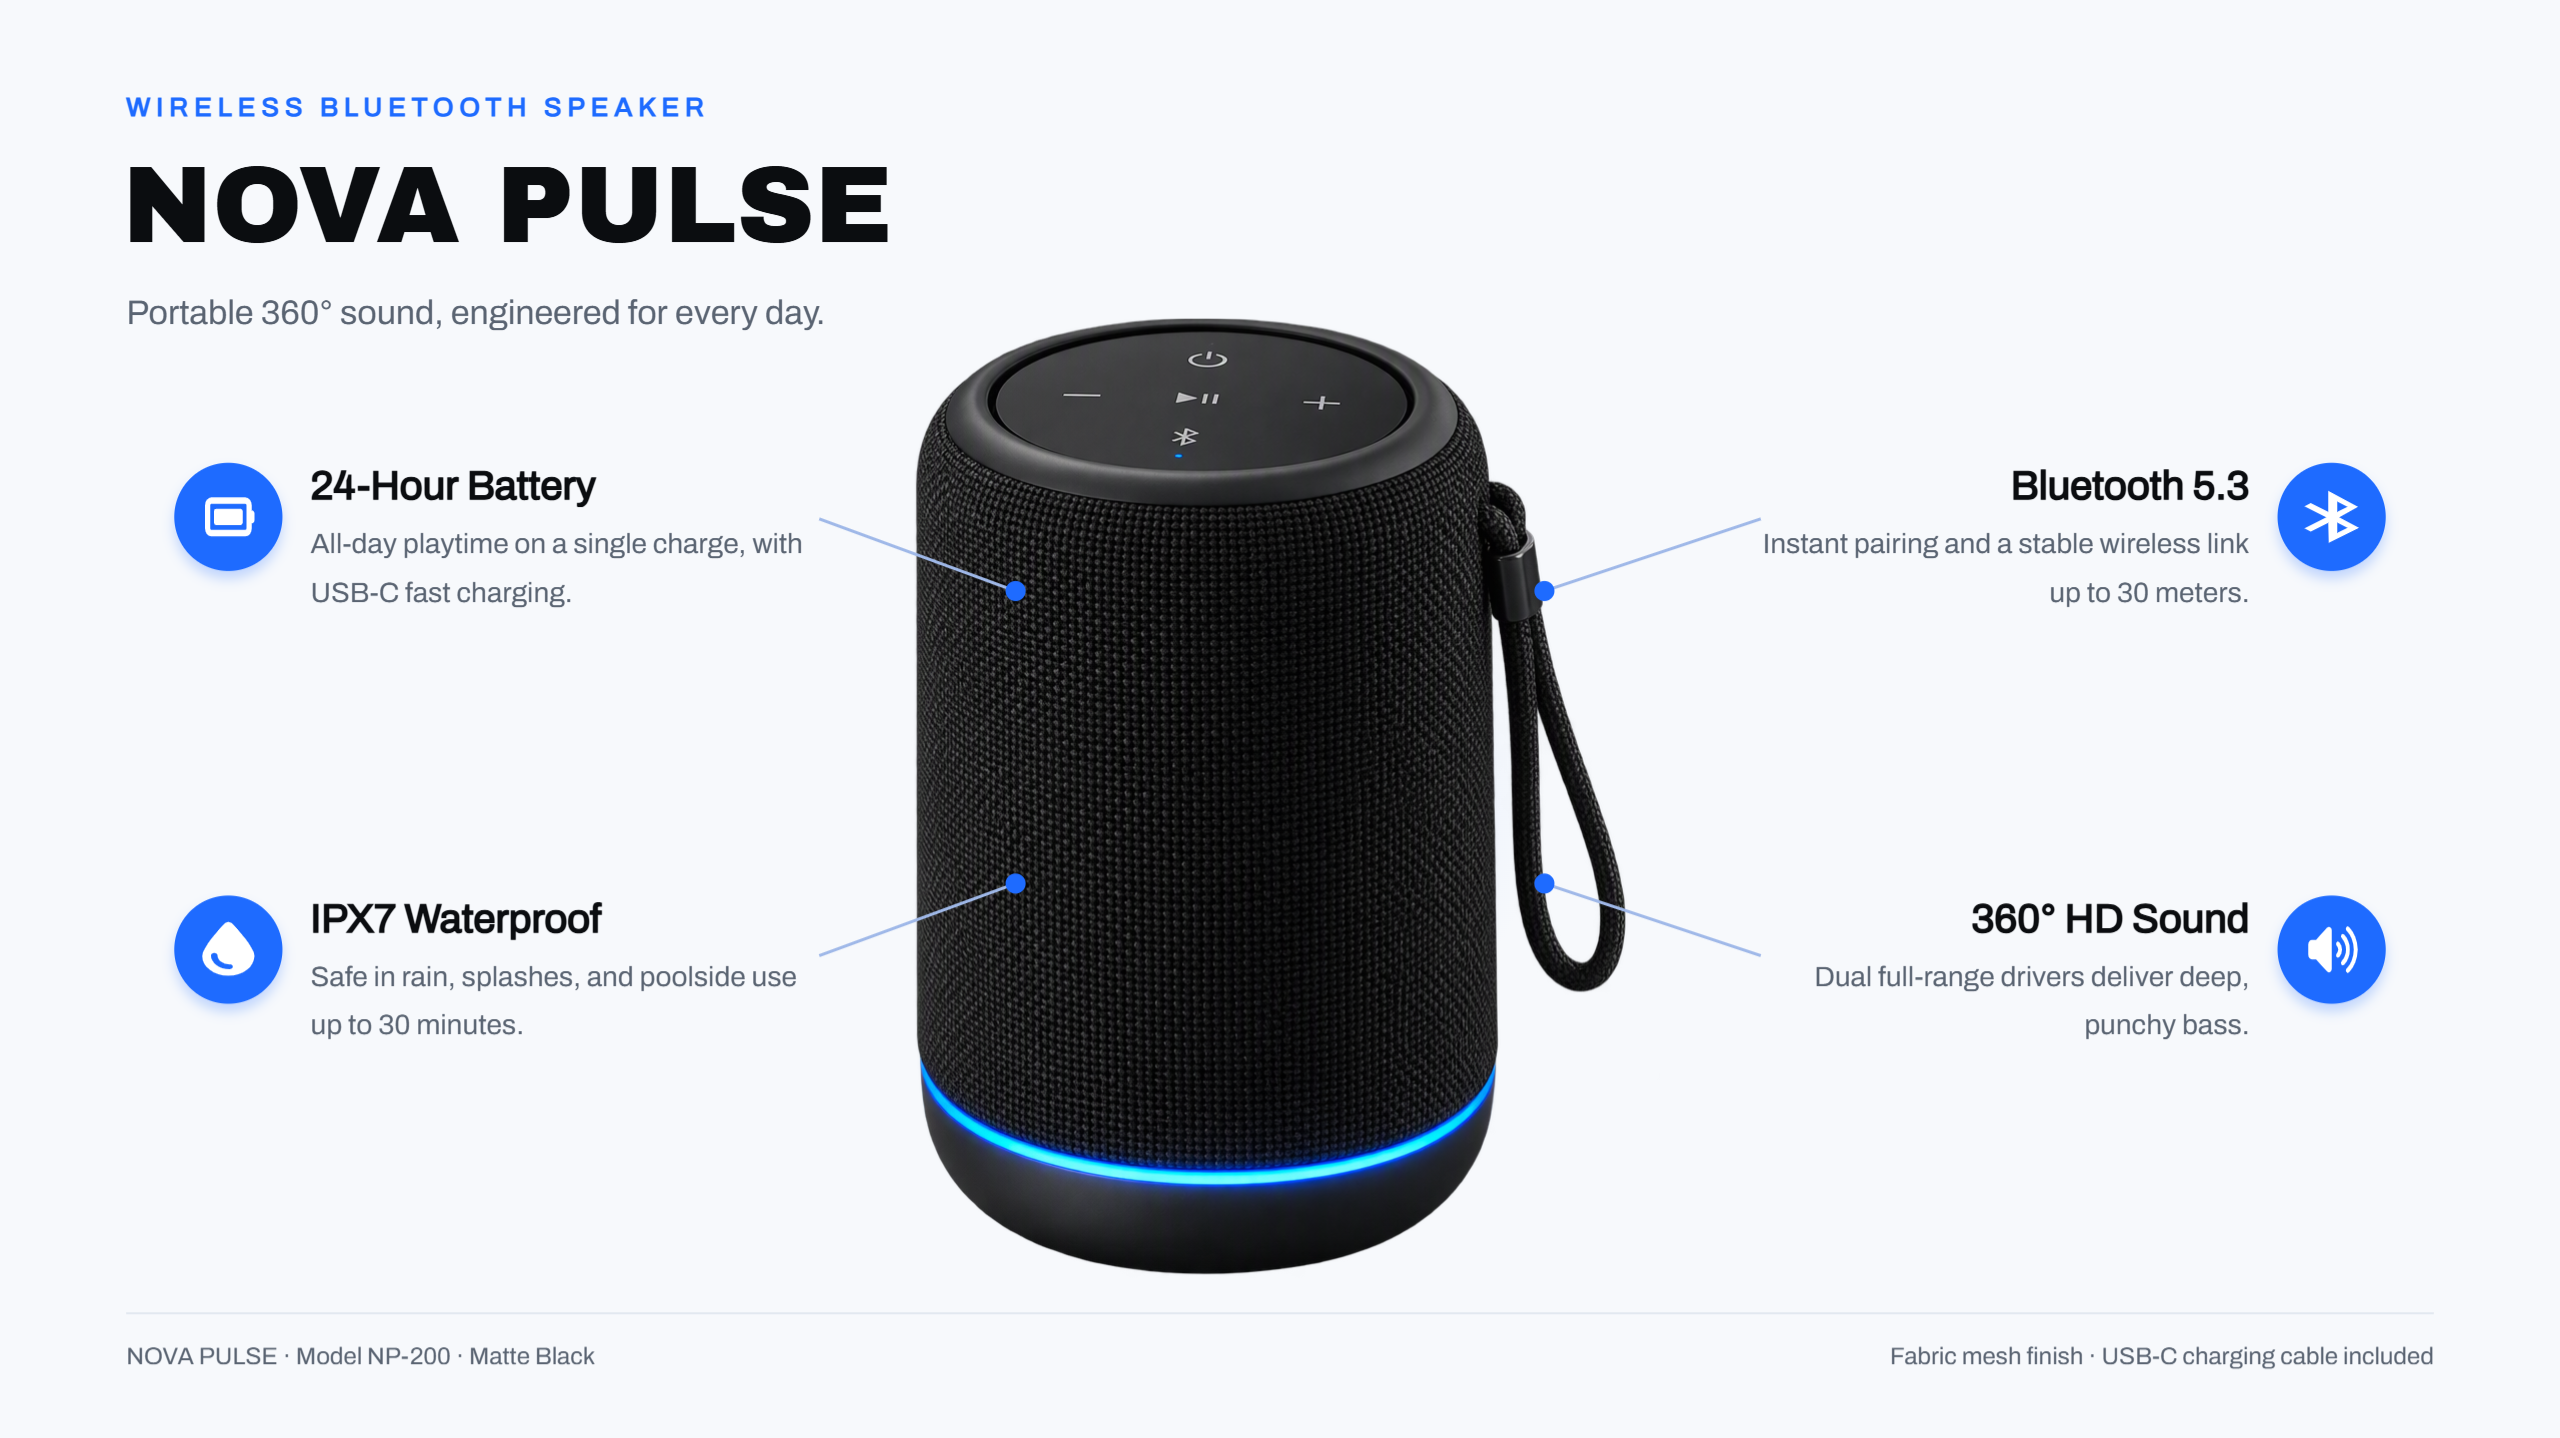
Prompt:
Public awareness infographic template
A public awareness infographic presents an issue and a set of practical actions in a format readers can scan quickly. It works well for energy-saving guidance, health education, safety reminders, and community campaigns. Include reliable sources when using statistics or factual claims.
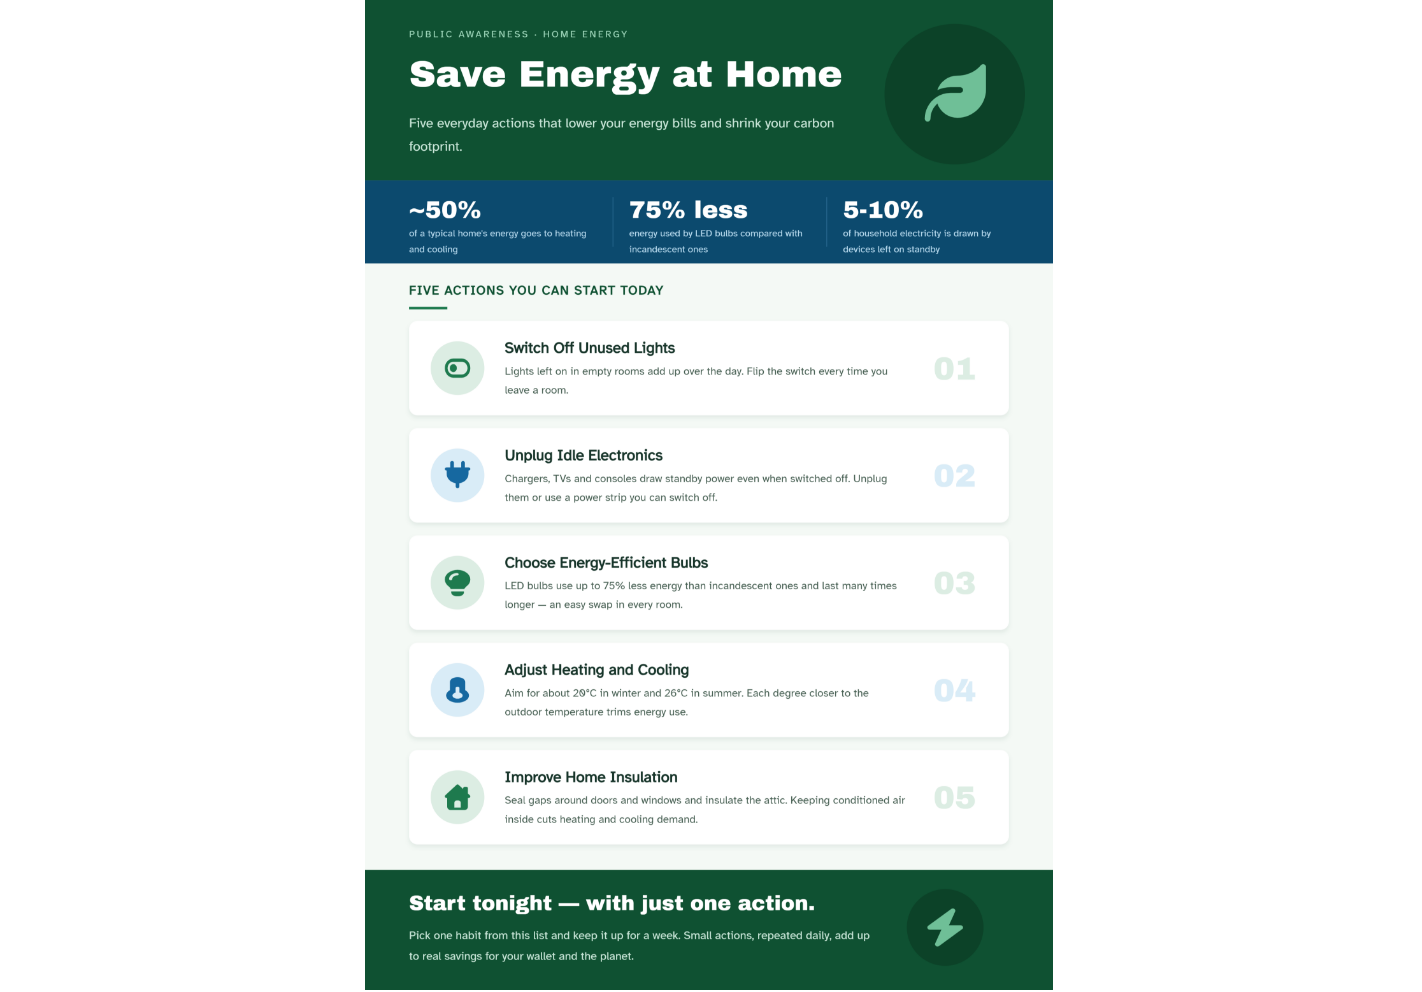
Prompt:
Timeline infographic template
A timeline infographic template presents events, milestones, or project stages in chronological order. Connecting dates with visual markers helps readers follow progress and understand how events relate to one another. It is useful for company histories, project schedules, and historical overviews.
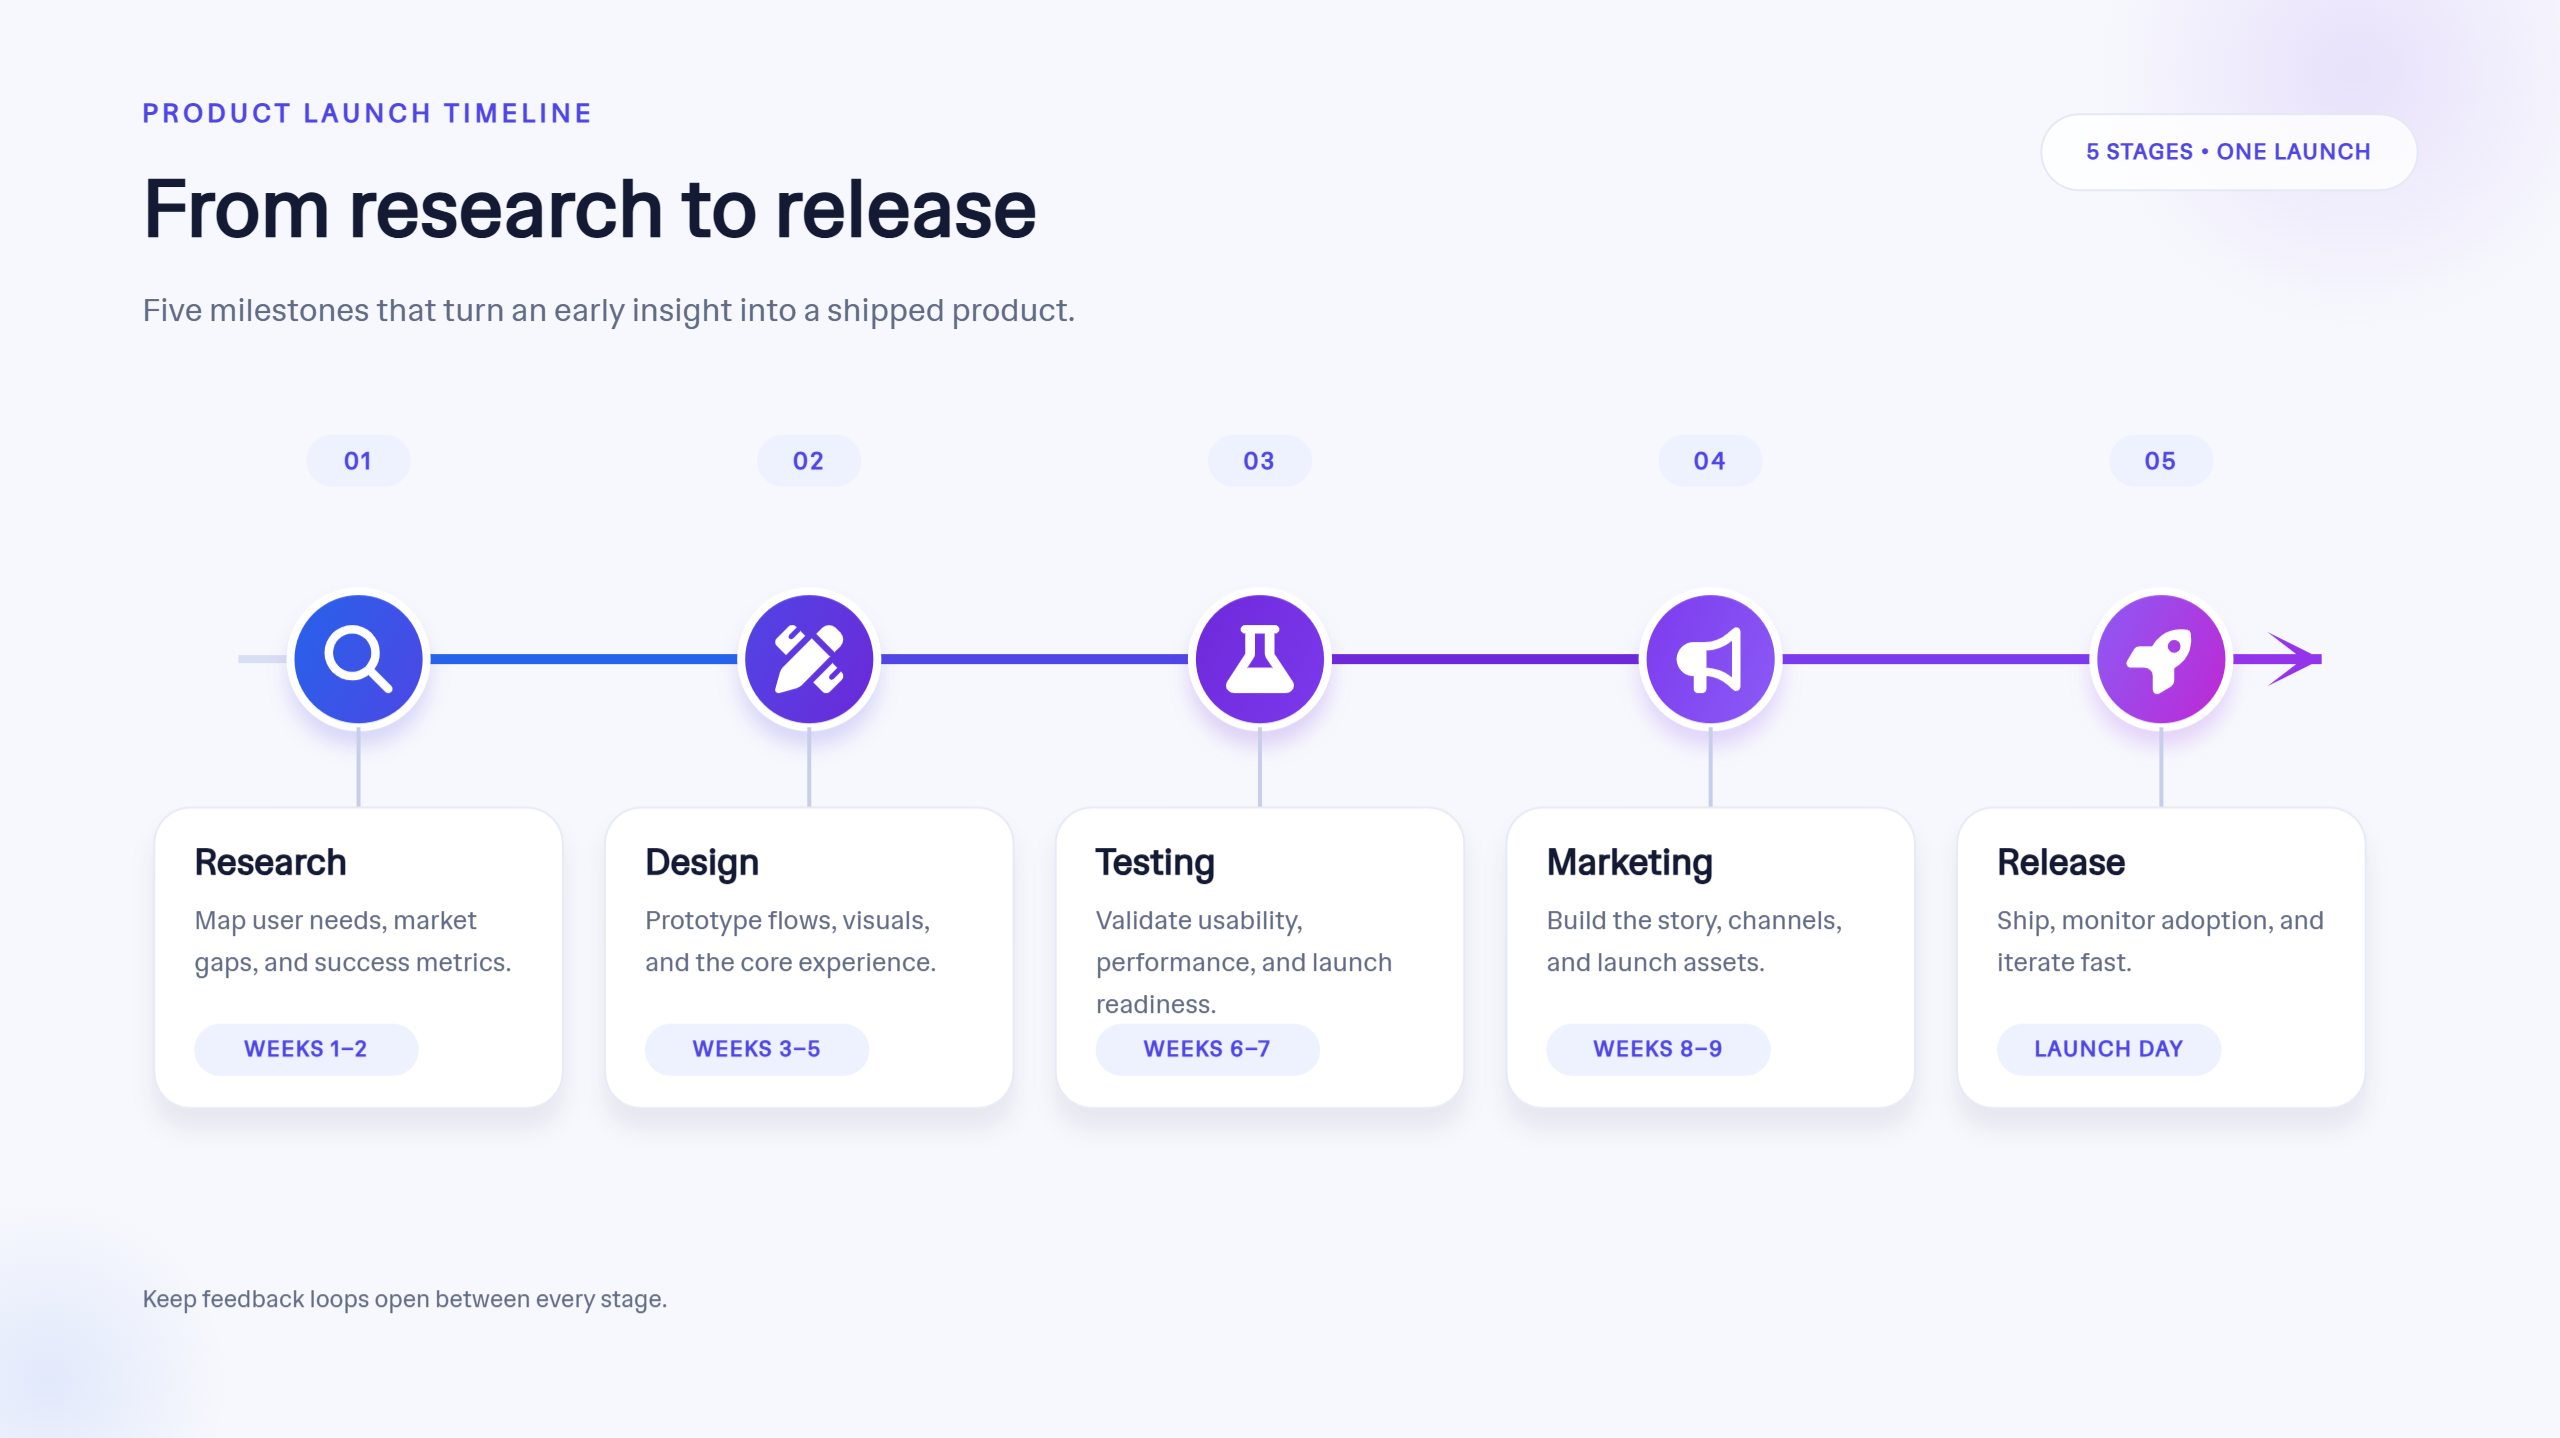
Prompt:
Process infographic template
A process infographic template breaks a task into clear, sequential steps so readers can understand how something works. Numbered stages, arrows, and short instructions make complex workflows easier to follow. Use this infographic template for tutorials, onboarding materials, and standard operating procedures.
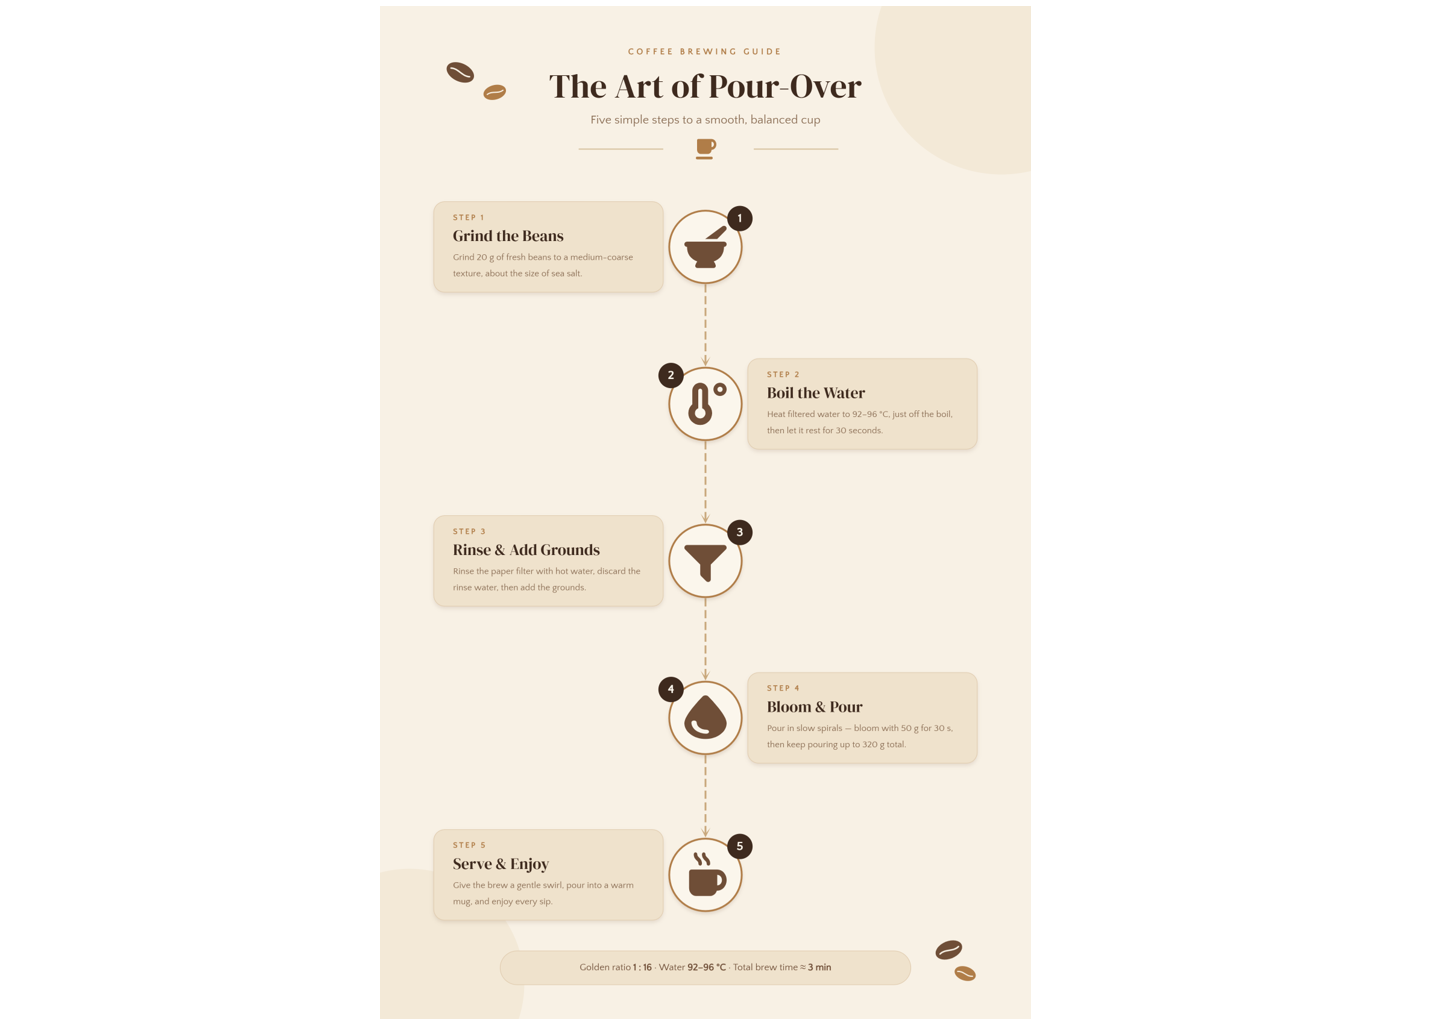
Prompt:
Comparison infographic template
A comparison infographic template places two or more options side by side to show their similarities and differences. It helps readers evaluate important features, costs, and benefits without searching through lengthy descriptions. This format works well for product comparisons, service plans, and purchasing decisions.
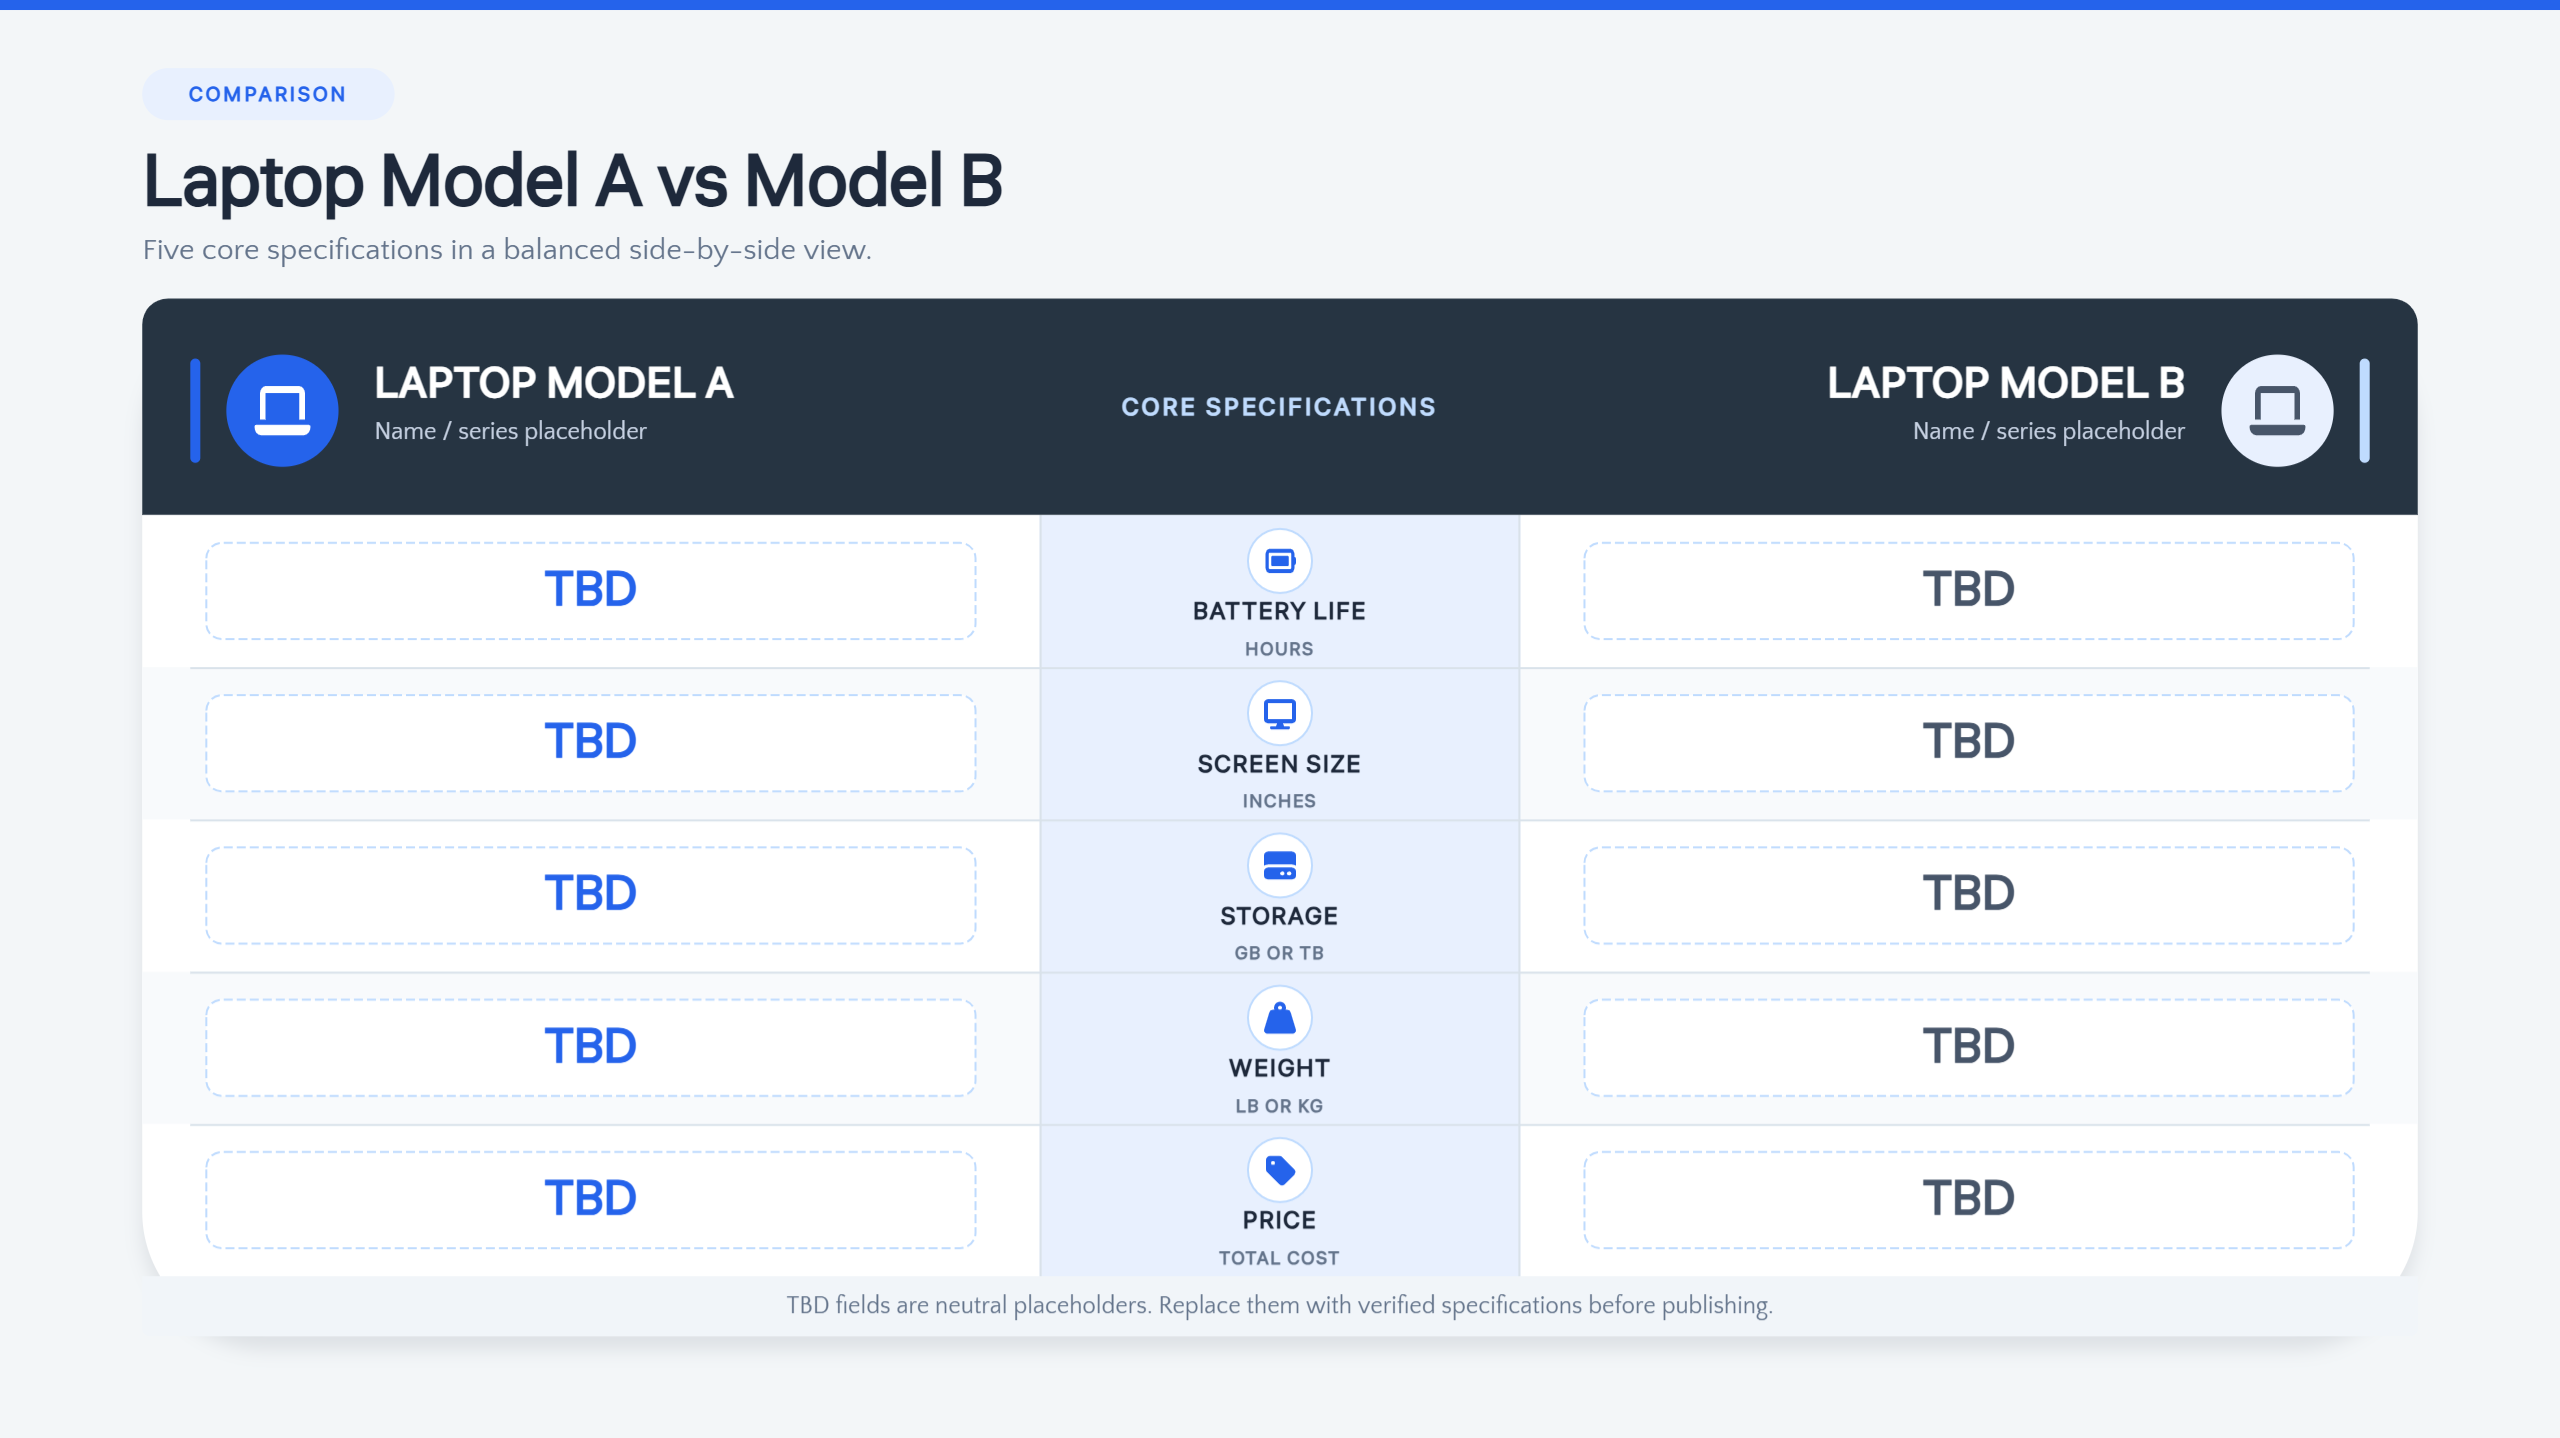
Prompt:
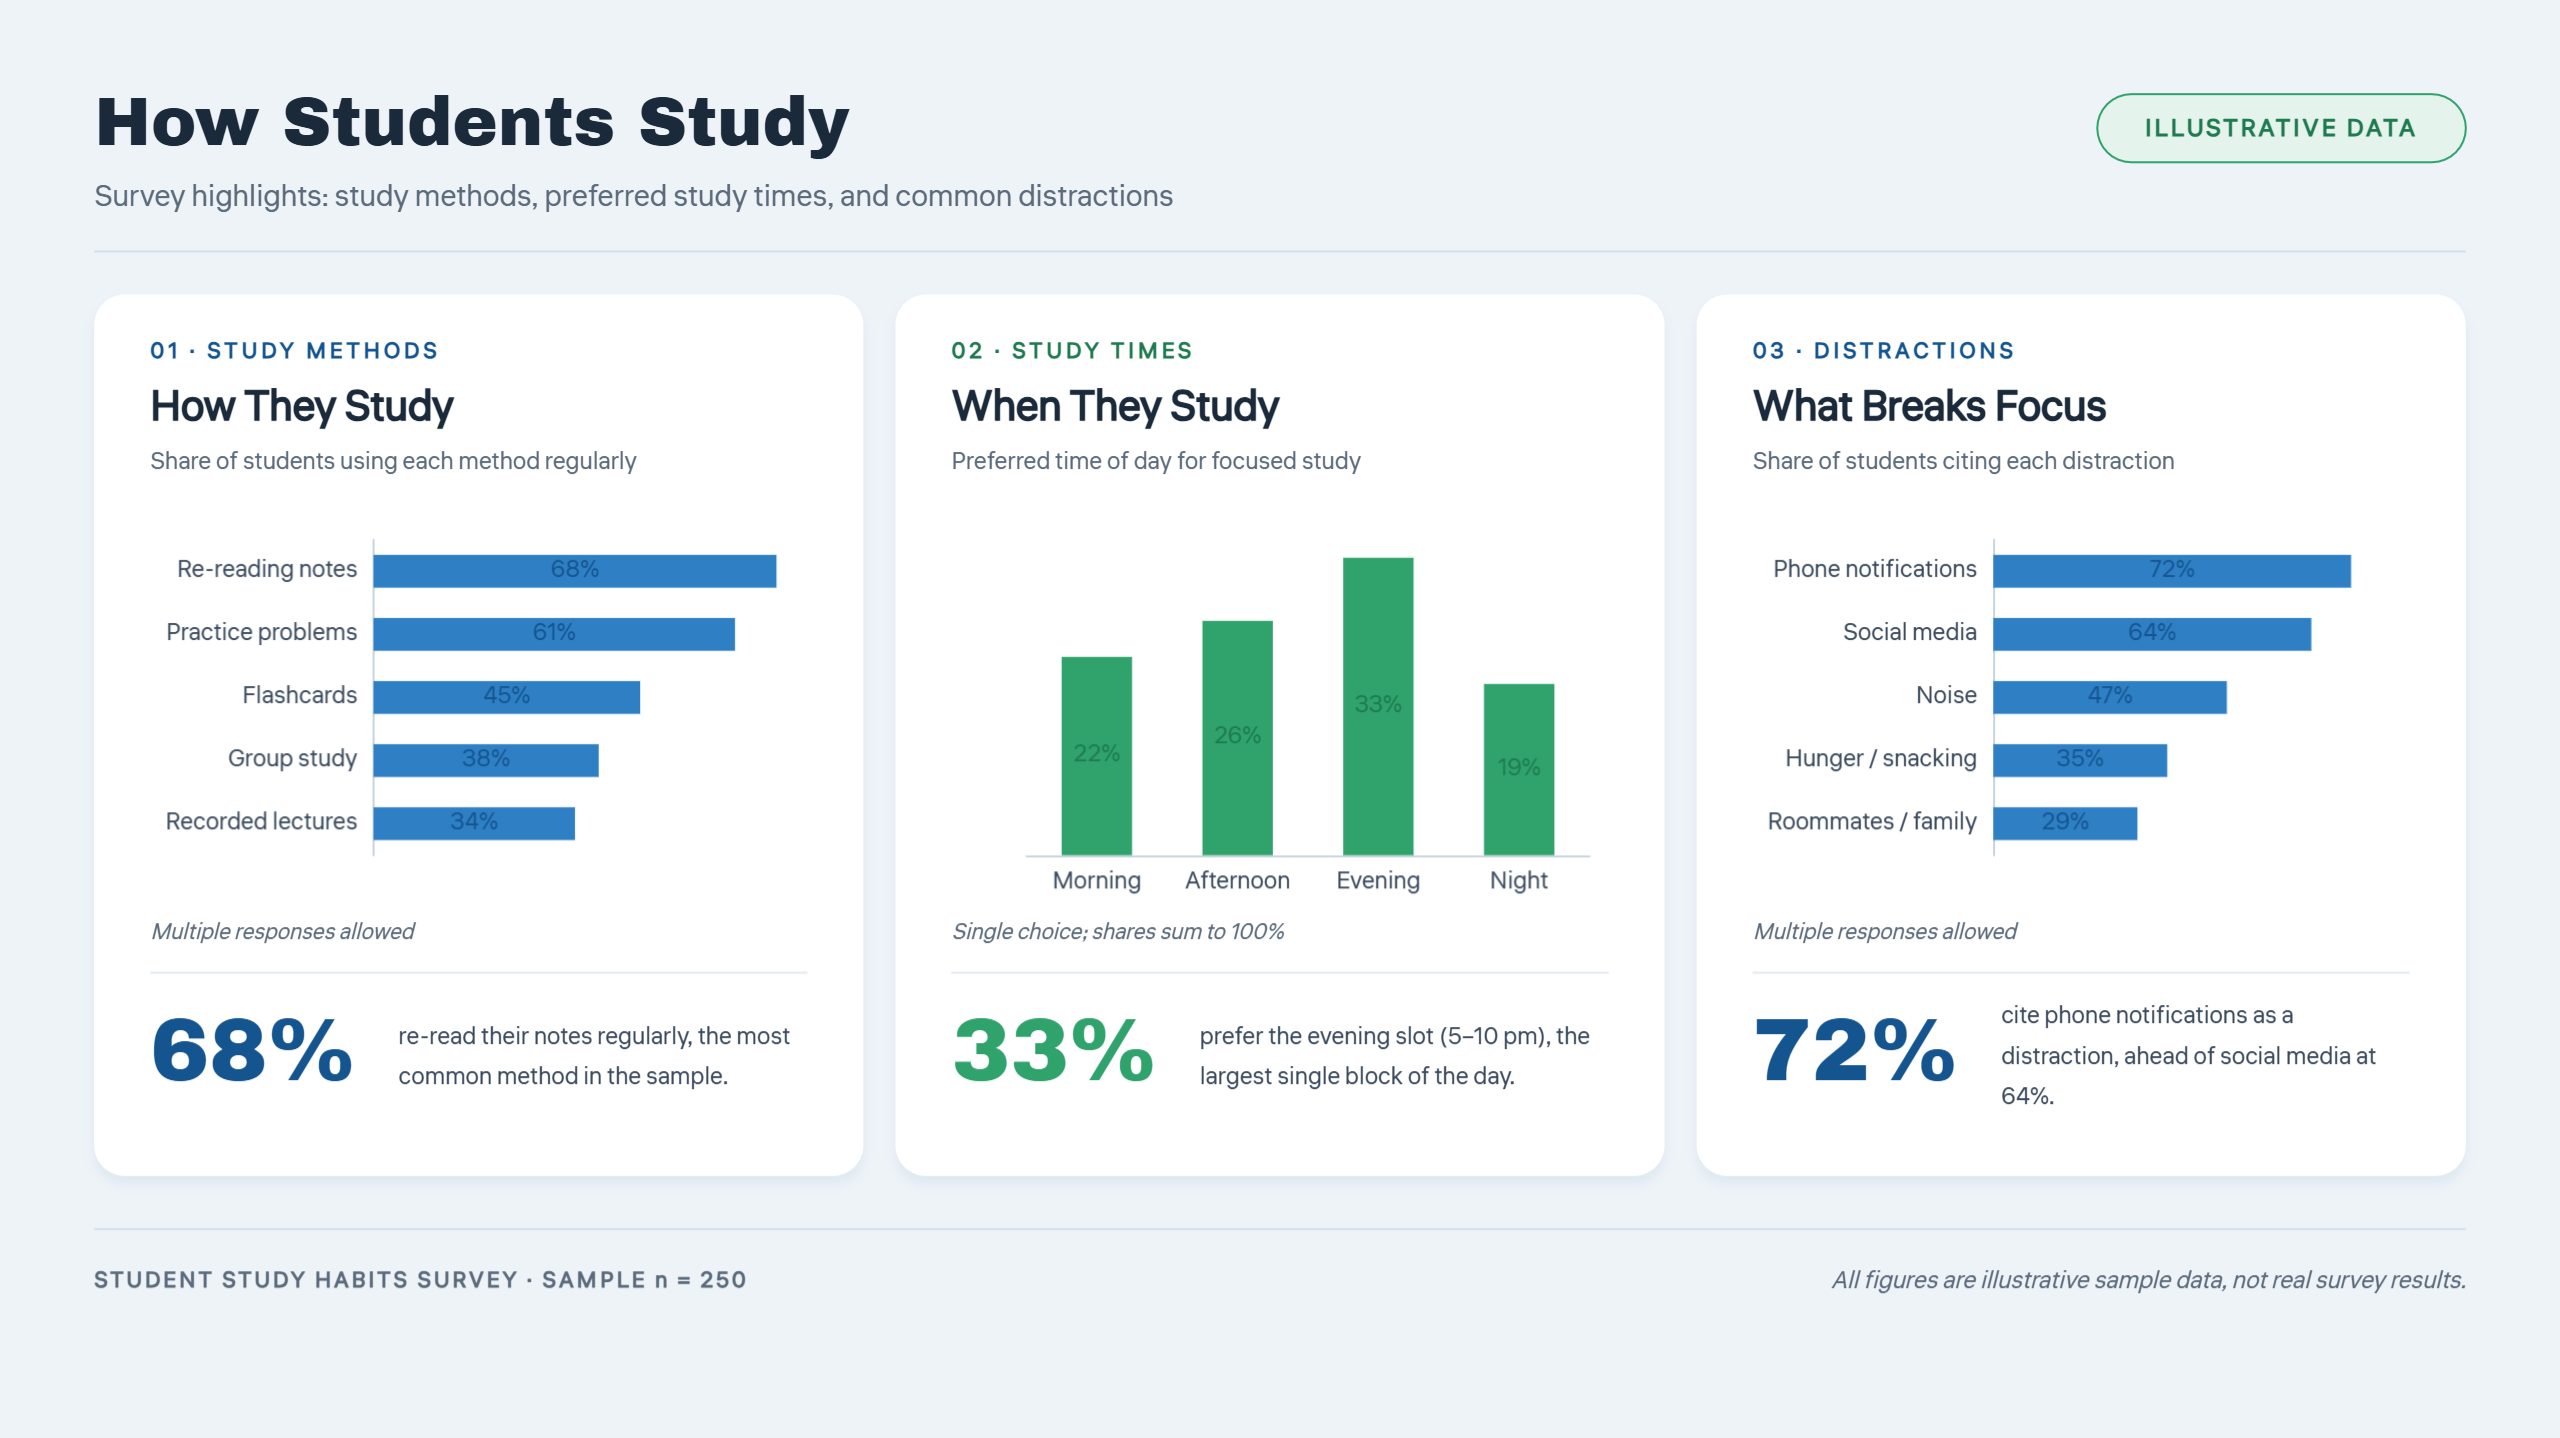
Statistical infographic template
A statistical infographic template turns numerical data into charts, percentages, and visual highlights that readers can interpret quickly. It is especially useful for research findings, surveys, market reports, and performance summaries. Choose an infographic template free of unnecessary decorative elements to keep the focus on accurate data.
Prompt:
Why create custom infographic designs with Kimi Design
Ready-made layouts are useful, but custom designs give you more control over how information is presented. With Kimi Design, you can use AI to create visuals tailored to your topic, audience, and preferred style. Here is why Kimi Design is worth considering for creating custom infographic design templates.
Create infographics from prompts and reference materials
Describe your infographic idea with a text prompt, and upload documents, data files, images, or other reference materials to provide additional context. Kimi Design turns your instructions and materials into a structured infographic with clear headings, visual elements, and an organized layout.
Explore styles for different infographic purposes
Create infographics for business reports, educational content, marketing campaigns, product explainers, and data presentations. Experiment with different color palettes, typography, illustrations, and visual structures to match your content and audience.
Refine infographic designs with flexible editing tools
Adjust text, colors, layouts, charts, and illustrations using natural-language prompts in the chat. Comment on specific elements to request targeted changes, or edit individual components manually for more precise control over the final design.
Export infographics for sharing and presentation
Export your finished infographic in supported formats such as PNG, JPG, or PDF. Prepare visuals for websites, social media, reports, presentations, and print materials while keeping key information clear and easy to follow.
Tips for creating an effective infographic
An effective infographic combines clear messaging, well-organized information, and thoughtful visual design. Whether you're presenting data, explaining a process, or introducing a product, the following tips can help you create an infographic that communicates your message clearly and keeps your audience engaged.
Define your main message
Decide what you want your audience to learn or remember. Focus on one central topic and organize supporting information around it to keep the infographic clear and purposeful.
Organize information logically
Group related facts together and arrange them in a sequence that makes sense for your topic. Use headings, sections, or numbered steps to help readers follow the information from beginning to end.
Choose the right infographic format
Match the layout to your content and communication goal. Use timelines for historical events, comparison layouts for product differences, and process diagrams to explain workflows or procedures.
Use visuals to support the content
Incorporate icons, illustrations, charts, or images that help explain the information. Choose visuals that reinforce your message rather than adding decorative elements that distract you from the key points.
Maintain a clear visual hierarchy
Use font sizes, colors, spacing, and contrast to distinguish headings from supporting details. Highlight essential figures or takeaways so readers can identify the most important information at a glance.
Keep the design readable and balanced
Use concise text, consistent typography, and sufficient whitespace to prevent overcrowding. Check that labels, chart values, and other details remain legible across different screen sizes and in print.
Conclusion
The right infographic template helps you turn complex information into clear, engaging visuals for business, education, marketing, and more. By choosing a layout that matches your content and audience, you can create designs that communicate your message effectively. Explore different infographic templates and customize them to suit your goals, style, and presentation needs.