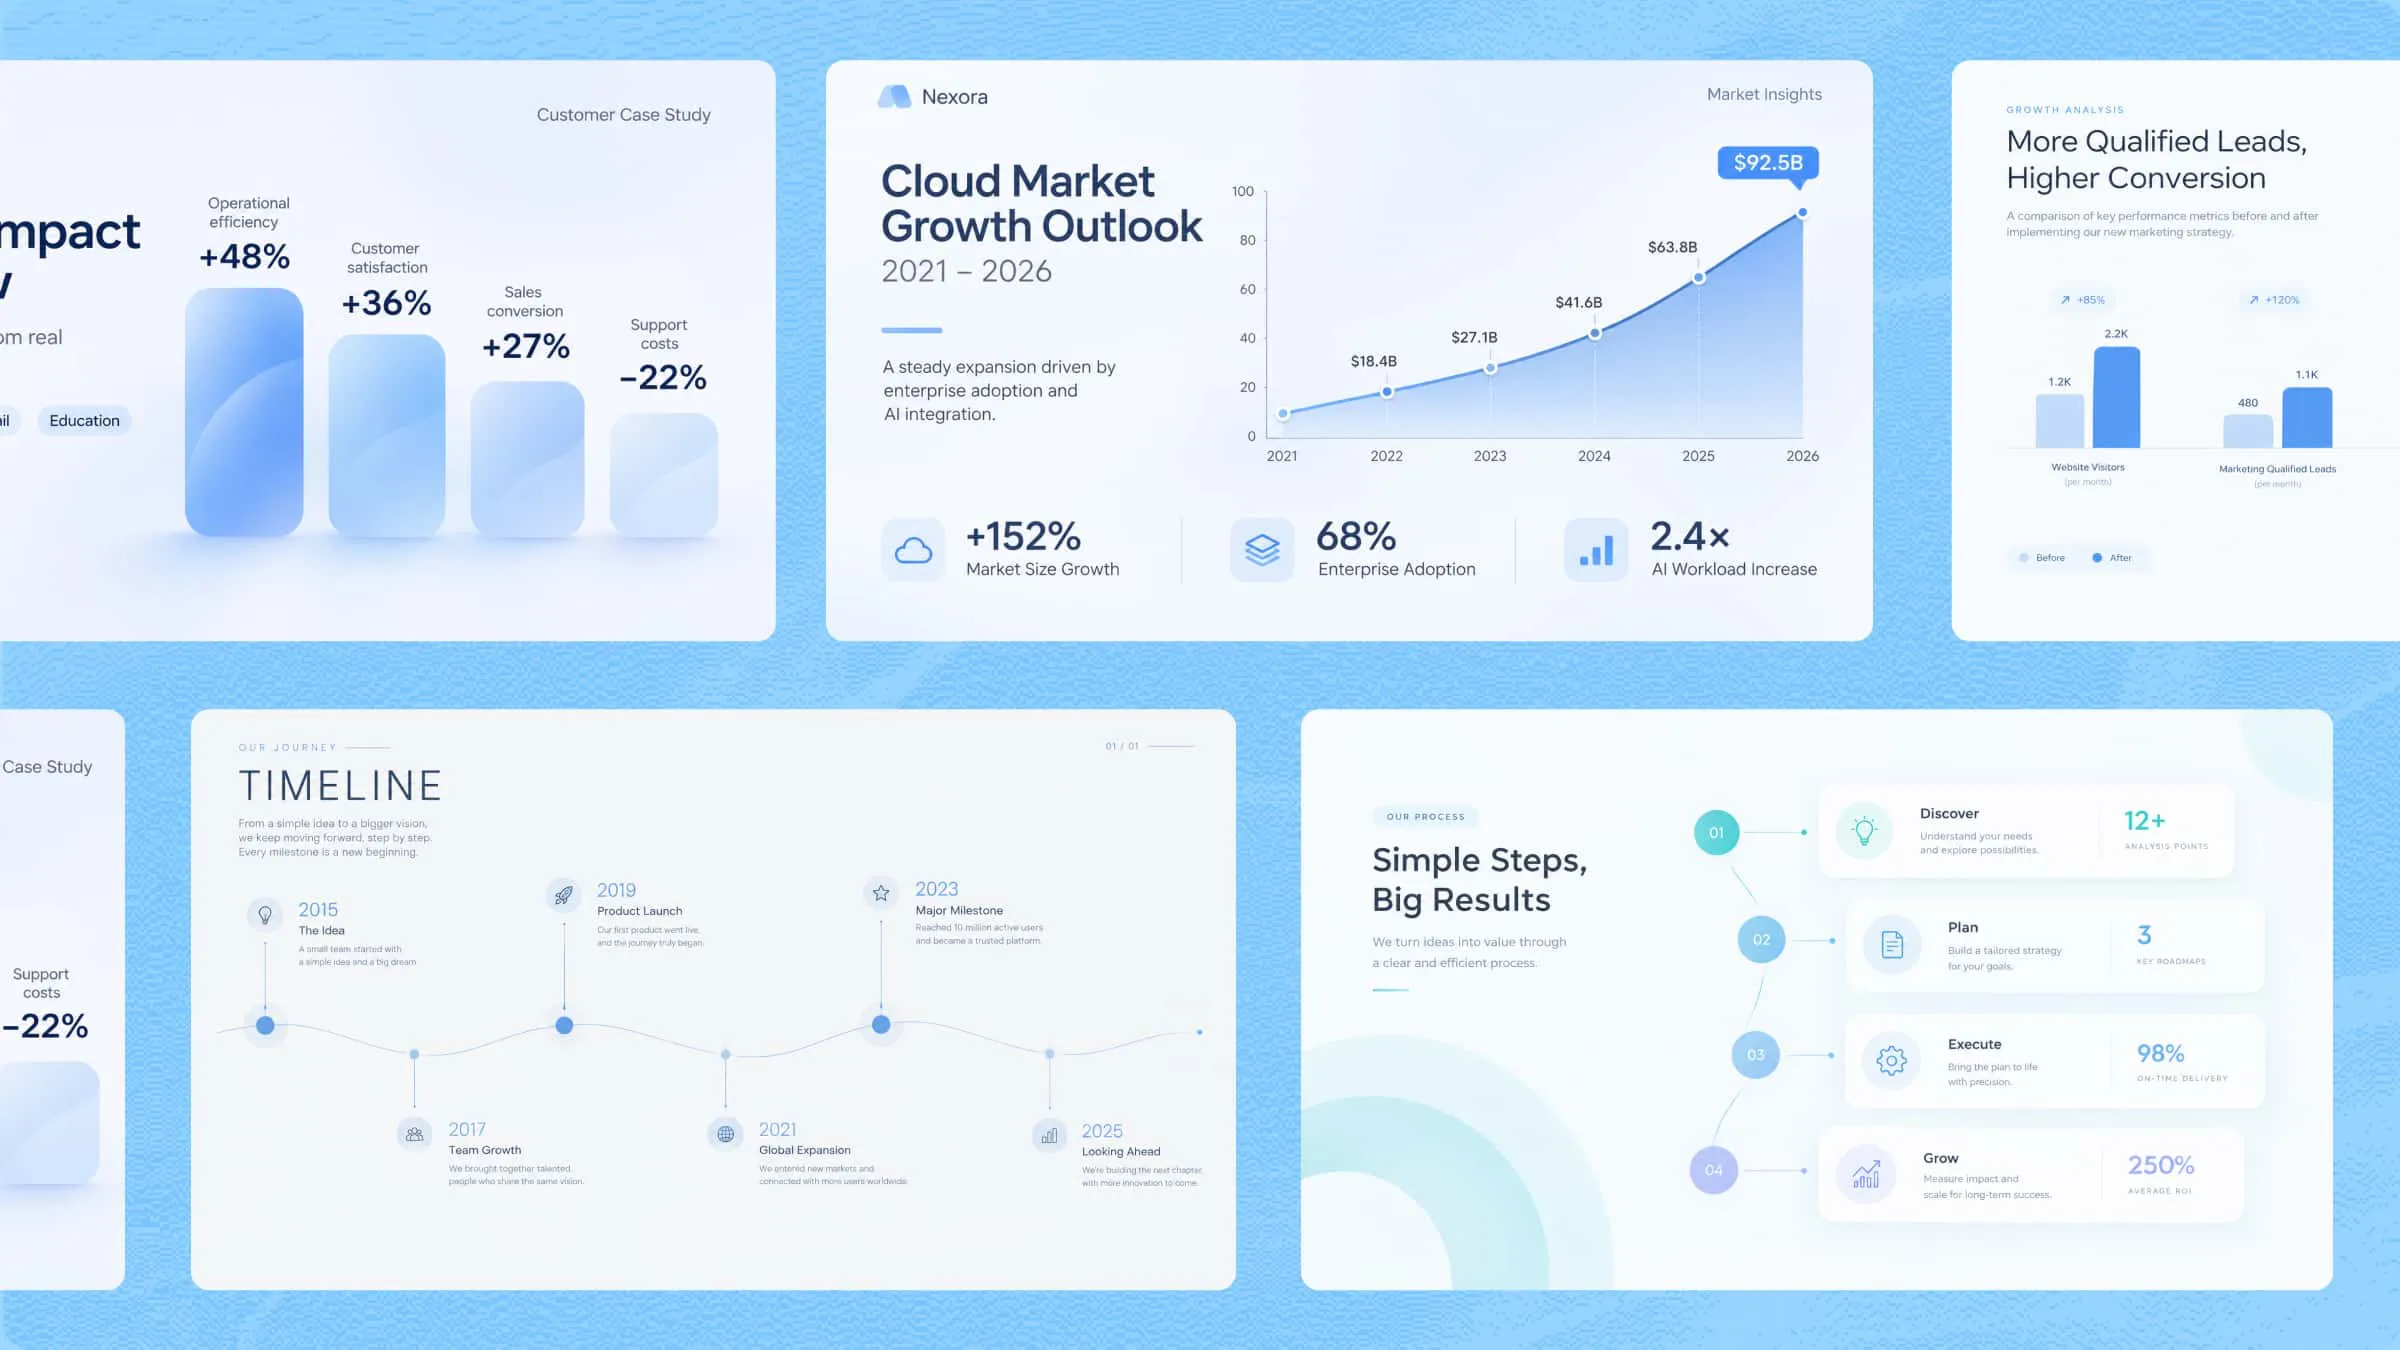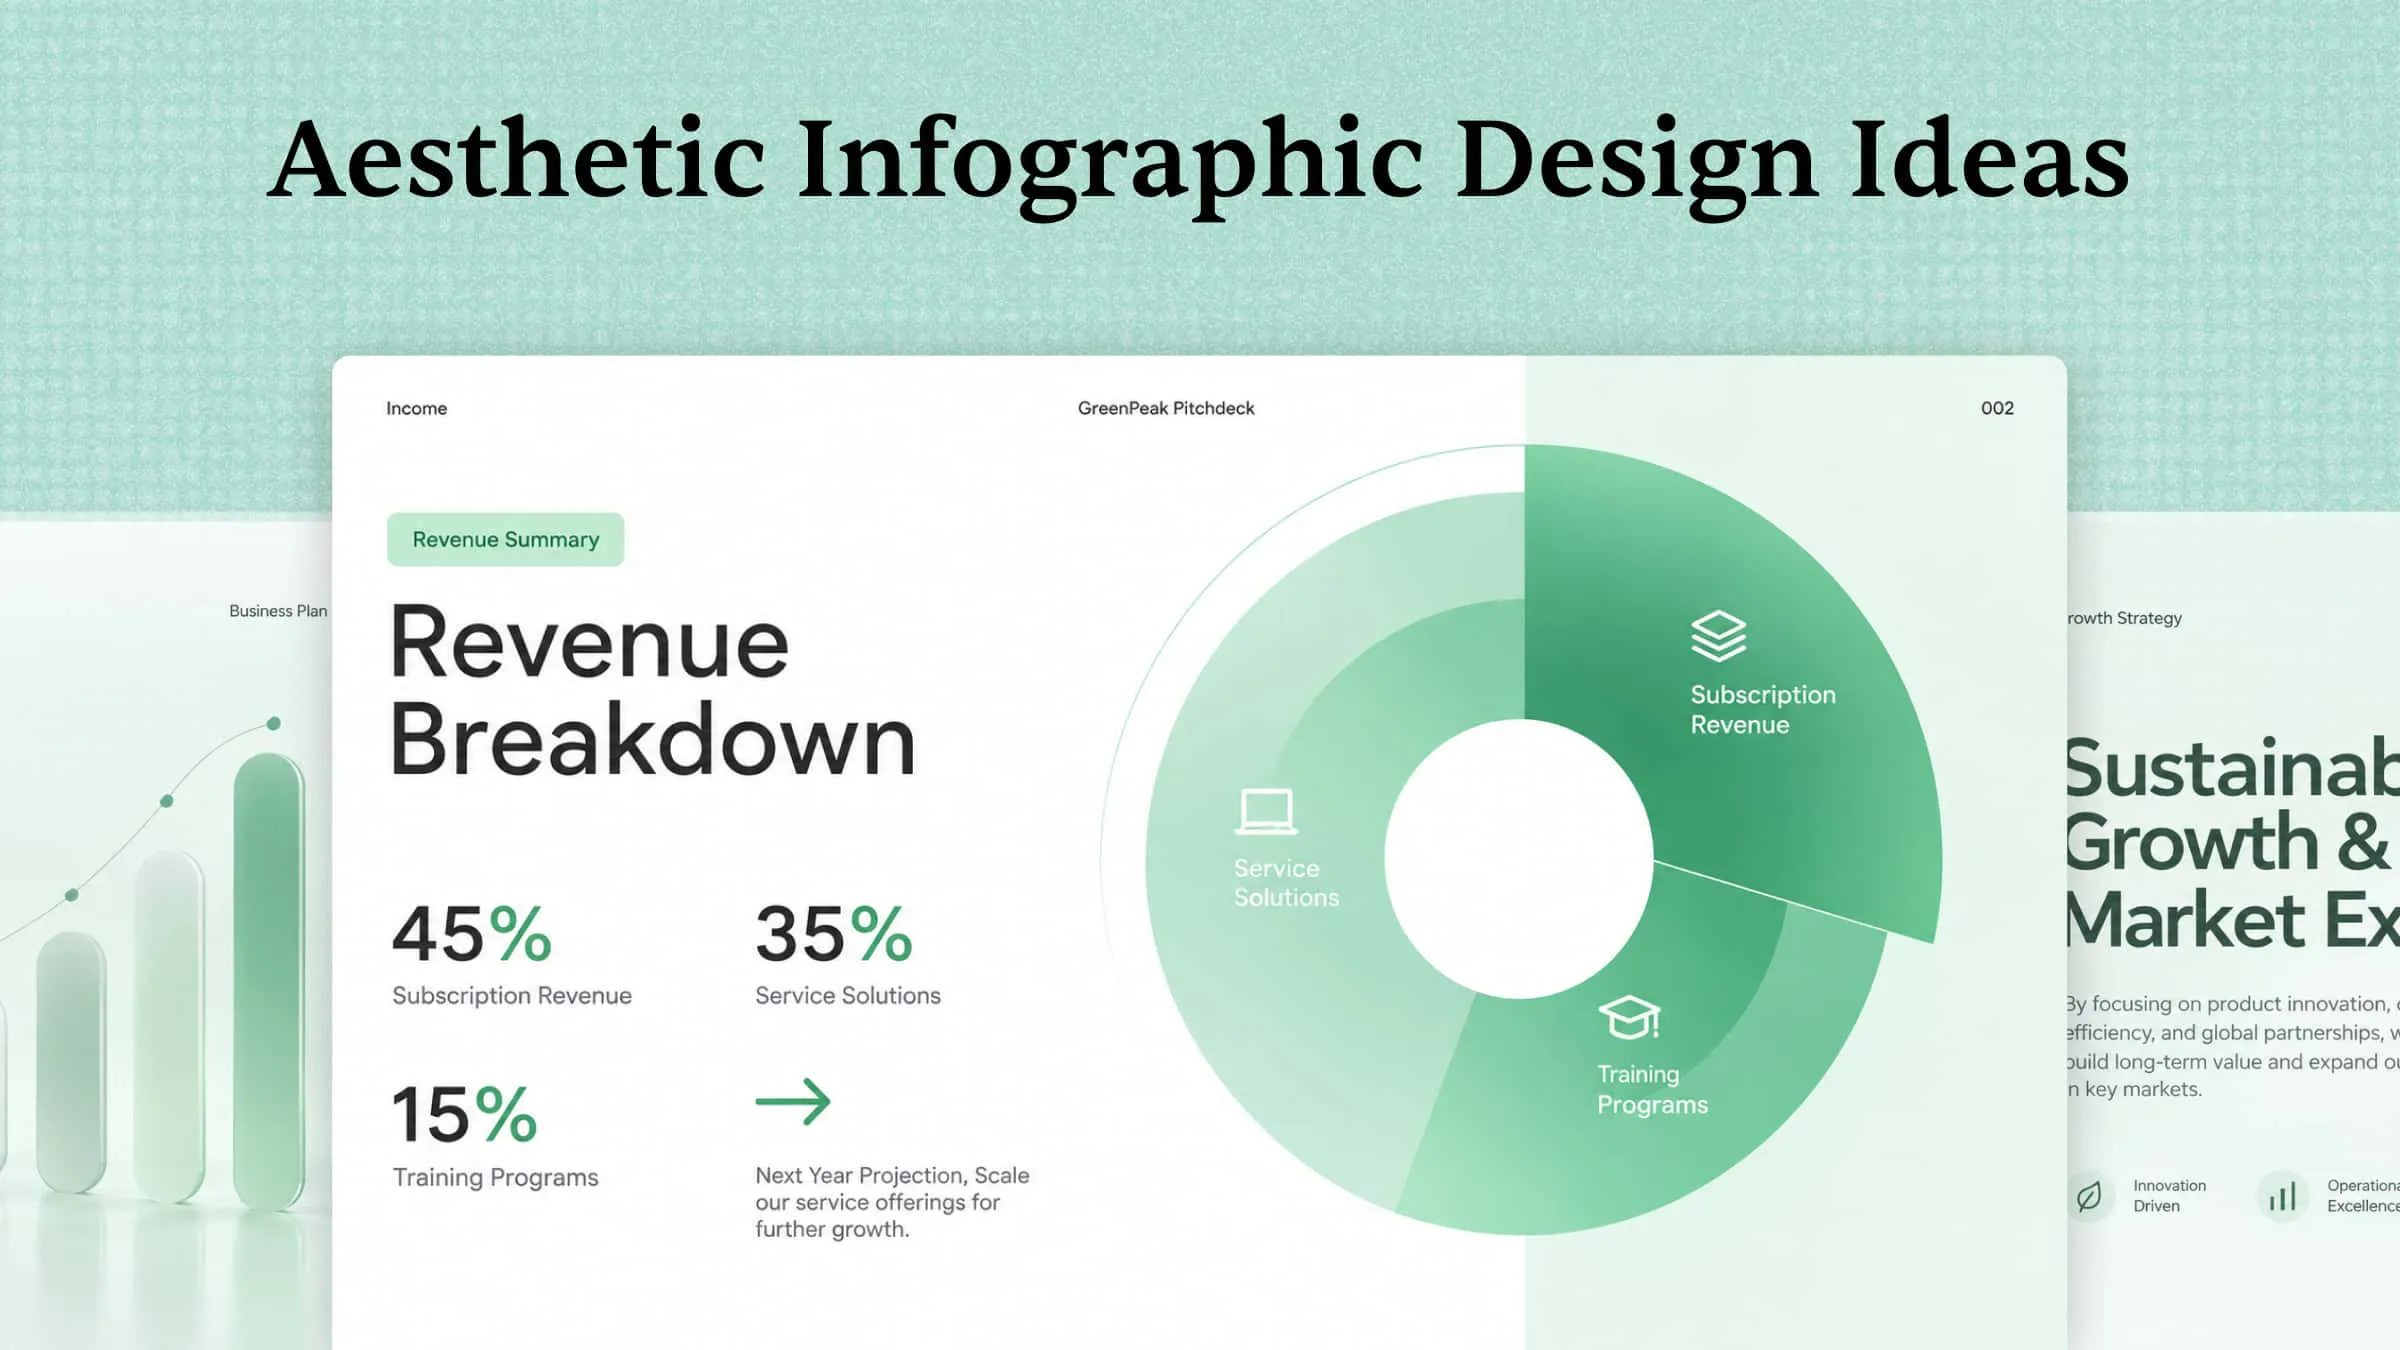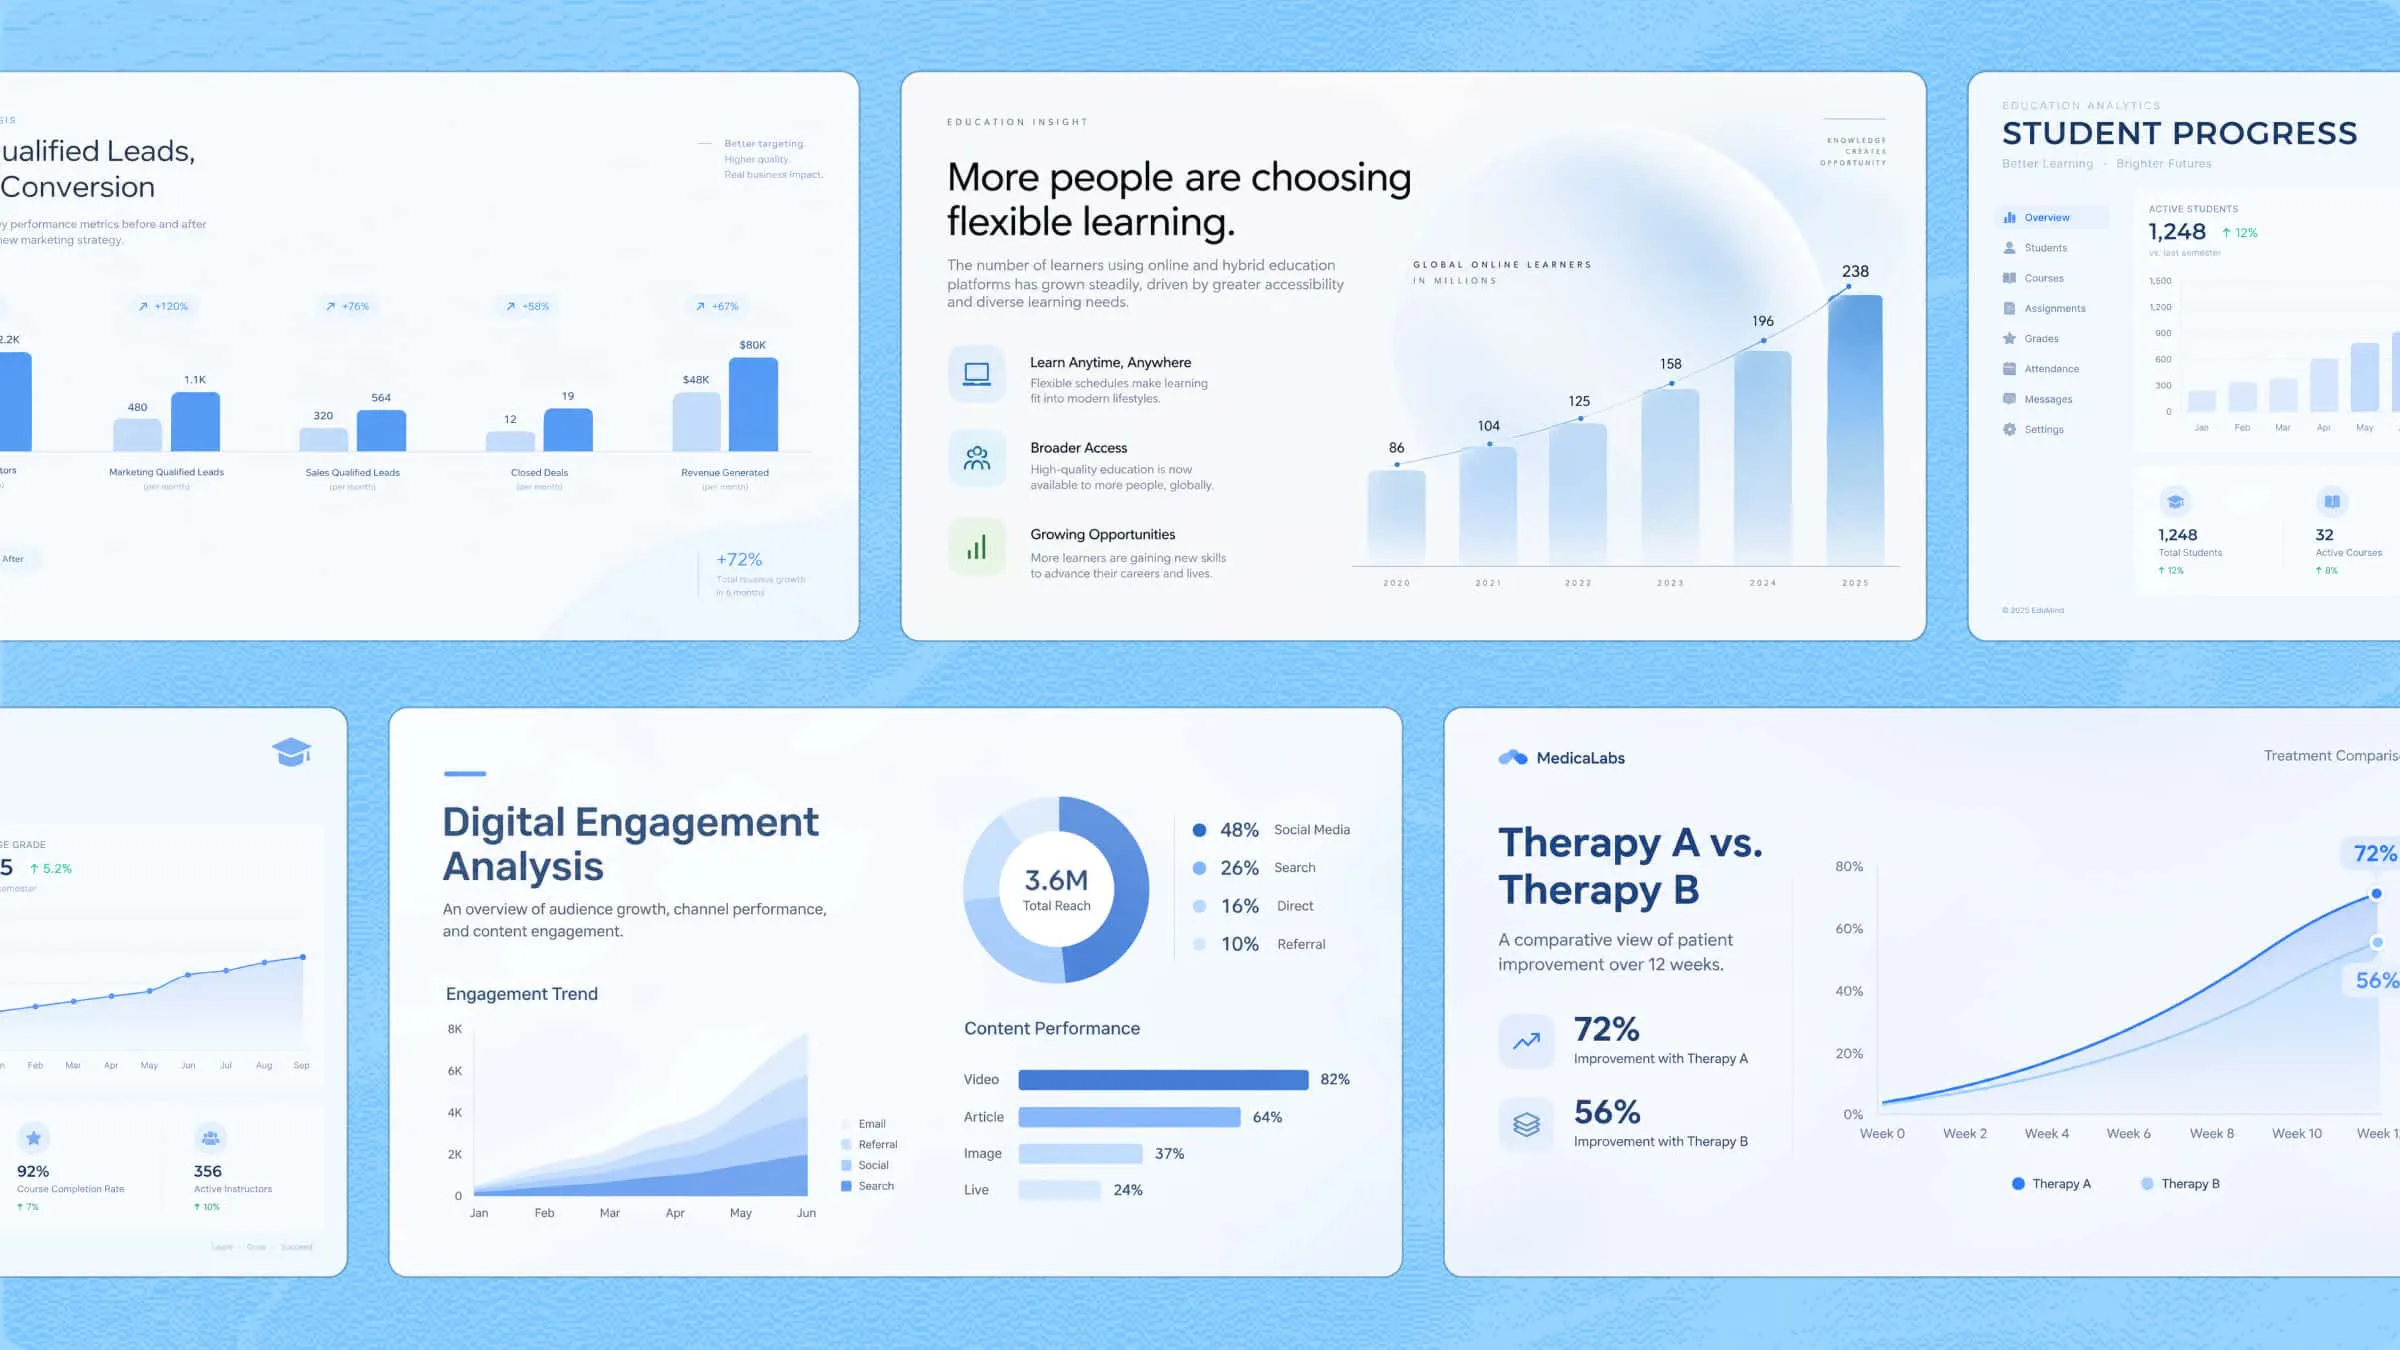
An effective infographic turns complex information into a visual story that readers can understand quickly. The right infographic tool can help you organize ideas, present data, and create engaging graphics without requiring advanced design skills. From AI-powered design platforms to specialized infographic creators, several options make the process easier. In this guide, we'll explore infographic creation tools that help you transform information into clear, visually appealing content.
Overview of 10 versatile tools to create infographics
Each infographic creator tool offers a different combination of design features, AI capabilities, customization options, and data visualization tools. Some focus on generating visuals from text prompts, while others provide ready-made templates, interactive elements, or advanced charting features. The following comparison highlights what each platform offers, its standout capabilities, and the types of users who may benefit from it.
| Tool | Primary use | Key features | Suitable for |
|---|---|---|---|
| Kimi Design | AI-generated visual content | Reference materials, flexible editing, multiple export formats | Content creators, marketers, educators |
| Canva | Template-based infographic design | Drag-and-drop editor, charts, templates, collaboration | Beginners, students, marketing teams |
| Venngage | Business and professional infographics | Templates, data visualization, accessibility, branding | Businesses, educators, organizations |
| Piktochart | Converting documents into infographics | Document uploads, customizable layouts, visual editing | Students, researchers, professionals |
| Visme | Data-driven and interactive visuals | Charts, graphs, animations, branding tools | Businesses, marketers, data analysts |
| Infogram | Statistical infographics and data visualization | Interactive charts, maps, data imports, dashboards | Journalists, researchers, analysts |
| Adobe Express | Quick graphic and infographic design | Templates, design assets, image editing, resizing | Beginners, small businesses, creators |
| Genially | Interactive infographics | Clickable elements, animations, multimedia, templates | Educators, trainers, marketers |
| Datawrapper | Charts, maps, and data visualization | Responsive charts, interactive maps, data tables | Journalists, researchers, analysts |
| Napkin AI | Turning written content into visuals | Diagrams, flowcharts, timelines, editable graphics | Writers, educators, business professionals |
10 infographic tools to create visuals in 2026
Here is a breakdown of 10 infographic tools, highlighting their key features and the types of users or projects each one is best suited for.
Kimi Design
Kimi Design is an AI design generator that helps turn ideas and reference materials into visual content, including infographics, posters, and social media graphics. Instead of arranging every element manually, you can describe the design you need and refine the results using prompts or direct editing. It also features a flexible canvas and editable design elements, which makes it useful for creating visuals for presentations, reports, educational materials, and marketing content.
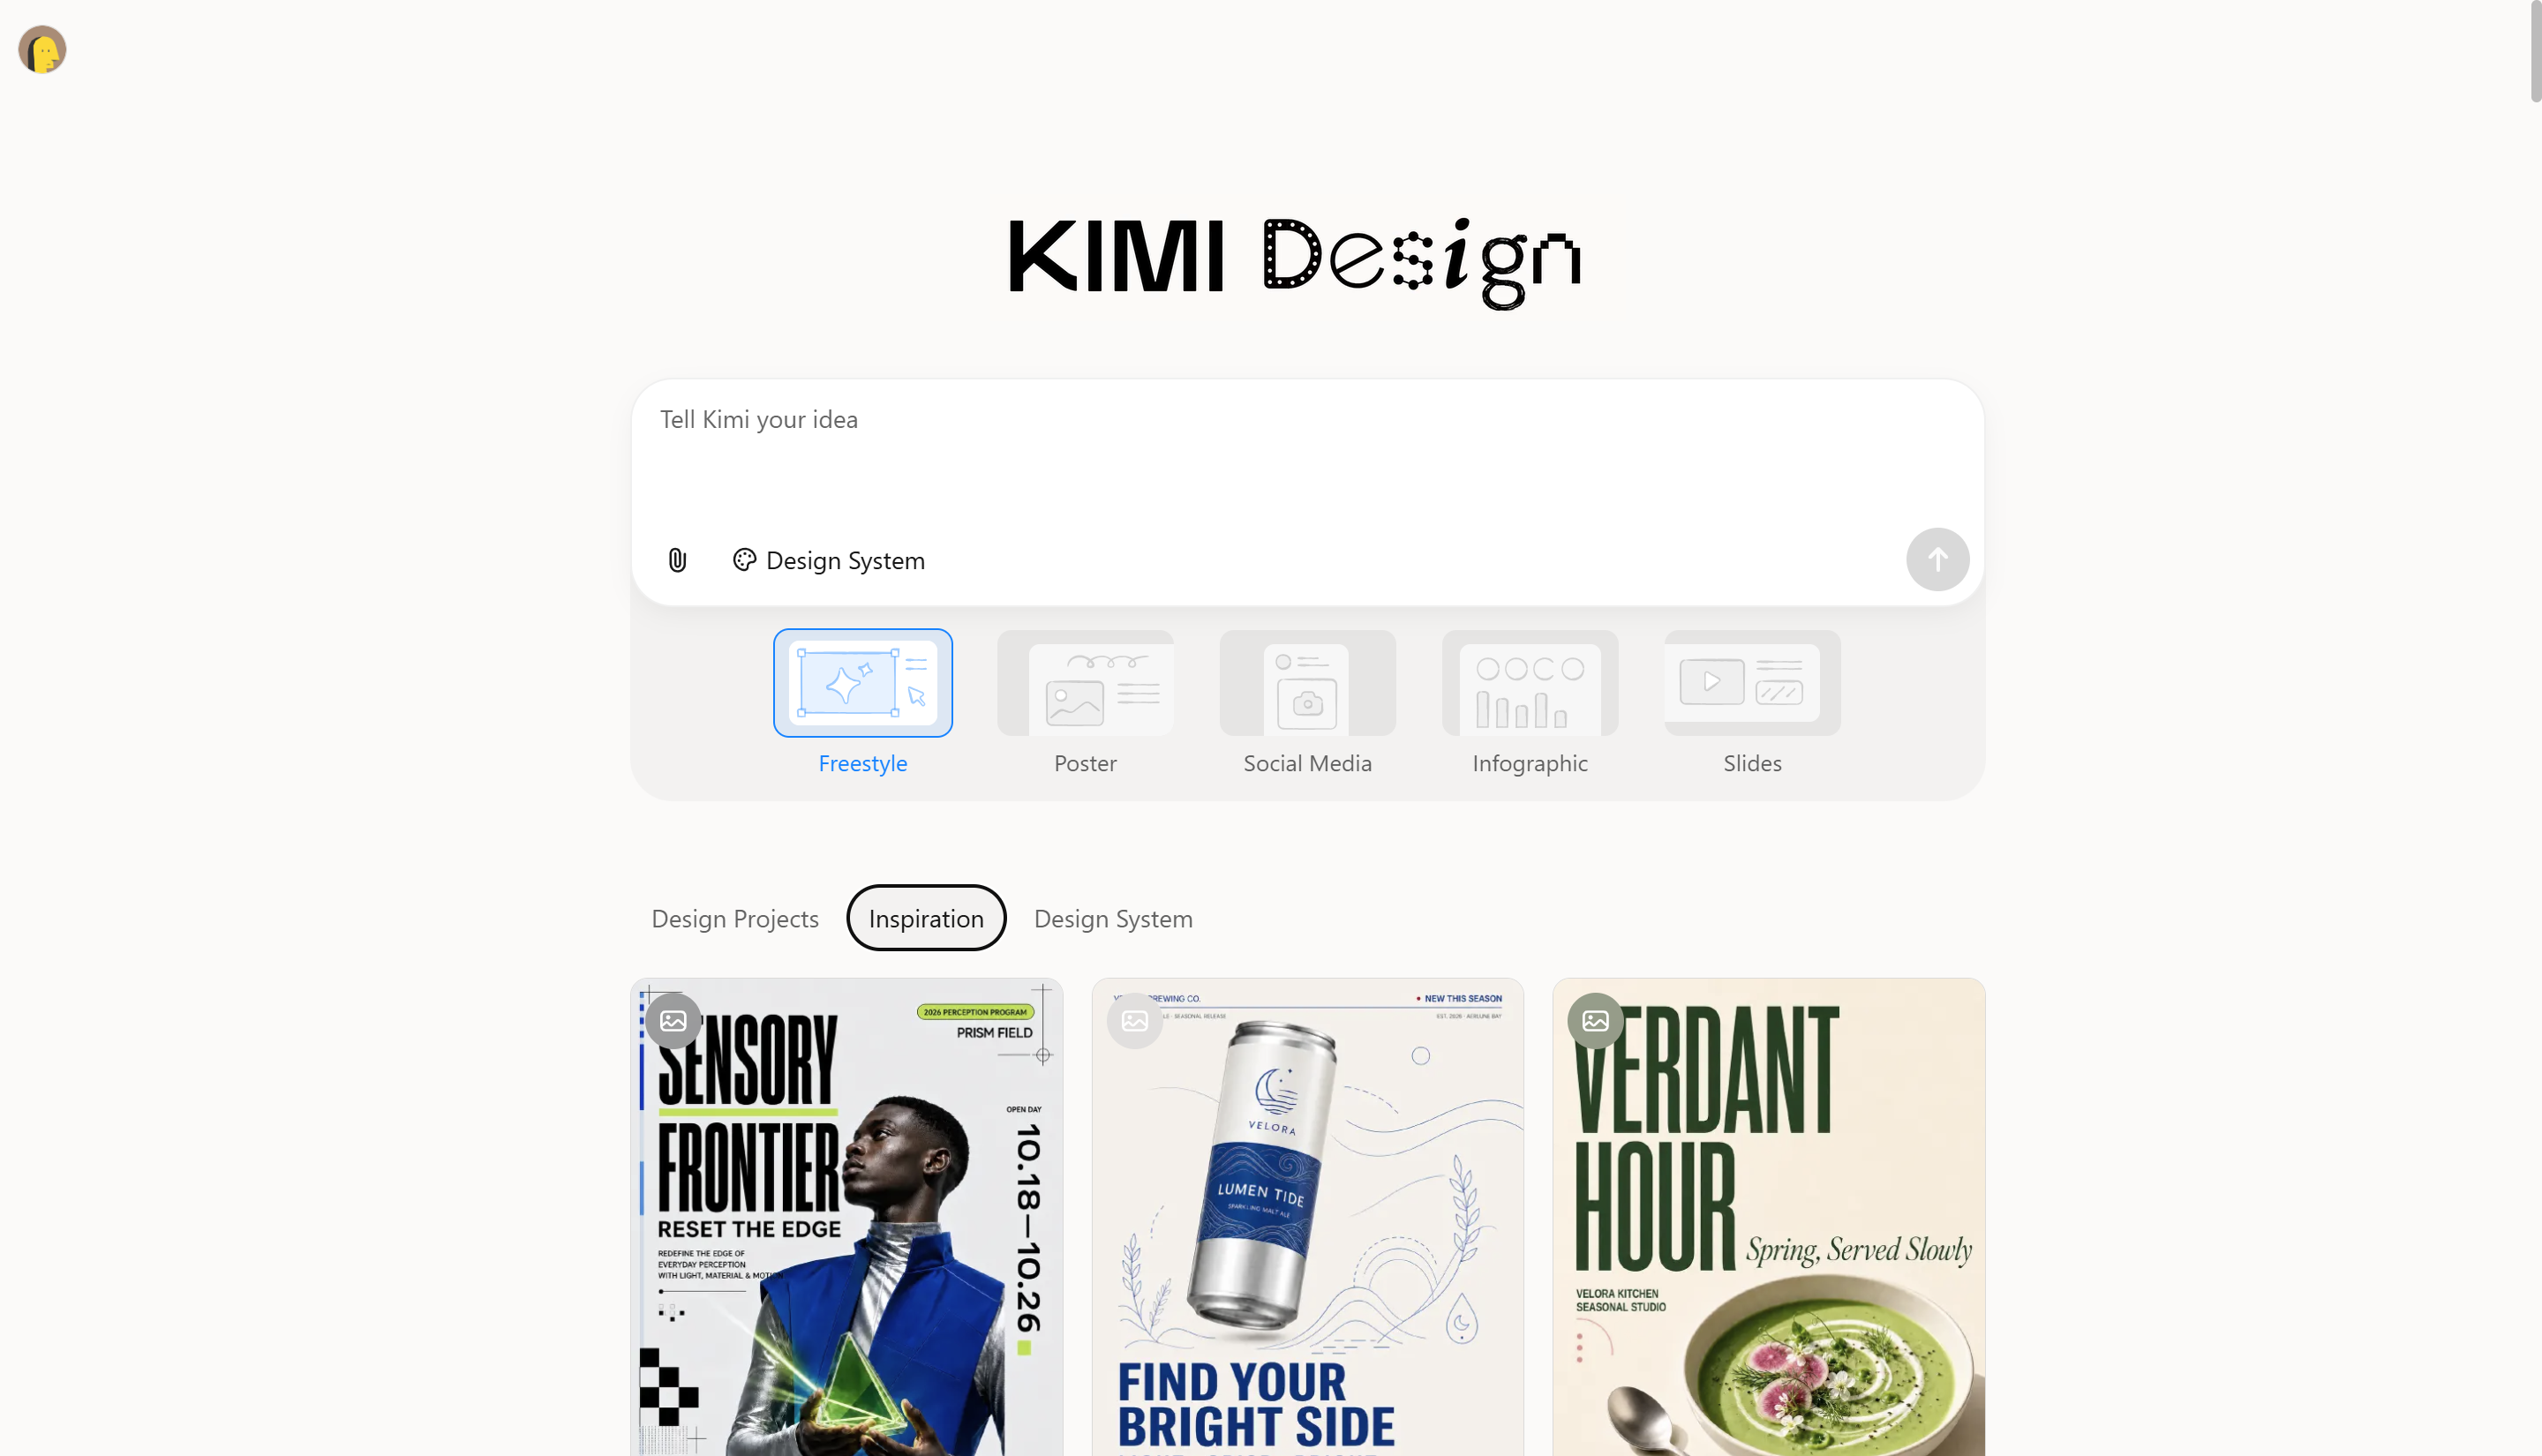
Main features
Create infographics from prompts and reference materials
Describe your topic, target audience, and main message in a text prompt, or upload documents, spreadsheets, and images for context. Kimi Design organizes your content into an infographic with clear headings, relevant visuals, and a structured layout.
Multiple infographic formats and layout options
Choose from different infographic structures to suit your content, including flowcharts, timelines, comparison charts, and data visualizations. Kimi Design helps present processes, key milestones, differences, and statistics in layouts that make information easier to scan and understand.
Customize infographic details through flexible editing
Refine text, colors, layouts, and visual elements with natural-language prompts. Use comments to target specific elements or edit them manually, giving you control over the final design.
Export infographics for different uses
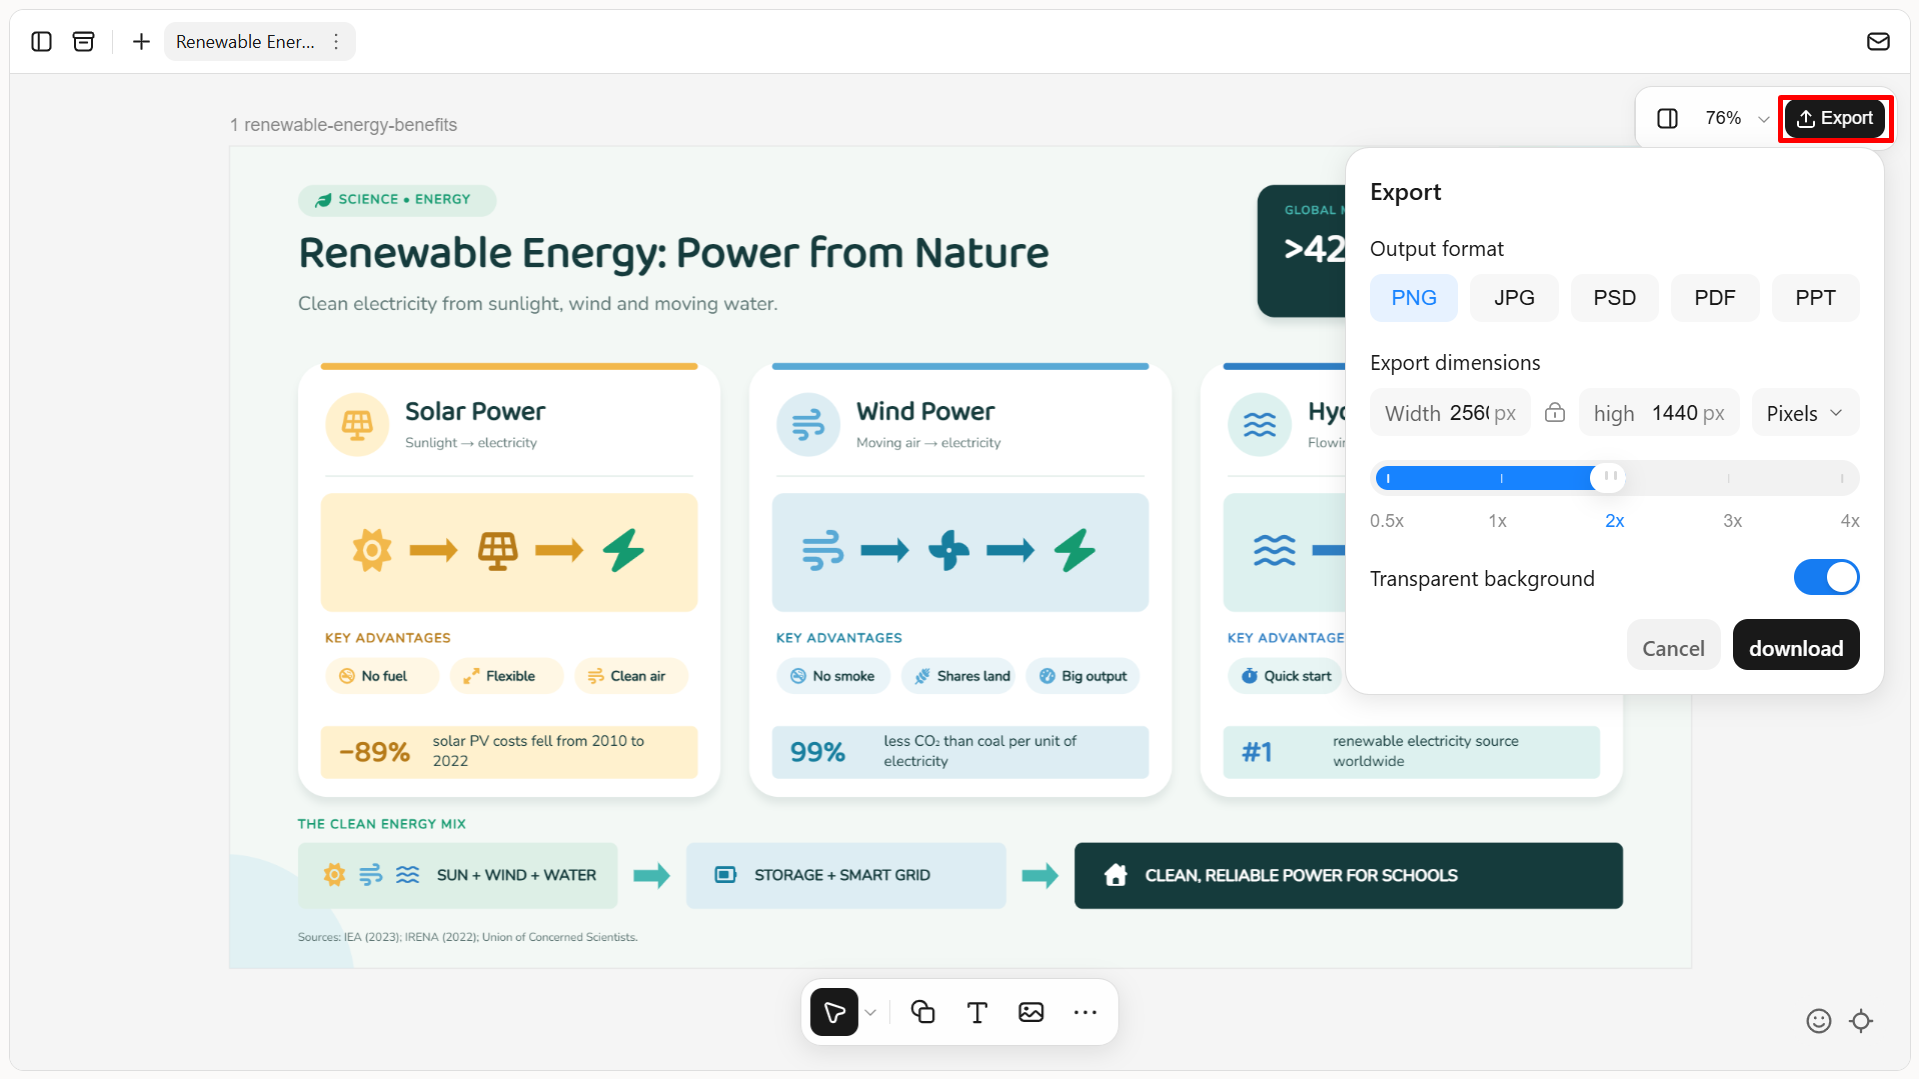
Export your infographics in PNG, JPG, PSD, PDF, or Slides format for use in presentations, reports, websites, social media, and learning materials. Customize PNG and JPG export sizes in pixels or centimeters, with a transparent background option for PNG. PSD preserves all editing states and layer data, making it easier to share your designs and continue refining them later.
Suitable for
Content creators and social media managers: Create infographics, promotional graphics, and visual posts for social media platforms, blogs, and digital campaigns.
Marketers and business teams: Turn product information, campaign results, business metrics, and marketing insights into clear visuals for presentations, reports, and promotional materials.
Educators and students: Develop educational infographics, lesson materials, visual explanations, and project presentations that make complex topics easier to understand.
Researchers and professionals: Organize research findings, survey results, statistics, and technical information into structured infographics for reports and presentations.
Small businesses and entrepreneurs: Create product showcases, service introductions, brand visuals, and customer-facing materials without having to build every design element from scratch.
How to make an infographic with Kimi Design
Kimi Design provides a straightforward way to move from an idea to a finished visual. The following steps explain how to create an infographic using a text prompt and refine it for your intended audience.
Step 1: Enter a clear prompt
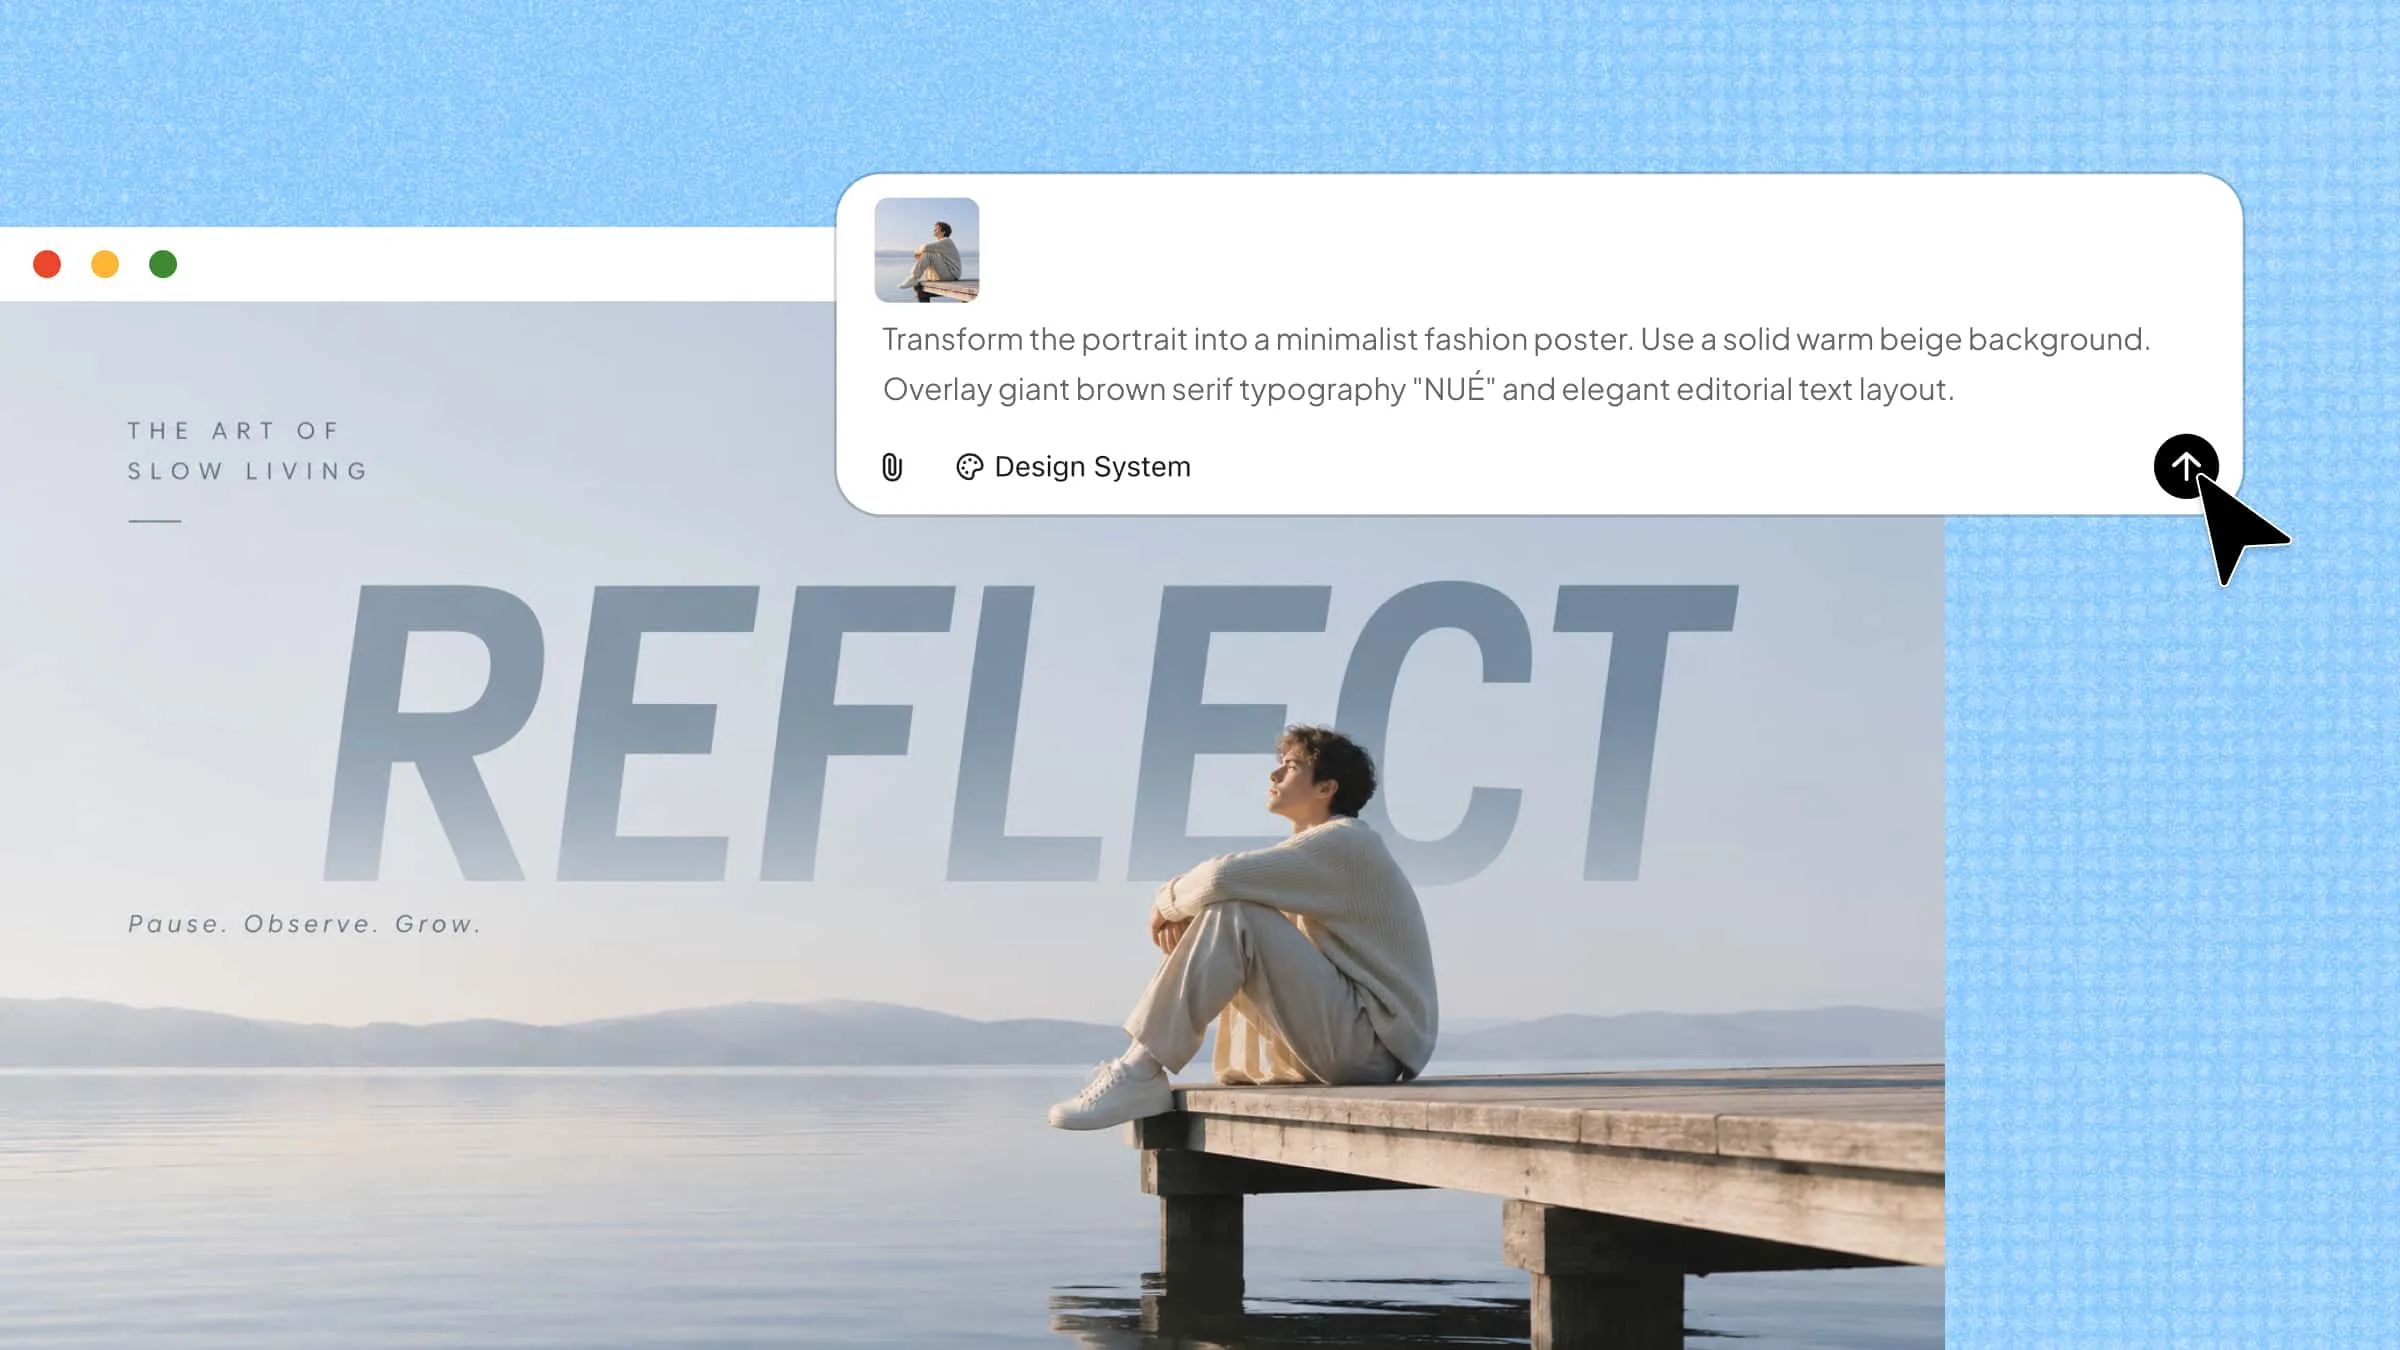
Open Kimi Design and describe the infographic you want to create. Include the topic, target audience, key information, preferred visual style, and layout.
Example Prompt
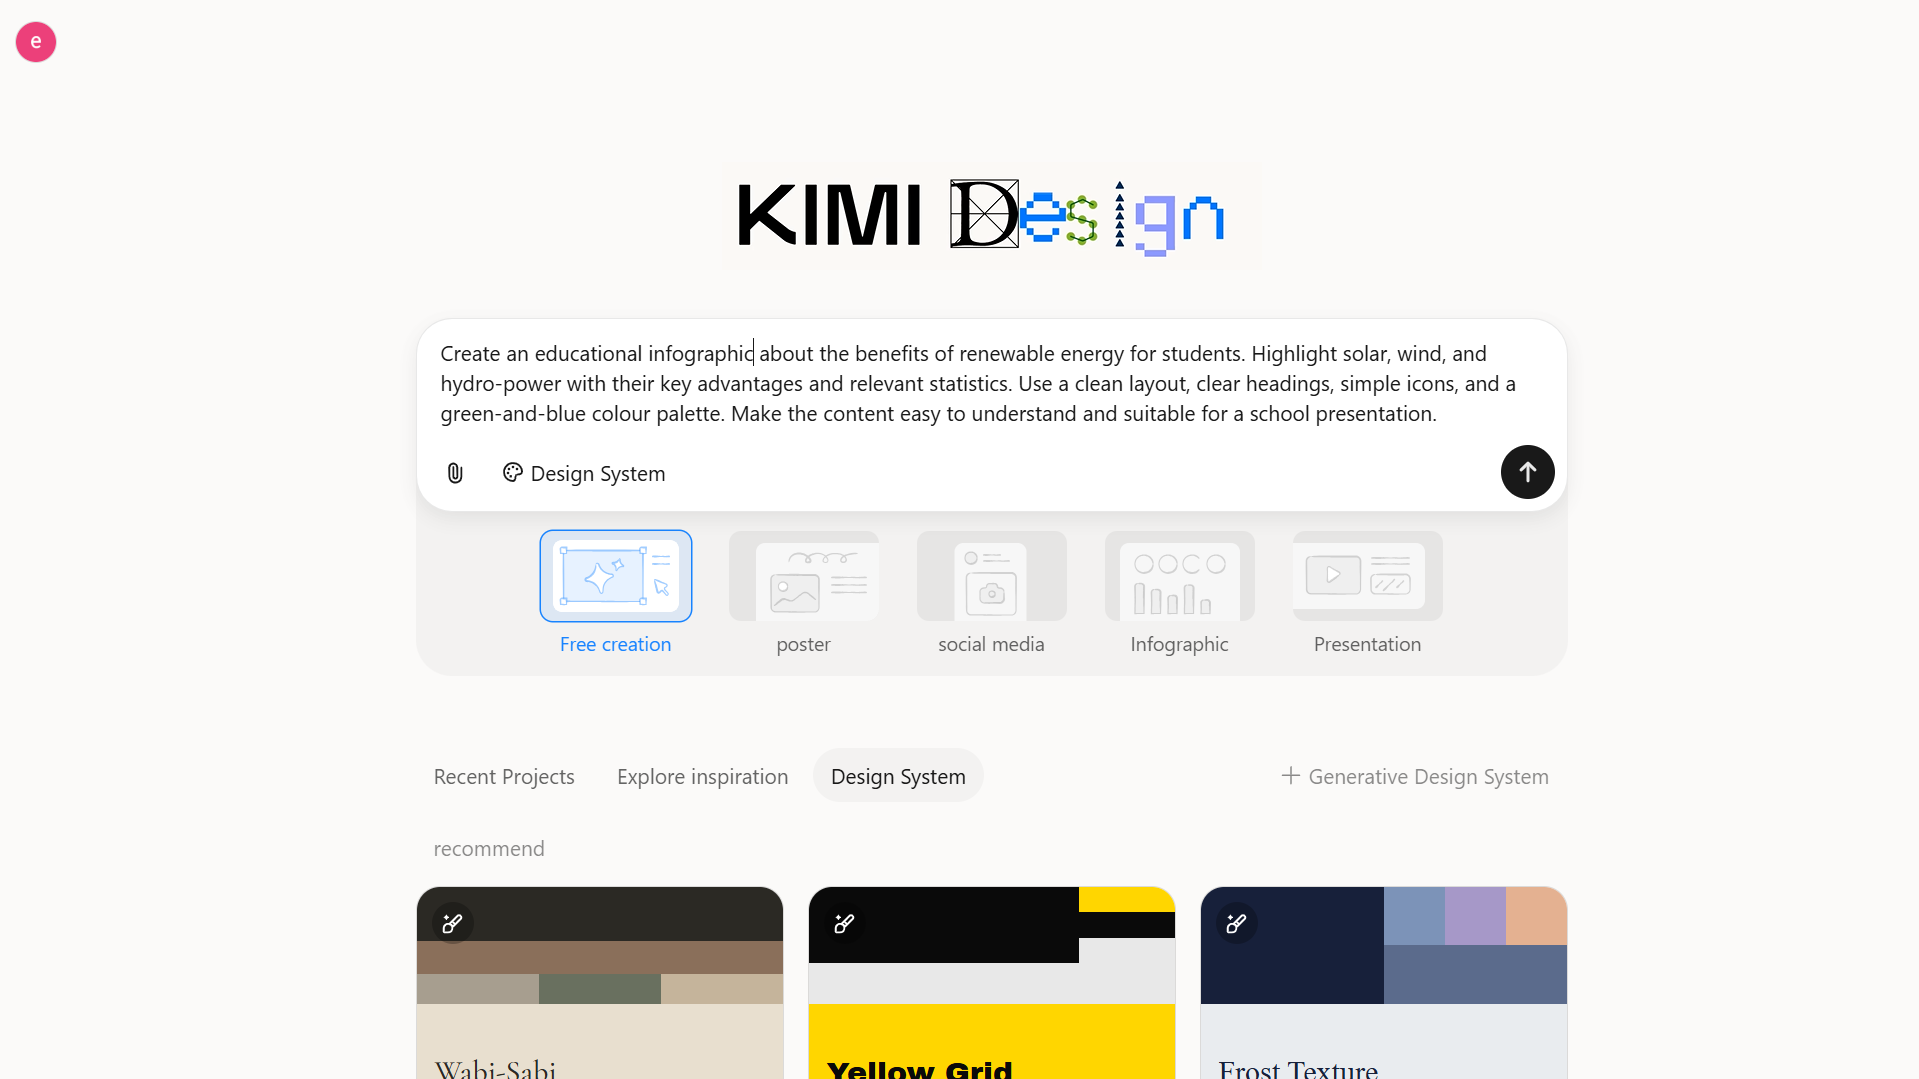
Step 2: Edit your infographic
Once Kimi Design generates the initial design, review the layout, headings, text, and visual elements. If the infographic needs improvement, use natural-language prompts or comments to request specific changes.
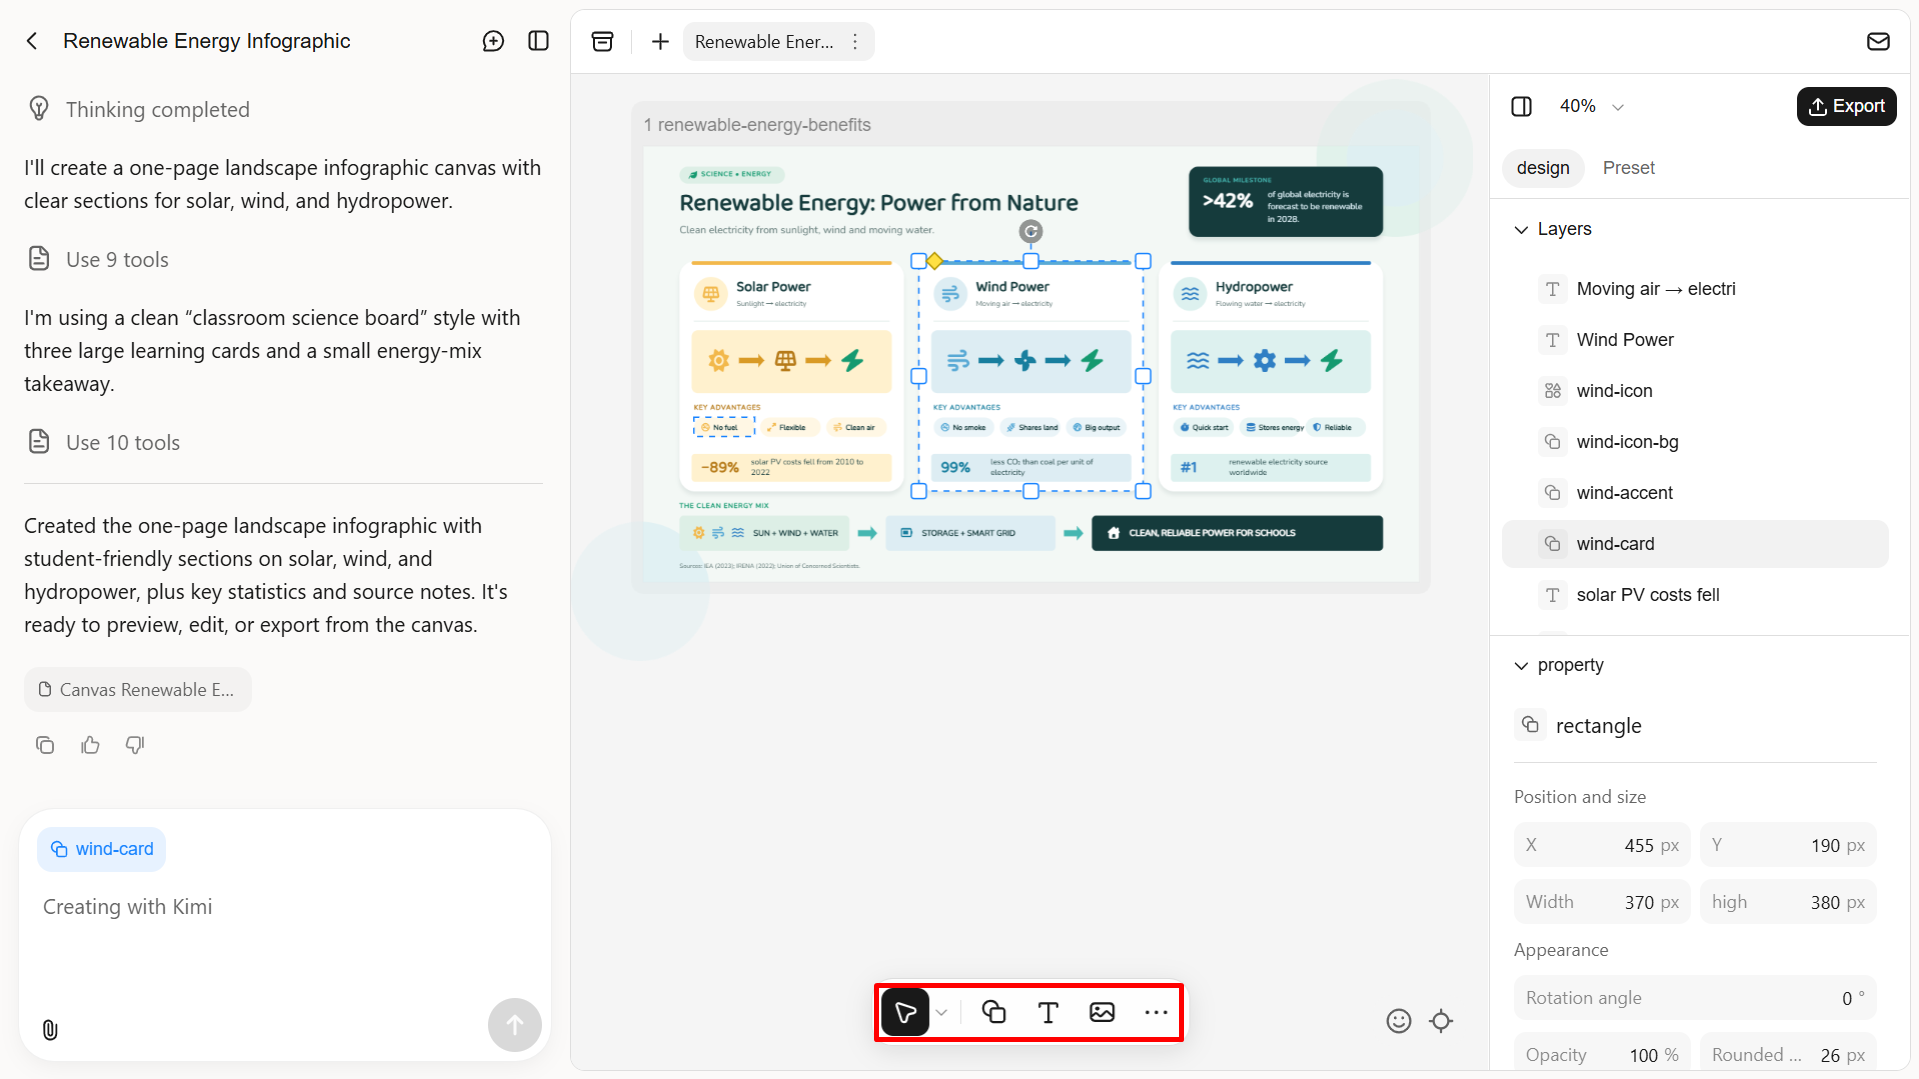
Step 3: Review and export the file
Check the infographic for clear messaging, consistent layout, accurate information, and spelling errors. Make any necessary corrections, then download the final design in PNG, JPG, PSD, PDF, or PPT format.
Canva
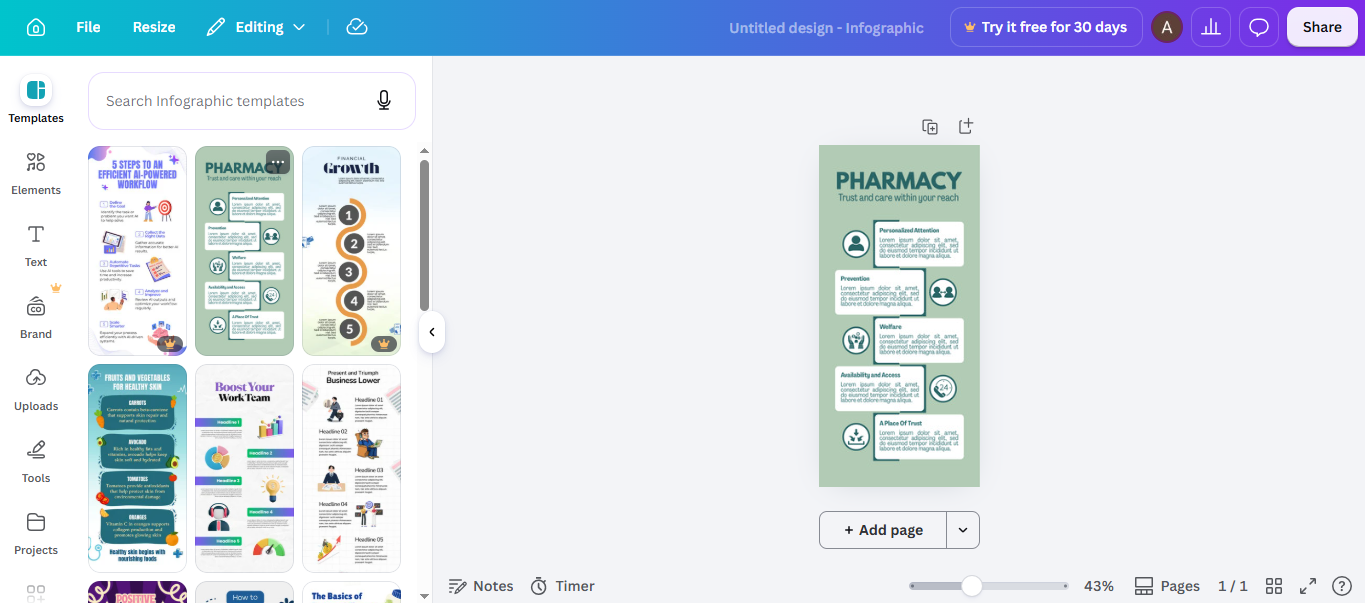
Canva is an online graphic design platform that allows users to create infographics, presentations, social media graphics, and other visual content. Its infographic maker includes ready-made templates, customizable charts, and a drag-and-drop editor. You can start with a template or create a design from scratch, then adjust its layout, colors, text, and visual elements to match your content.
Main features
Customizable infographic templates: Choose from ready-made templates for timelines, comparisons, and more. Replace the sample text and visuals with your own information.
Charts and graphs: Present numerical information using more than 20 types of customizable charts and graphs. Add your data to highlight comparisons, trends, and statistical findings.
Drag-and-drop design elements: Add icons, illustrations, stickers, shapes, and images to your infographic. Arrange these elements on the canvas and adjust their appearance.
Collaboration and sharing: Invite team members to work on the same design, review changes, and share feedback. Export the finished infographic for publishing or use in other content.
Suitable for
Beginners creating infographics without professional design experience.
Students and educators preparing educational visuals.
Marketers designing social media graphics and promotional content.
Teams collaborating on presentations and business reports.
Venngage
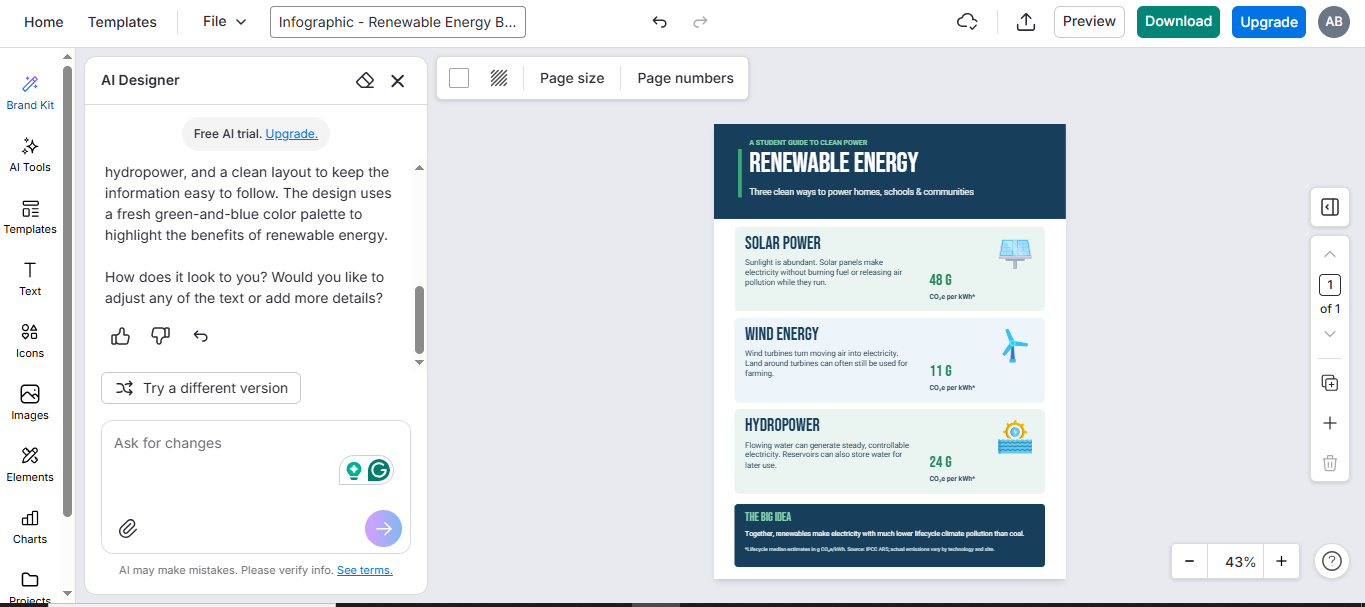
Venngage is a visual design platform that specializes in infographics, business reports, presentations, and data-driven graphics. This infographic creator combines customizable templates, AI-powered generation, and data visualization features to help users present information clearly. You can create designs for different purposes, from statistical reports and business processes to educational and marketing content.
Main features
AI infographic generation: Describe your topic in a prompt to generate an initial infographic design. Then you can customize the content to match your requirements.
Professionally designed templates: Choose from templates for statistical infographics, timelines, and more. Edit the text, colors, fonts, and backgrounds to suit your subject.
Accessible design tools: Add alternative text to images, check color contrast, and adjust the reading order to make your infographics easier to access.
Data visualization and branding: Import data from CSV or XLSX files and present it through charts, maps, and tables. Apply your brand colors, fonts, and logos to maintain a consistent visual identity.
Suitable for
Business professionals creating reports and statistical infographics.
Marketing teams preparing branded visual content.
Educators developing accessible learning materials.
Organizations presenting research findings and business processes.
Piktochart
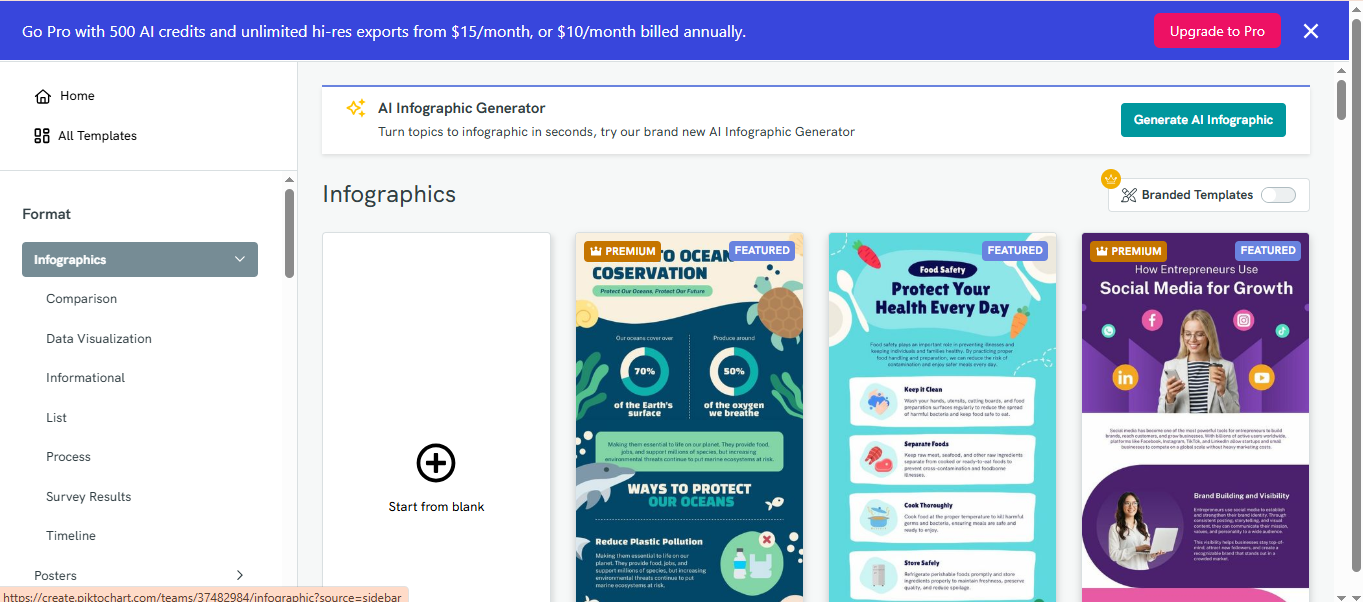
Piktochart is an online visual communication platform for turning written information and data into engaging graphics. It can generate visual content from text prompts and uploaded documents, while offering a range of layouts and customizable design elements. Users can create infographics for educational, business, and marketing purposes.
Main features
AI-powered infographic creation: Enter a topic, paste written content, or upload a supported document to generate an infographic.
Multiple infographic layouts: Choose formats such as lists, comparisons, timelines, and charts.
Content and design customization: Edit text, headings, colors, images, icons, fonts, and layouts in the built-in editor. Apply brand colors and refine the design before publishing.
Document-to-infographic conversion: Upload supported TXT, DOCX, or text-based PDF files to turn lengthy information into visual content.
Suitable for
Students converting research material into visual summaries.
Educators creating educational infographics and learning resources.
Marketers transforming reports into shareable graphics.
Professionals presenting information from documents and written reports.
Visme
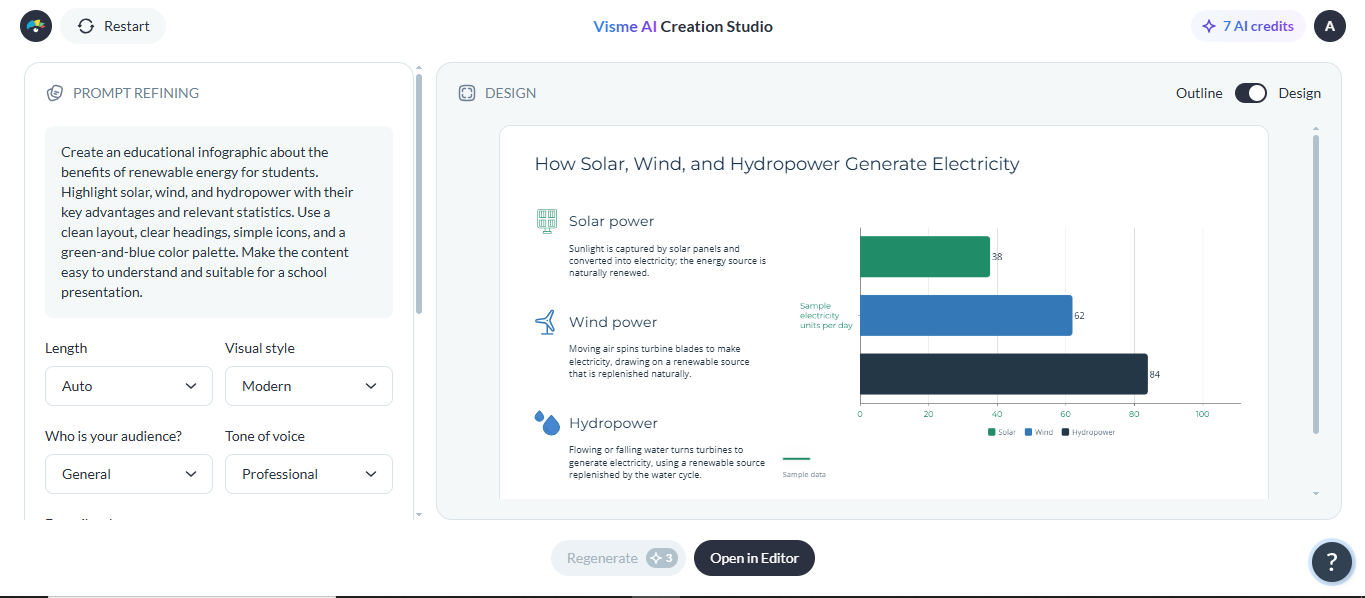
Visme is a visual content creation platform that supports infographics, presentations, reports, and data visualizations. It combines customizable templates, charts, and interactive design elements to help users communicate complex information. Among the available infographic creation tools, Visme stands out for its combination of data visualization, branding, and interactive content features.
Main features
Pre-designed infographic templates: Choose a template that suits your content, then customize its text, fonts, colors, and layout to create a cohesive design.
Customizable charts and graphs: Add bar charts, pie charts, line graphs, donut charts, and other visualizations. Then adjust chart settings to highlight important findings.
Interactive and animated elements: Add animations and hover effects to highlight key information and make infographics more engaging.
Branding and design customization: Apply your brand colors, fonts, and logo, then adjust individual elements to create a consistent design.
Suitable for
Businesses creating branded reports and presentations.
Data analysts presenting statistics and research findings.
Marketers preparing interactive promotional visuals.
Educators designing informative learning materials.
Infogram
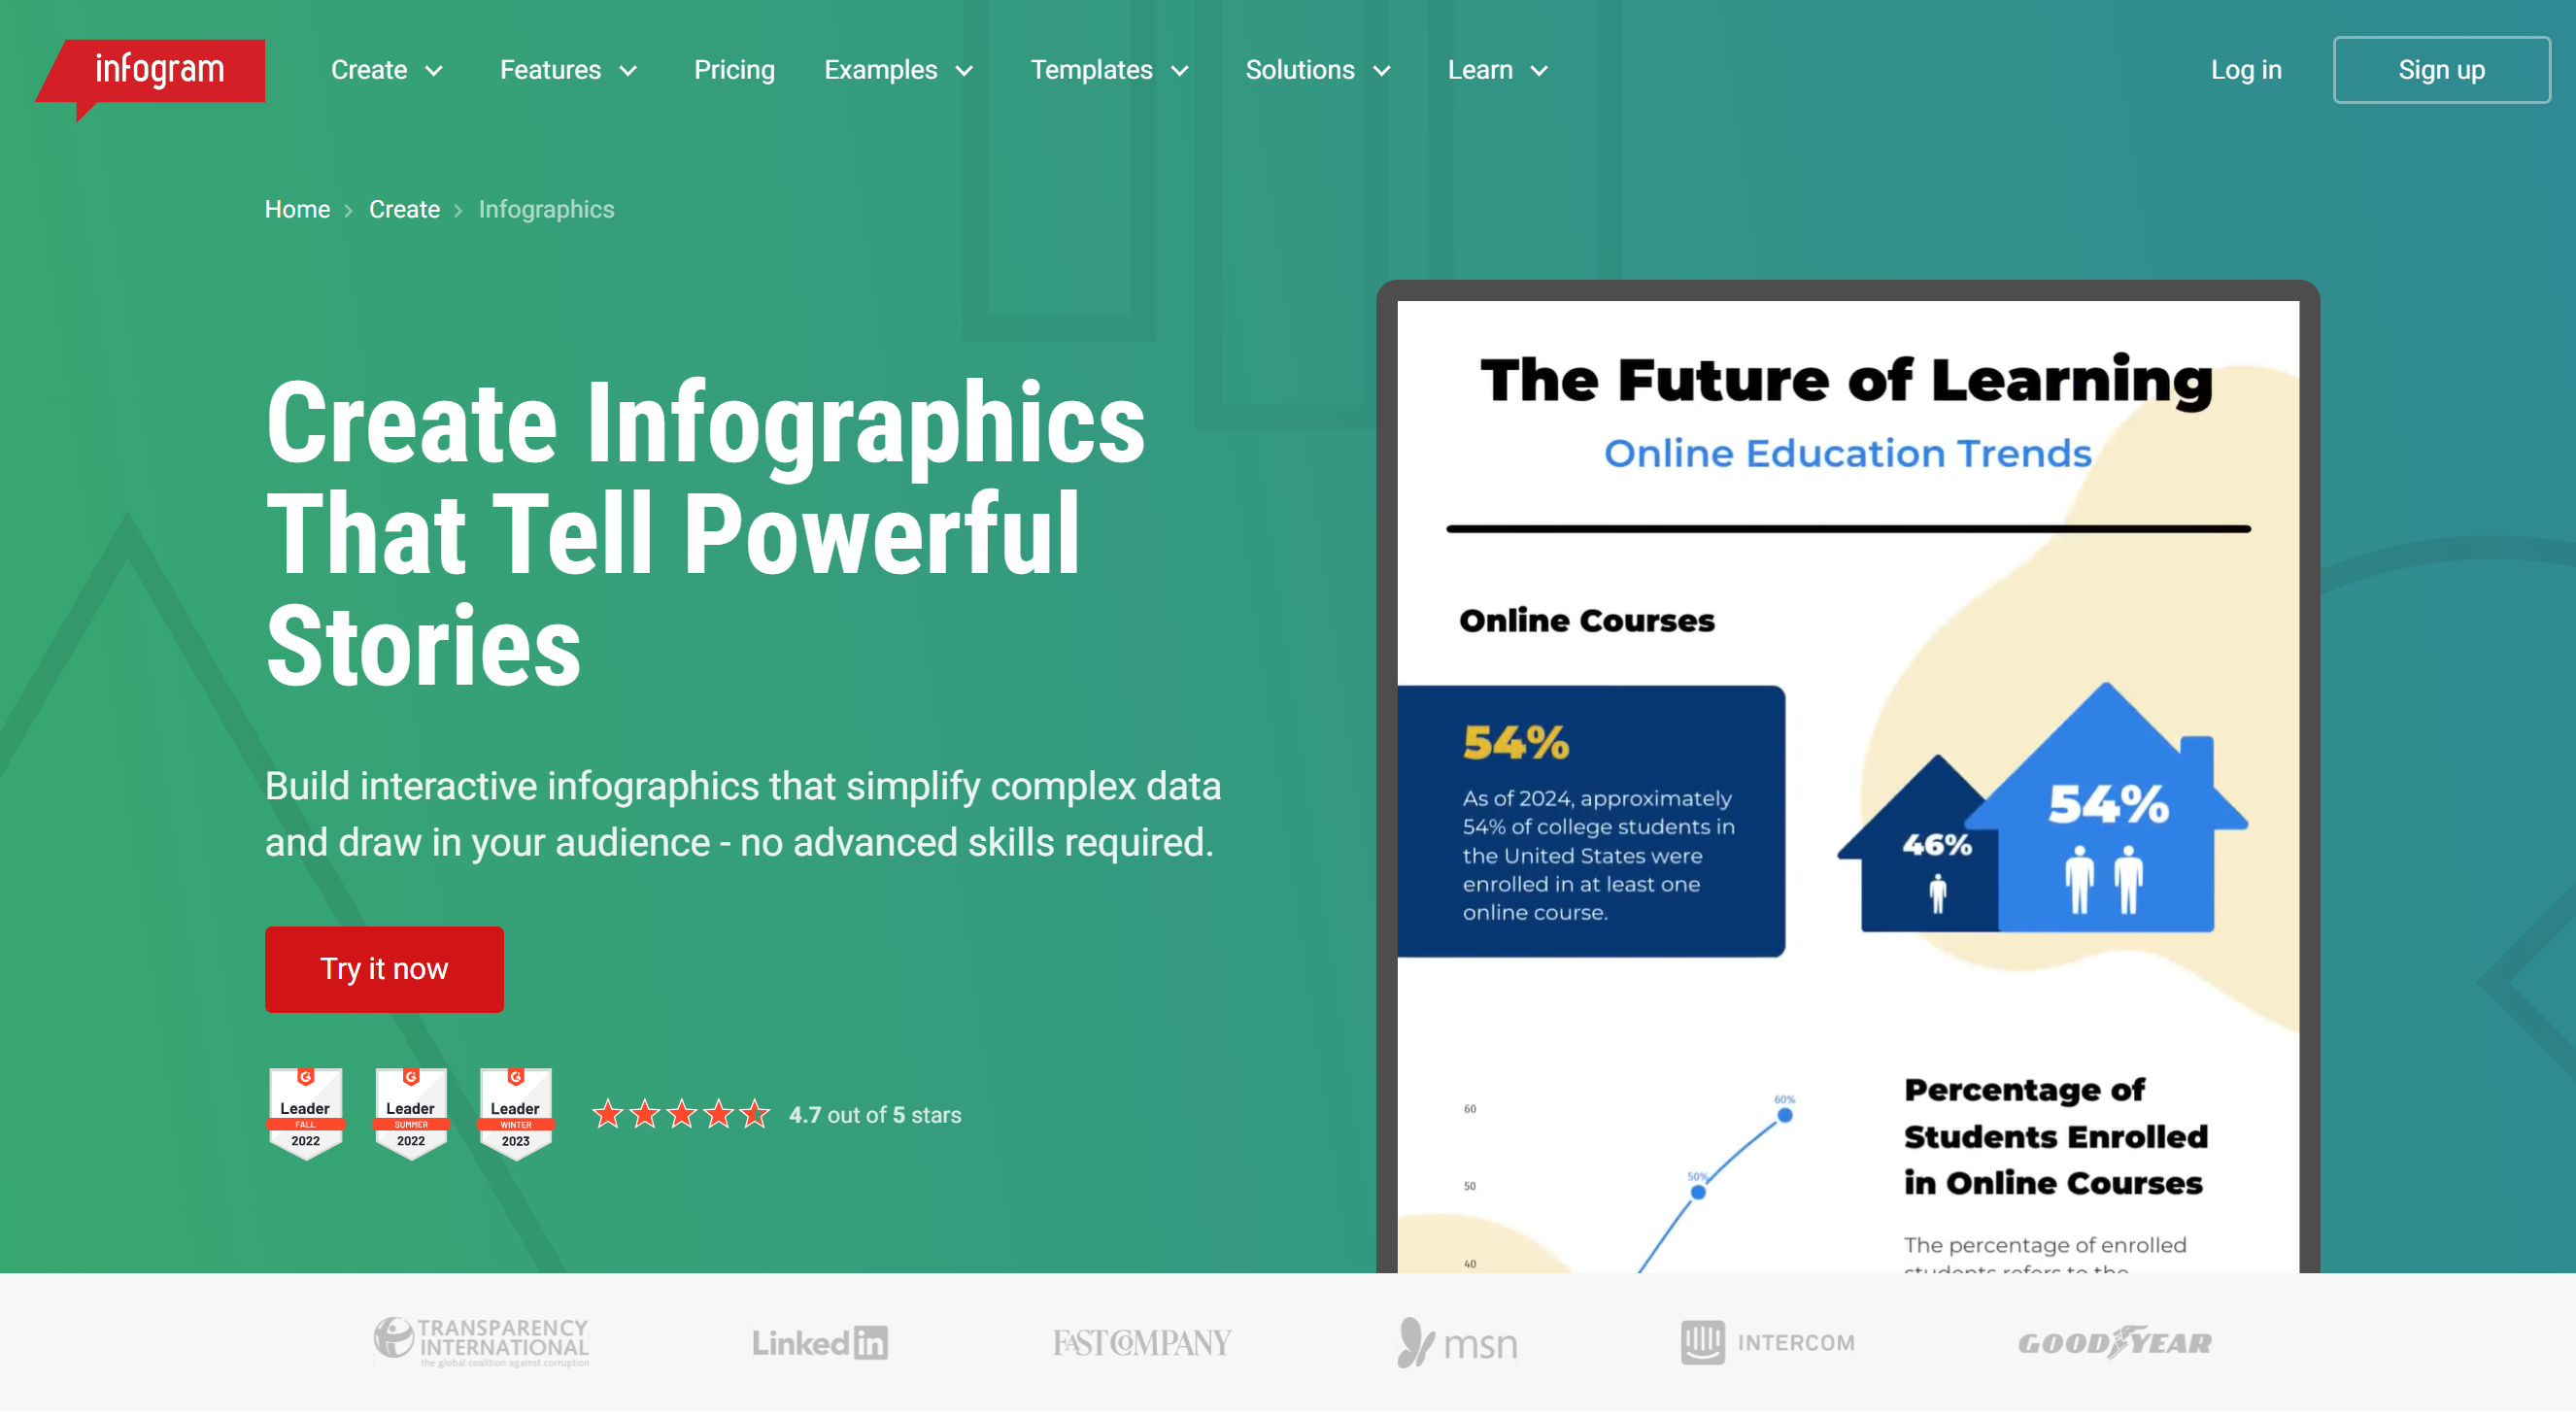
Infogram is a data visualization platform designed to turn statistics, research findings, and numerical information into engaging visuals. This online infographic tool includes customizable charts, maps, and interactive elements that help present complex datasets in an understandable format. The platform is particularly useful for journalists, researchers, and businesses that regularly work with data.
Main features
Data-driven infographic creation: Create infographics using statistics, research findings, charts, and maps to explain complex data clearly.
Multiple chart types: Choose from over 35 chart types and customize them to highlight data patterns and trends.
Data import and integration: Import data from Excel, CSV, Google Sheets, Dropbox, and supported databases to create and update visualizations.
Interactive charts and maps: Add interactive features to charts and maps, then embed them into websites or digital publications for readers to explore.
Suitable for
Journalists presenting statistics and research findings.
Data analysts creating visual reports and dashboards.
Businesses tracking performance and presenting metrics.
Researchers communicating survey results and numerical data.
Adobe Express
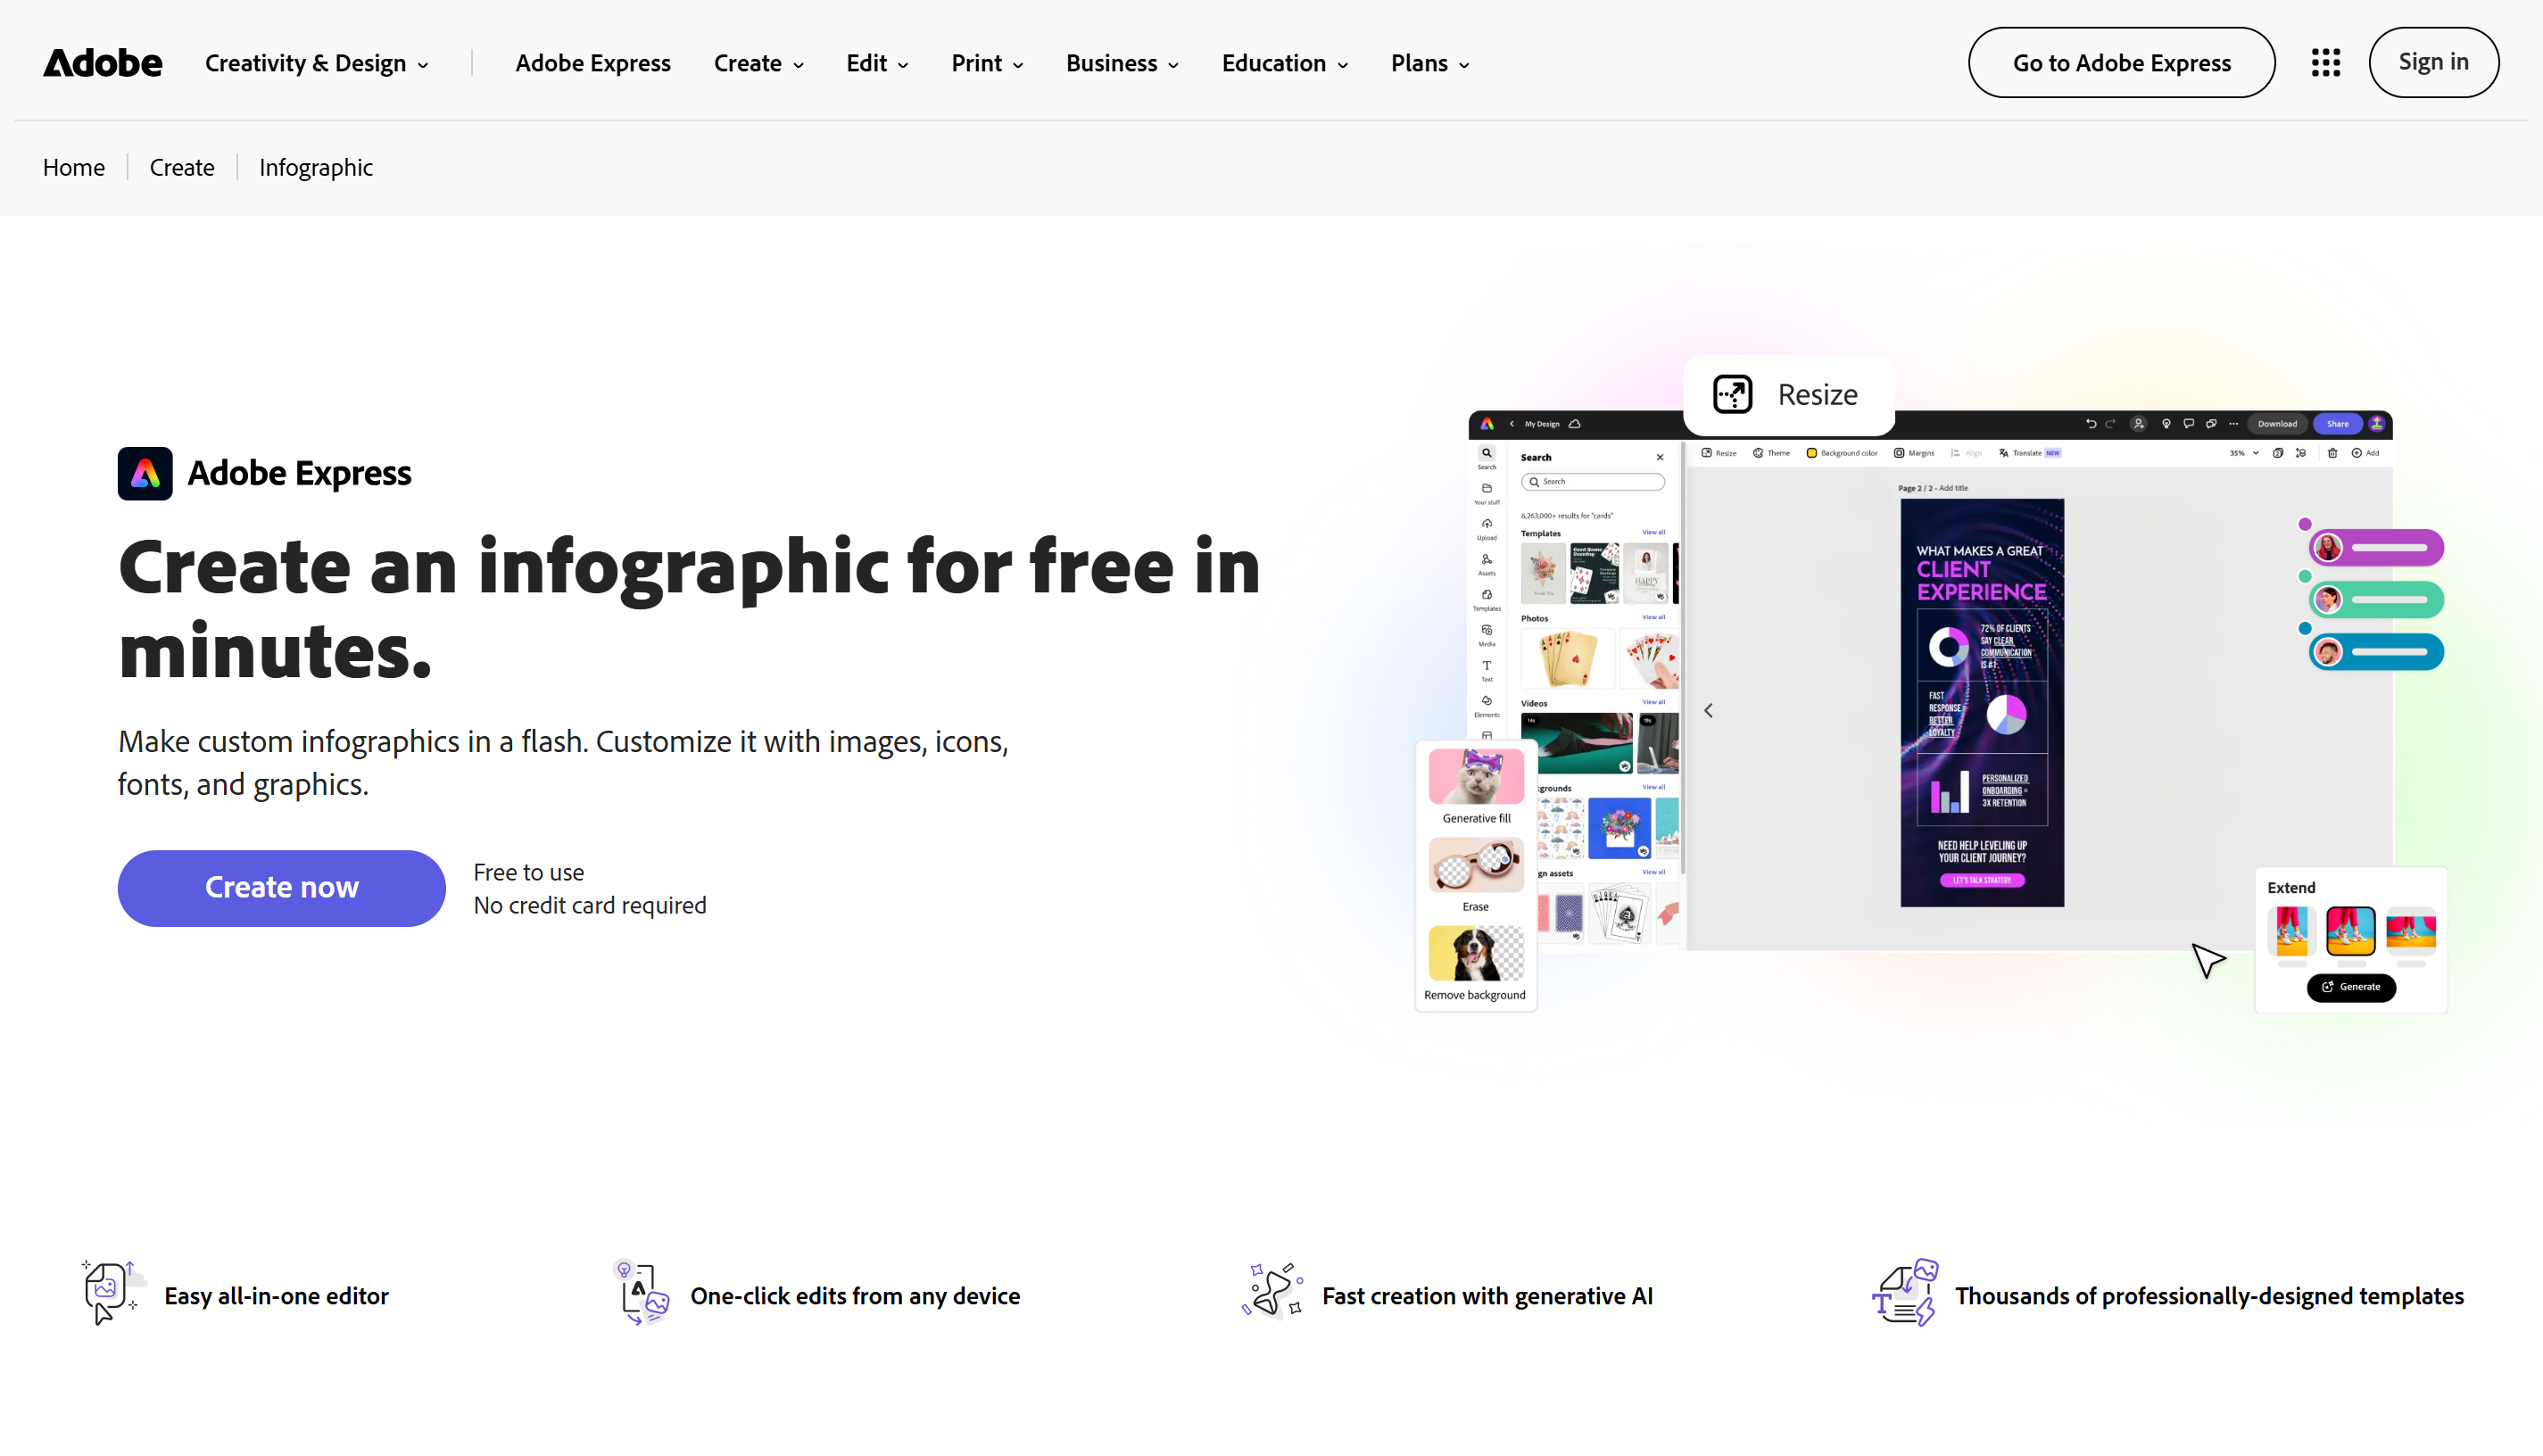
Adobe Express is an online design platform for creating graphics, posters, presentations, and social media content. It also provides customizable infographic templates and creative assets that make visual design easier for beginners. If you're looking for an infographic maker with additional graphic design capabilities, Adobe Express provides useful tools for creating and editing different types of visual content.
Main features
Ready-made infographic templates: Choose from templates for education, business, and other topics, then customize them with your own content.
Creative design assets: Enhance your infographic with icons, graphics, shapes, fonts, and color palettes.
Image and text customization: Upload images, edit text, and adjust layouts or resize designs for different platforms.
Static and animated designs: Create static or animated infographics for presentations, websites, and social media.
Suitable for
Beginners creating professional-looking infographics.
Social media managers preparing visual content.
Small businesses designing promotional graphics.
Educators creating timelines and informational visuals.
Genially
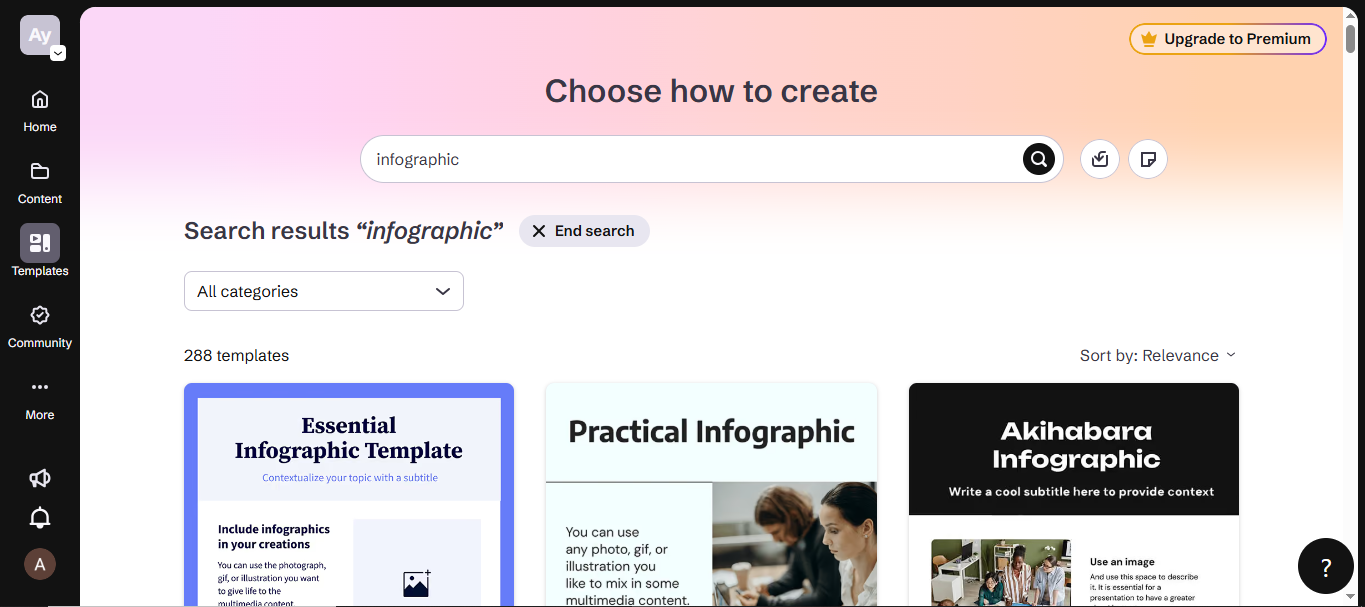
Genially is an interactive content creation platform that helps users develop infographics, presentations, and educational materials. Unlike traditional tools for creating infographics, it allows you to add clickable elements, animations, multimedia, and interactive effects to your designs. These features make it useful for creating visual content that encourages readers to explore information rather than simply view a static graphic.
Main features
Interactive infographic creation: Add clickable areas, hotspots, and buttons to let readers explore additional information.
Animations and visual effects: Use transitions and hover effects to highlight key details and make infographics more engaging.
Multimedia integration: Include audio, videos, images, and external links to create interactive visual content.
Interactive templates: Choose templates for education, business, timelines, and diagrams, then customize their content and interactive elements.
Suitable for
Teachers developing interactive learning materials.
Students creating engaging educational presentations.
Trainers explaining processes and complex topics.
Marketers preparing interactive digital content.
Datawrapper
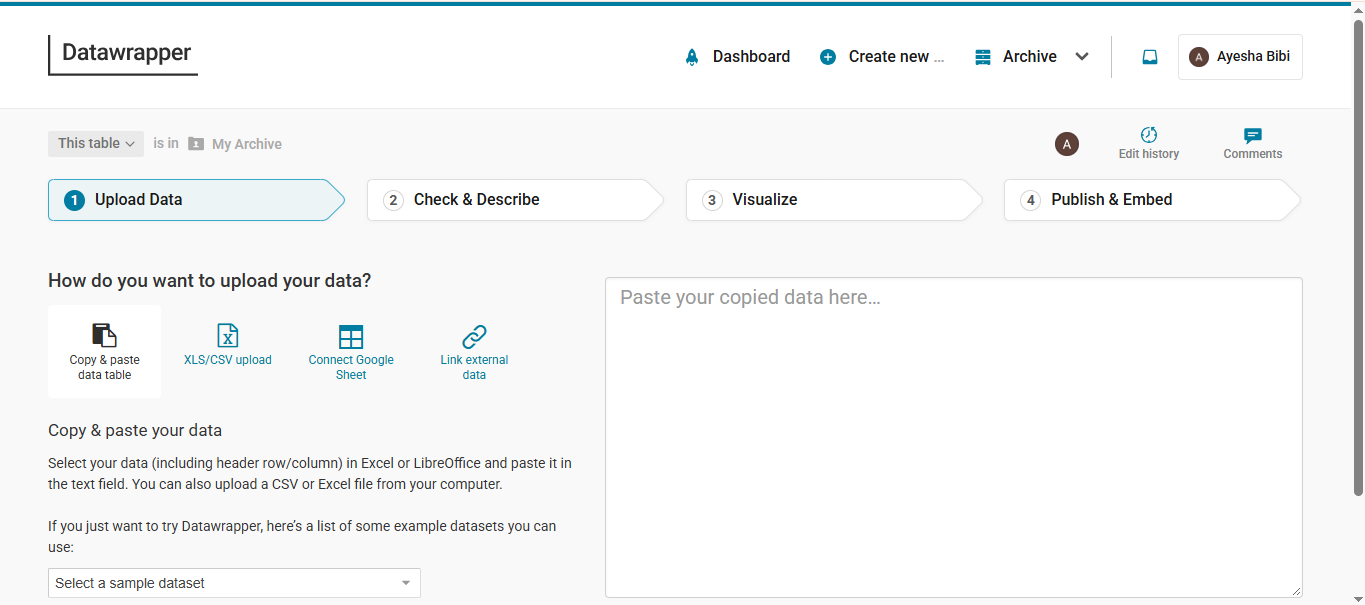
Datawrapper is a platform that helps turn datasets into charts, maps, and tables. Rather than focusing on traditional infographic templates, it provides specialized tools for presenting statistics and geographic information. Its customizable visualizations make it a useful choice for anyone looking for a good infographic maker for data-driven reports, online articles, and research publications.
Main features
Multiple chart types: Create more than 20 chart types to present trends, comparisons, relationships, and proportions.
Interactive map creation: Create choropleth, symbol, and locator maps with markers, tooltips, and annotations to explain geographic data.
Customizable data tables: Organize data using sorting, search, pagination, heatmaps, and miniature charts for easier comparisons.
Responsive and accessible visualizations: Create charts, maps, and tables that adapt to different screen sizes and support accessibility.
Suitable for
Journalists creating data-driven articles and visual stories.
Researchers presenting statistical findings.
Data analysts comparing datasets and trends.
Organizations publishing geographic and business information.
Napkin AI
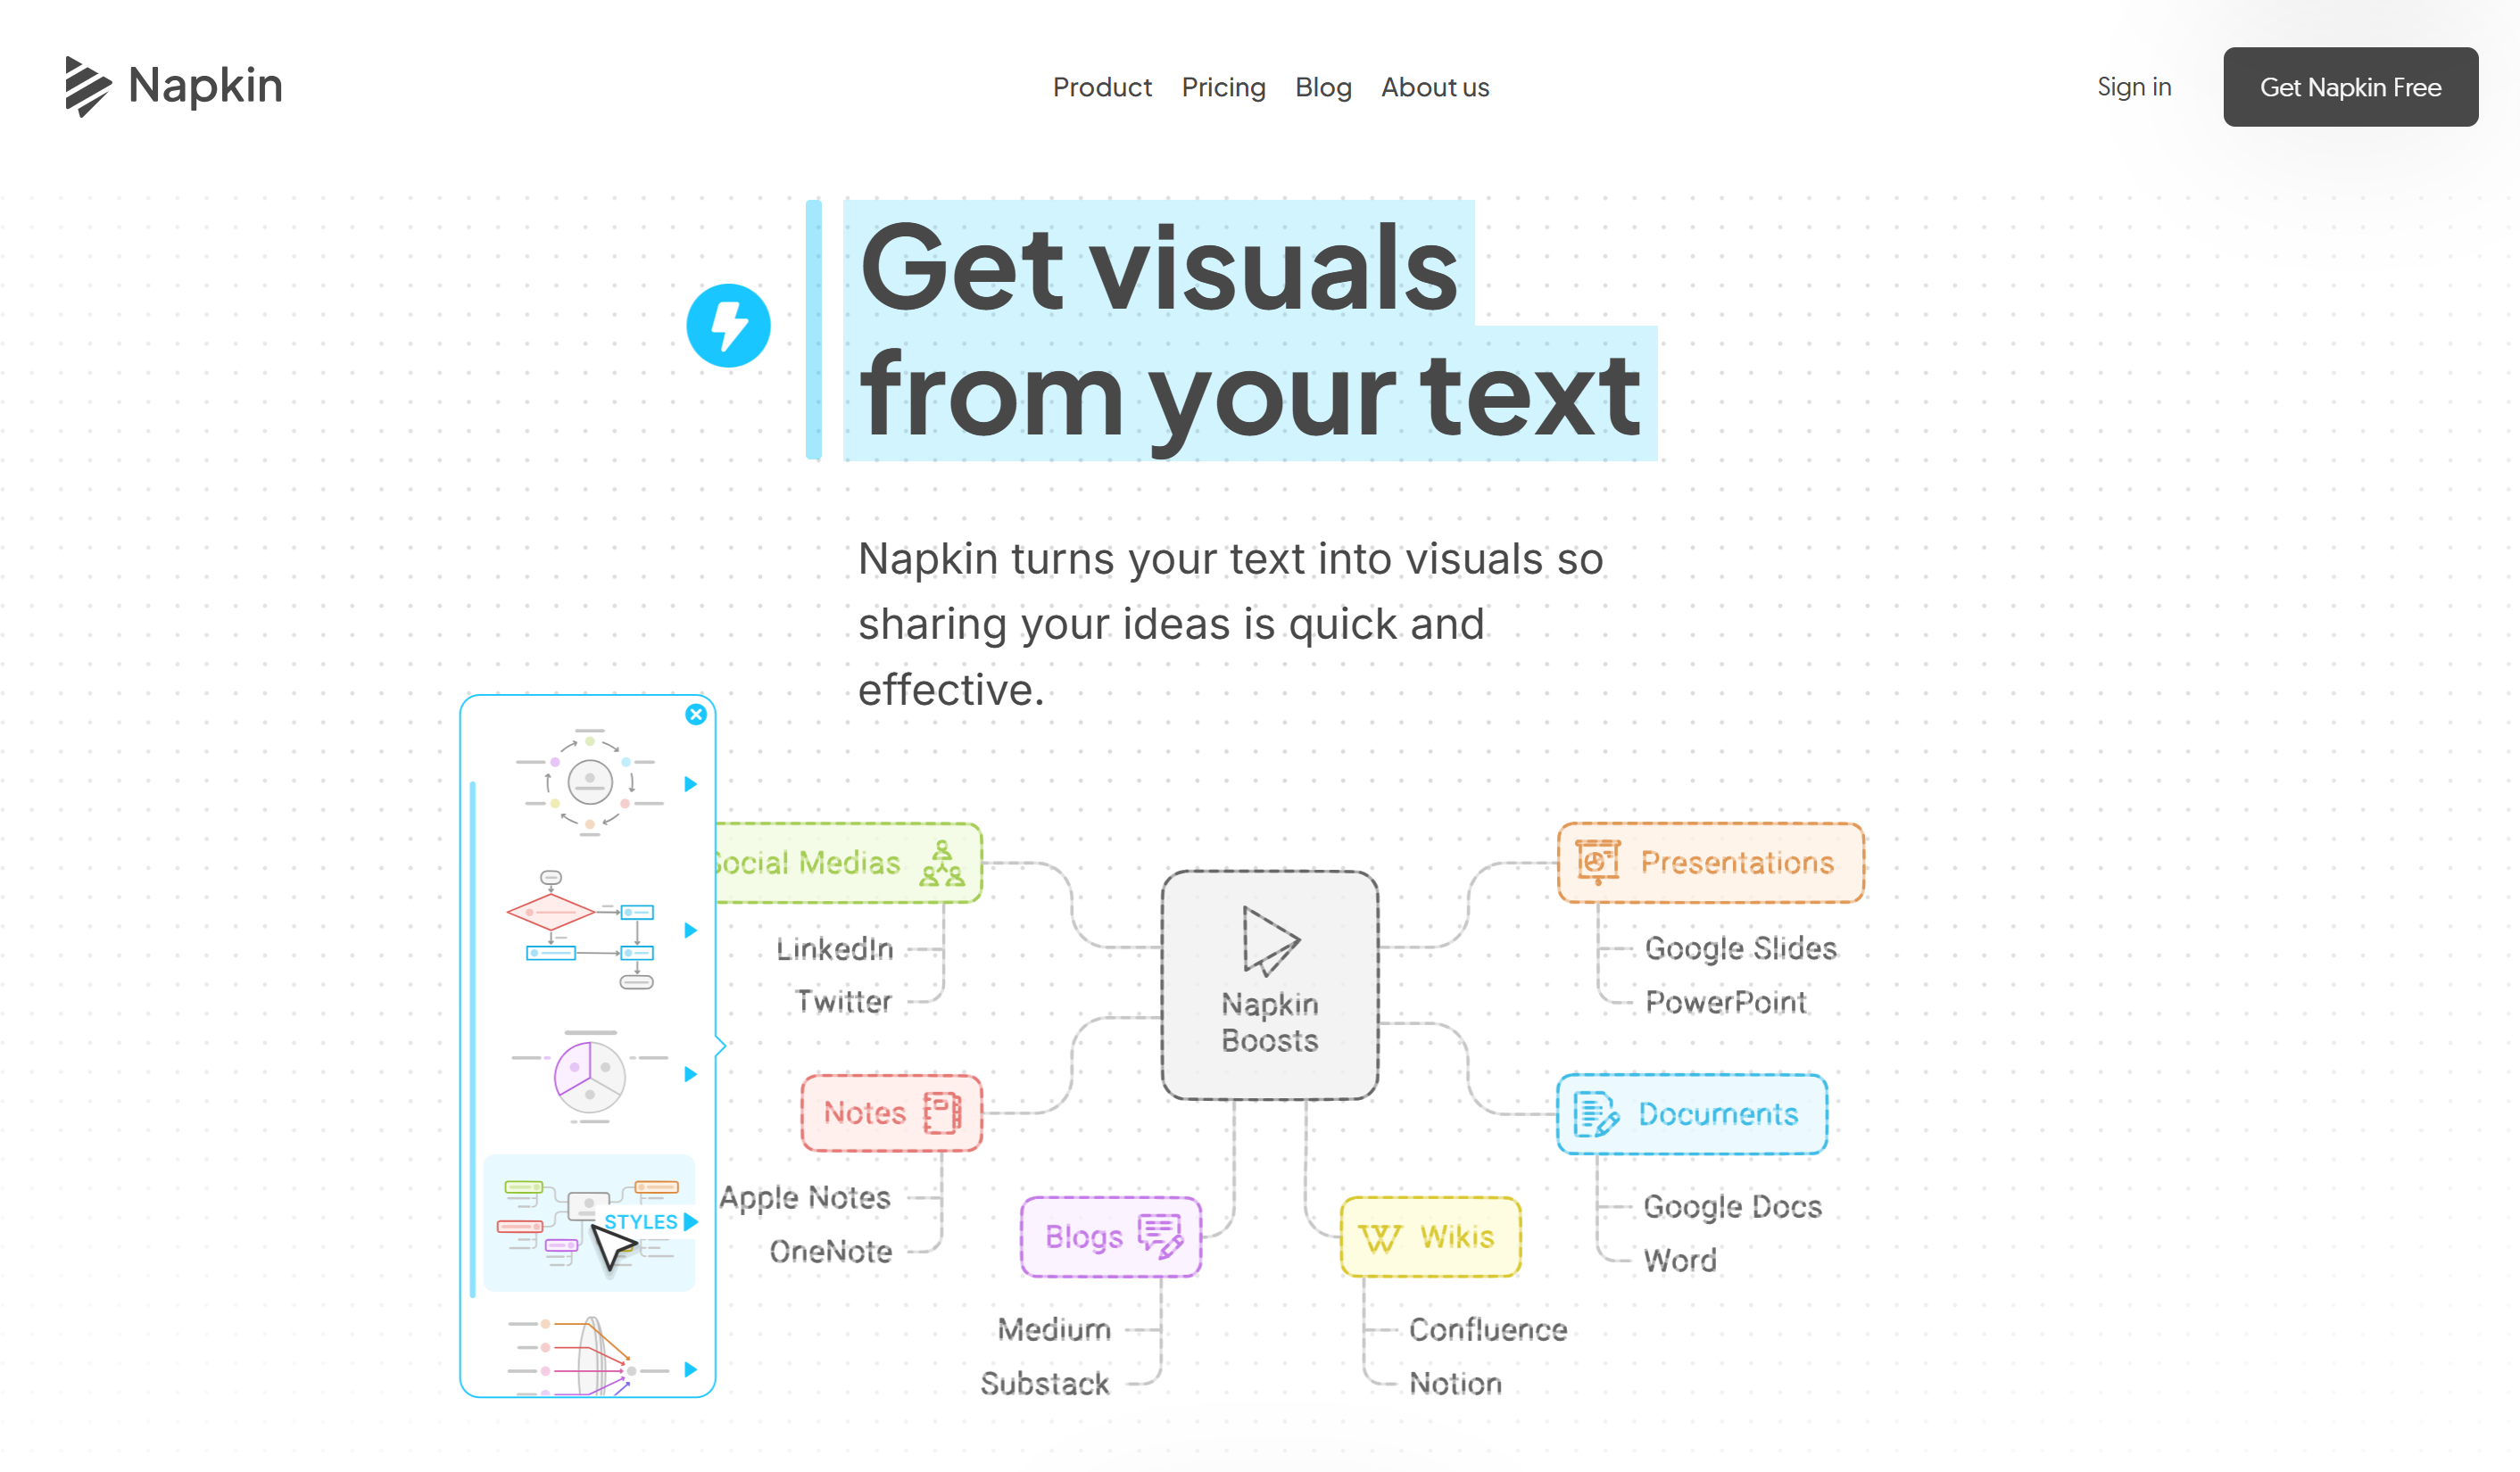
Napkin AI is an AI-powered visual creation platform that transforms written content into diagrams, charts, flowcharts, and other graphics. Instead of manually arranging every element, you can paste your text and let the tool suggest relevant visual representations. It is an online infographic maker for writers, educators, and business professionals who want to turn complex explanations into easy-to-understand visuals.
Main features
Text-to-visual generation: Paste or import text to generate relevant graphics without writing detailed design prompts.
Different visual formats: Convert written content into diagrams, flowcharts, timelines, and charts to communicate ideas clearly.
Flexible visual customization: Adjust colors, text, and design elements or rearrange visuals to match your preferred style.
Multiple export formats: Download visuals in PNG, SVG, PDF, or PowerPoint formats for use in reports and presentations.
Suitable for
Writers turning explanations into visual summaries.
Business professionals illustrating workflows and strategies.
Educators explaining concepts through diagrams.
Content creators adding visuals to blogs and presentations.
Factors to consider when selecting an infographic tool
Choosing an infographic tool involves more than finding attractive templates. You need a platform that supports your content type, simplifies the design process, and provides enough flexibility to present information accurately. Consider these factors before selecting a tool.
Match the tool to your infographic type
Identify the type of infographic you want to create, such as statistical charts, timelines, comparisons, or process diagrams. Choose a tool with features suited to your content, such as Datawrapper for data visualization or Genially for interactive designs.
Check how easily you can turn information into visuals
Look for an infographic creator tool that converts text, documents, and datasets into clear visuals. Features such as AI prompts, document uploads, spreadsheet imports, and ready-made templates can simplify the design process.
Look for control over individual design elements
Choose an editor that lets you customize fonts, colors, icons, images, backgrounds, and text. Flexible editing options help you adapt templates to your content and brand without being restricted to fixed layouts.
Make sure charts present data accurately
Check whether the tool supports different chart types, spreadsheet imports, data labels, and adjustable scales. Clear labels and accurate visual representations help readers interpret statistics and avoid misleading comparisons.
Check export formats and sharing options
Choose a tool that supports suitable export formats, such as PNG and JPG for wallpaper images, or PSD and PPTX if you need to make further edits. Features like shareable links, collaboration, and high-resolution downloads can also make it easier to access, refine, and use your designs across different platforms.
Conclusion
To sum up, infographic creation doesn't have to involve complicated design software or a steep learning curve. With the right platform, you can bring your ideas to life visually in a way that suits your purpose and audience. One powerful option is Kimi Design: its prompt-based generation and flexible editing make it easy to create visual content for different projects.