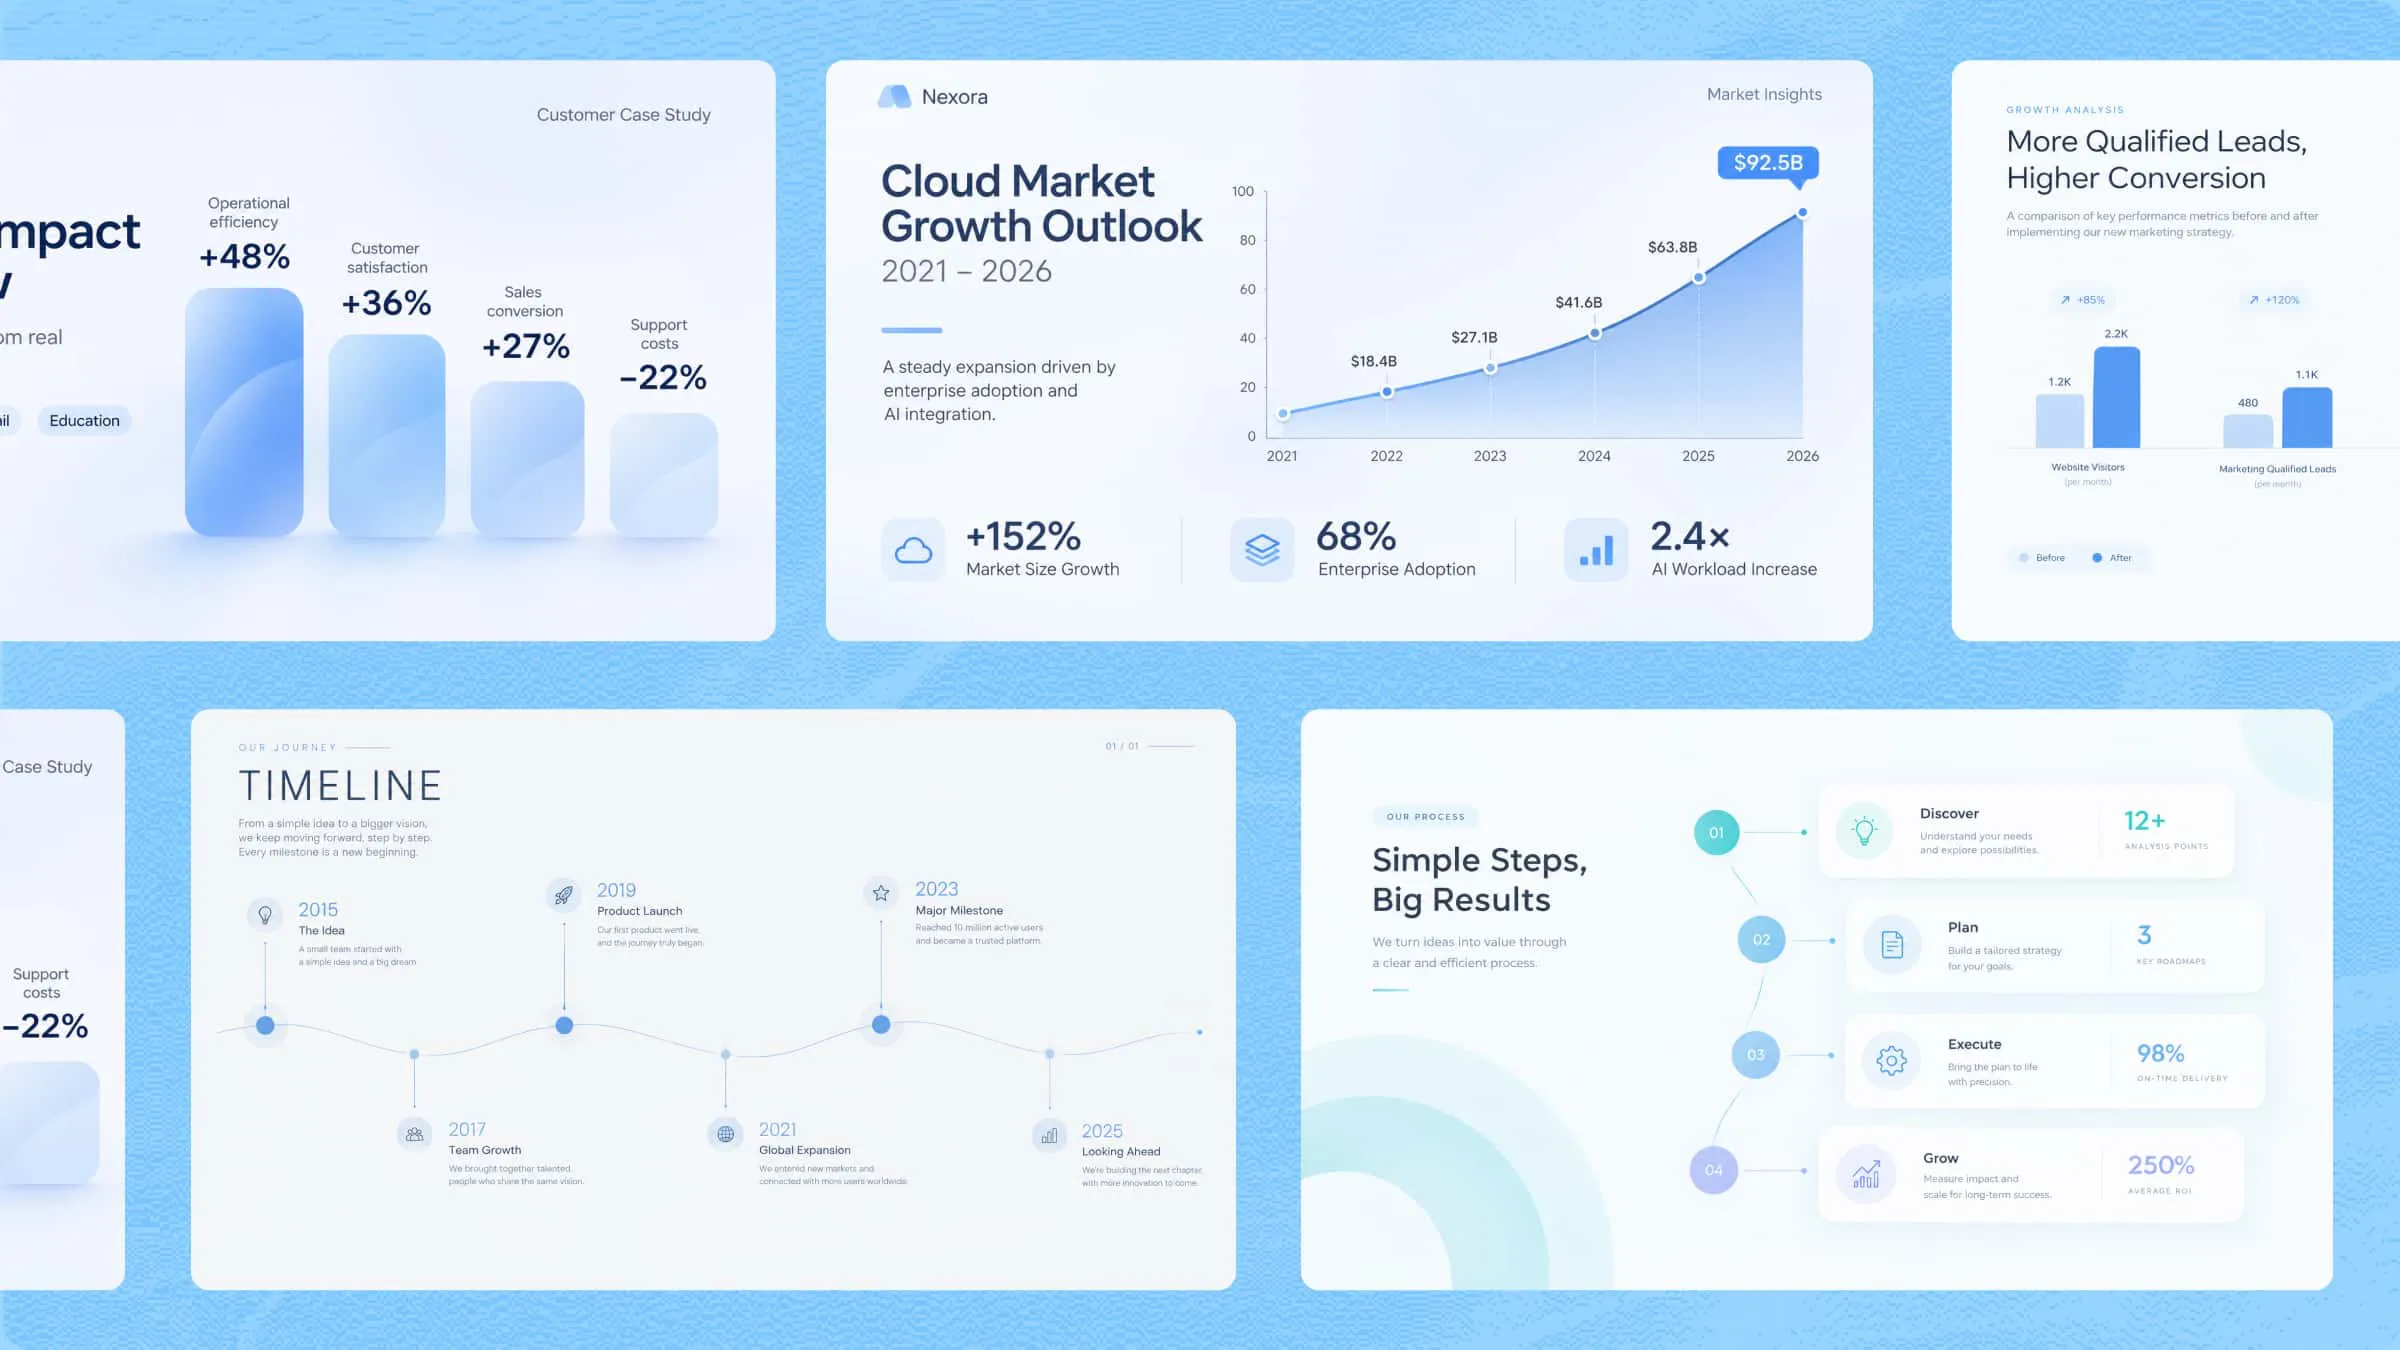
Infographics present information in a clear visual format, combining text, images, charts, and graphics to make complex ideas easier to understand and digest. Whether you're sharing data, explaining a process, comparing different options, or telling a story, different formats help organize content and communicate key messages effectively. This article explores 10 infographic types for different content needs, highlighting their unique features and practical design uses.
Overview of 10 types of infographics
Infographics come in different formats, from data-driven visuals to comparison charts and process diagrams that present information clearly. The following infographic types will be explored based on their structure, features, and uses to help you choose the right format and communicate ideas effectively.
| Types of infographics | Key content | Visual direction | Suitable for |
|---|---|---|---|
| Process infographics | Step-by-step instructions, workflows, tasks, and procedures | Connected steps, directional arrows, numbered stages | Tutorials, workflow guides, training materials |
| Statistical infographics | Numerical data, percentages, survey results, and research findings | Charts, graphs, data labels, and visual indicators | Reports, research presentations, business analysis |
| Informational infographics | Important facts, explanations, key points, and topic summaries | Clear headings, short text sections, relevant icons | Educational content, awareness campaigns, guides |
| Timeline infographics | Historical events, important dates, milestones, and progress stages | Chronological order, date markers, connected events | History lessons, project planning, company profiles |
| Geographic infographics | Location details, regional data, population statistics, and geographical facts | Maps, location markers, labels, and regional highlights | Travel guides, demographic reports, location-based studies |
| Comparison infographics | Differences, similarities, features, benefits, and drawbacks | Side-by-side sections, comparison charts, contrasting colors | Product comparisons, business analysis, decision-making guides |
| Hierarchical infographics | Rankings, categories, organizational levels, and structured information | Pyramids, flowcharts, tree diagrams, connected levels | Organizational charts, ranking systems, educational materials |
| List infographics | Tips, ideas, resources, facts, and key points | Numbered sections, bullet points, icons, and illustrations | Checklists, blog posts, quick guides, social media content |
| Resume infographics | Education, work experience, skills, qualifications, and achievements | Professional layouts, skill charts, icons, and visual sections | Job applications, professional portfolios, personal profiles |
| Visual-based infographics | Concepts, ideas, instructions, and information supported by images | Illustrations, photographs, symbols, and minimal text | Educational materials, product guides, social media posts |
10 different types of infographics
Different content calls for distinct infographic styles, from presenting data and explaining processes to comparing options and sharing information. These 10 infographic types showcase visual formats, each designed to organize ideas and communicate information effectively for different purposes.
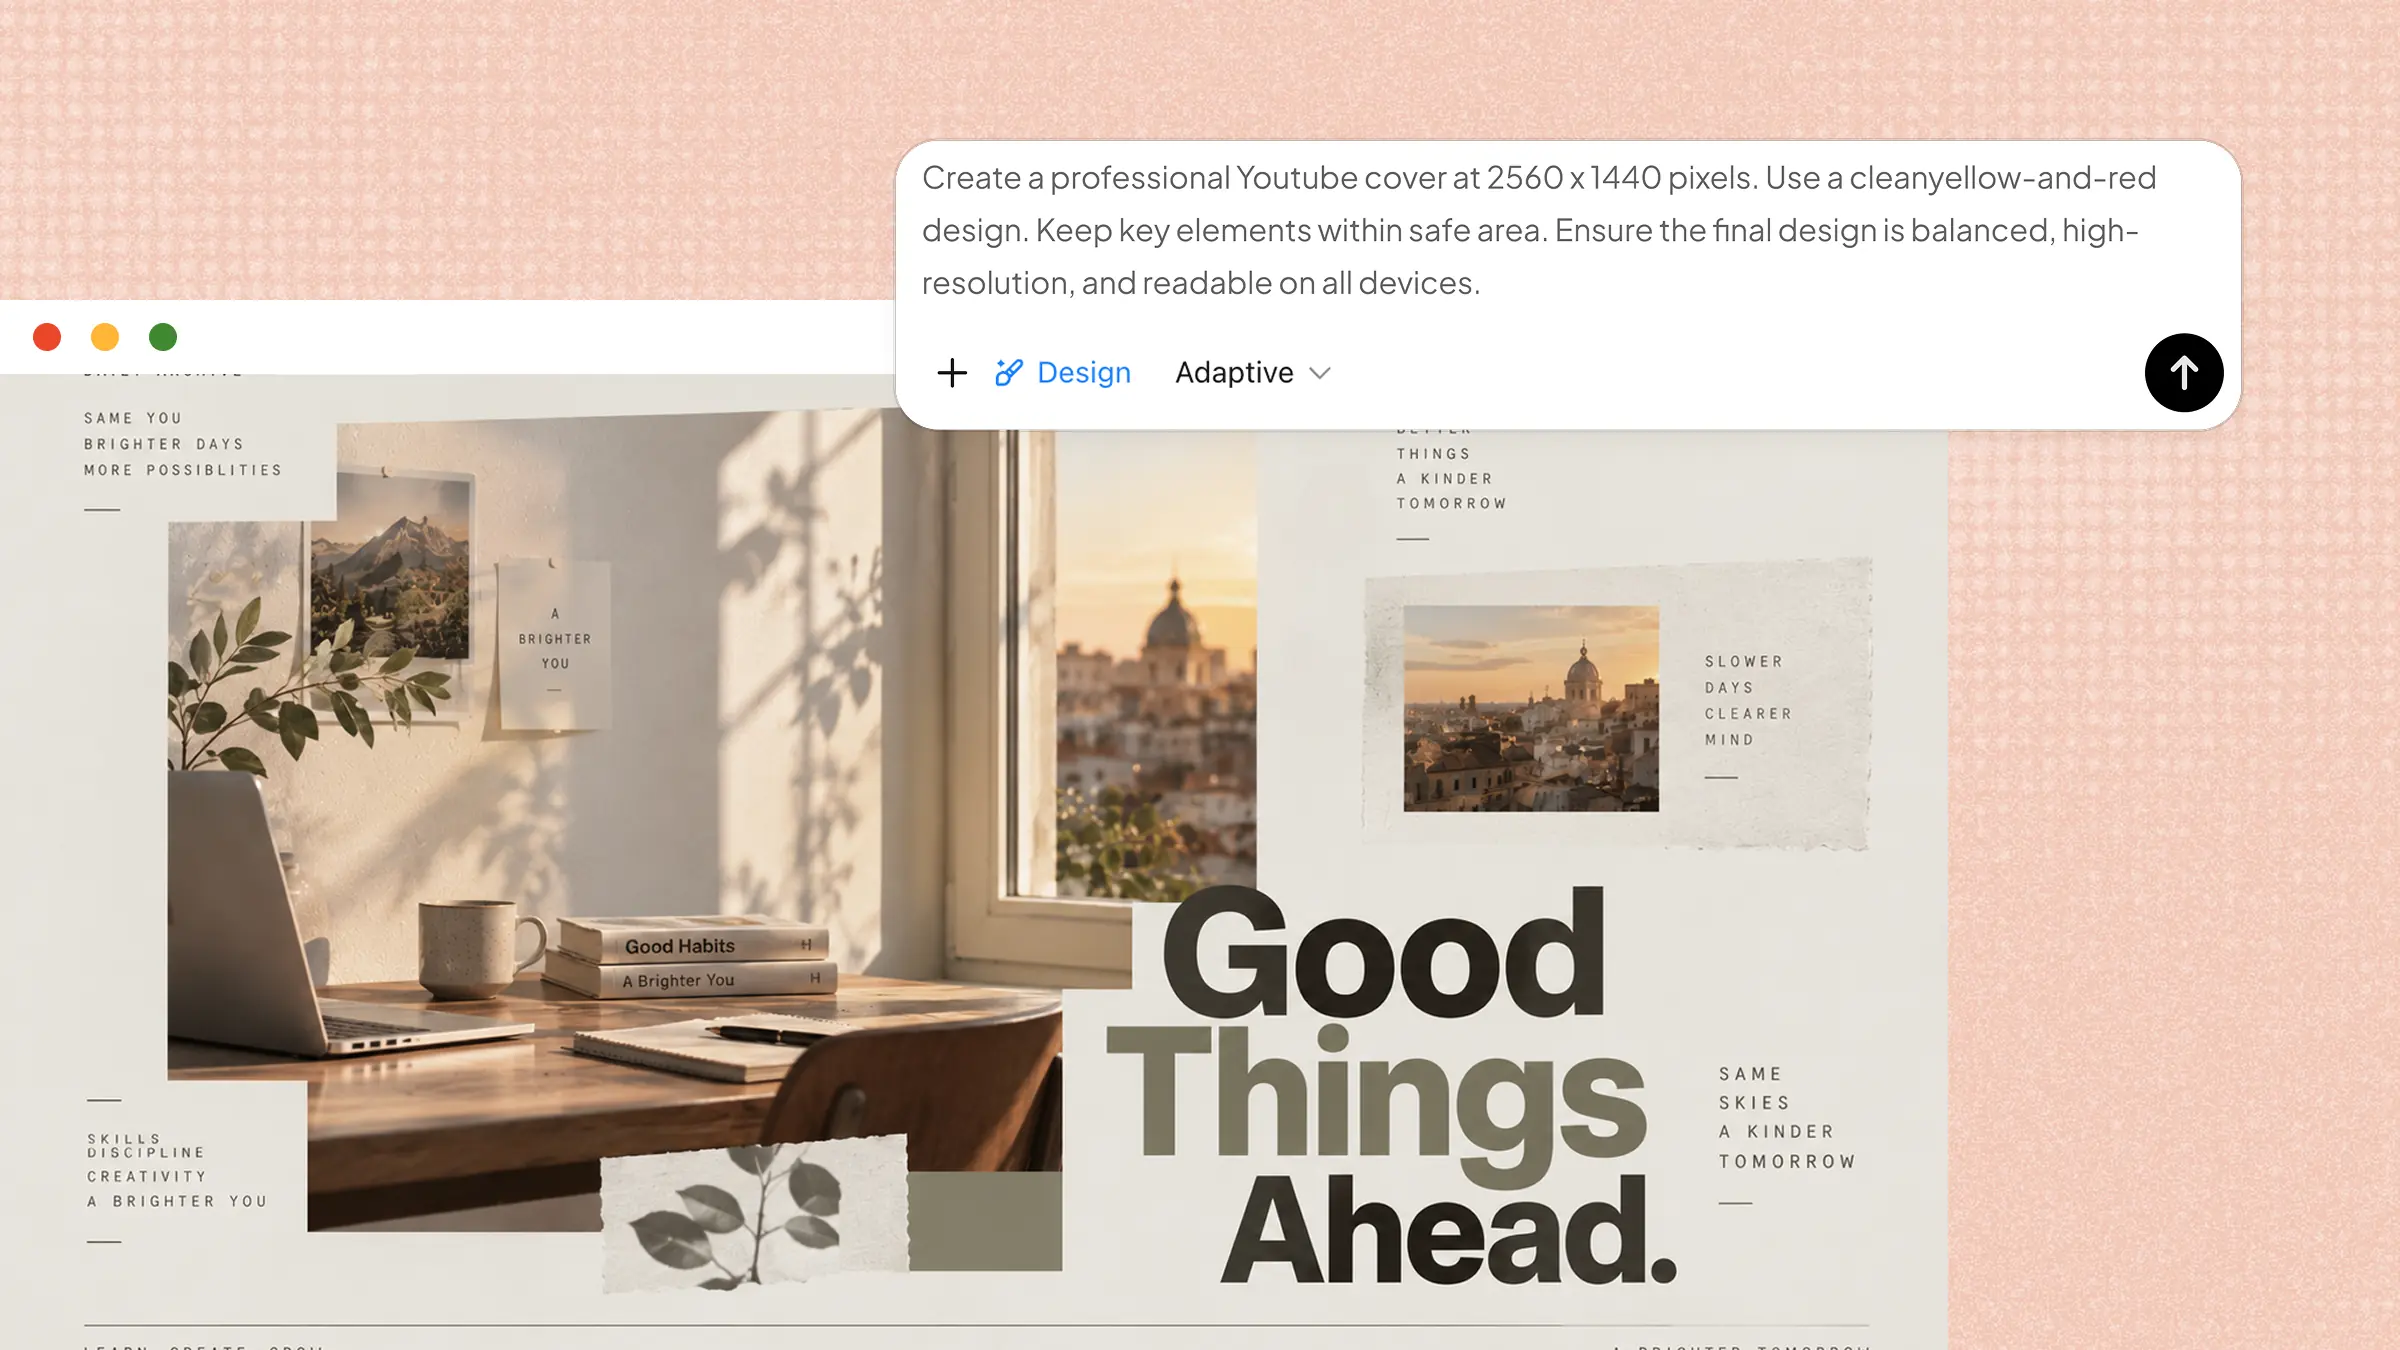
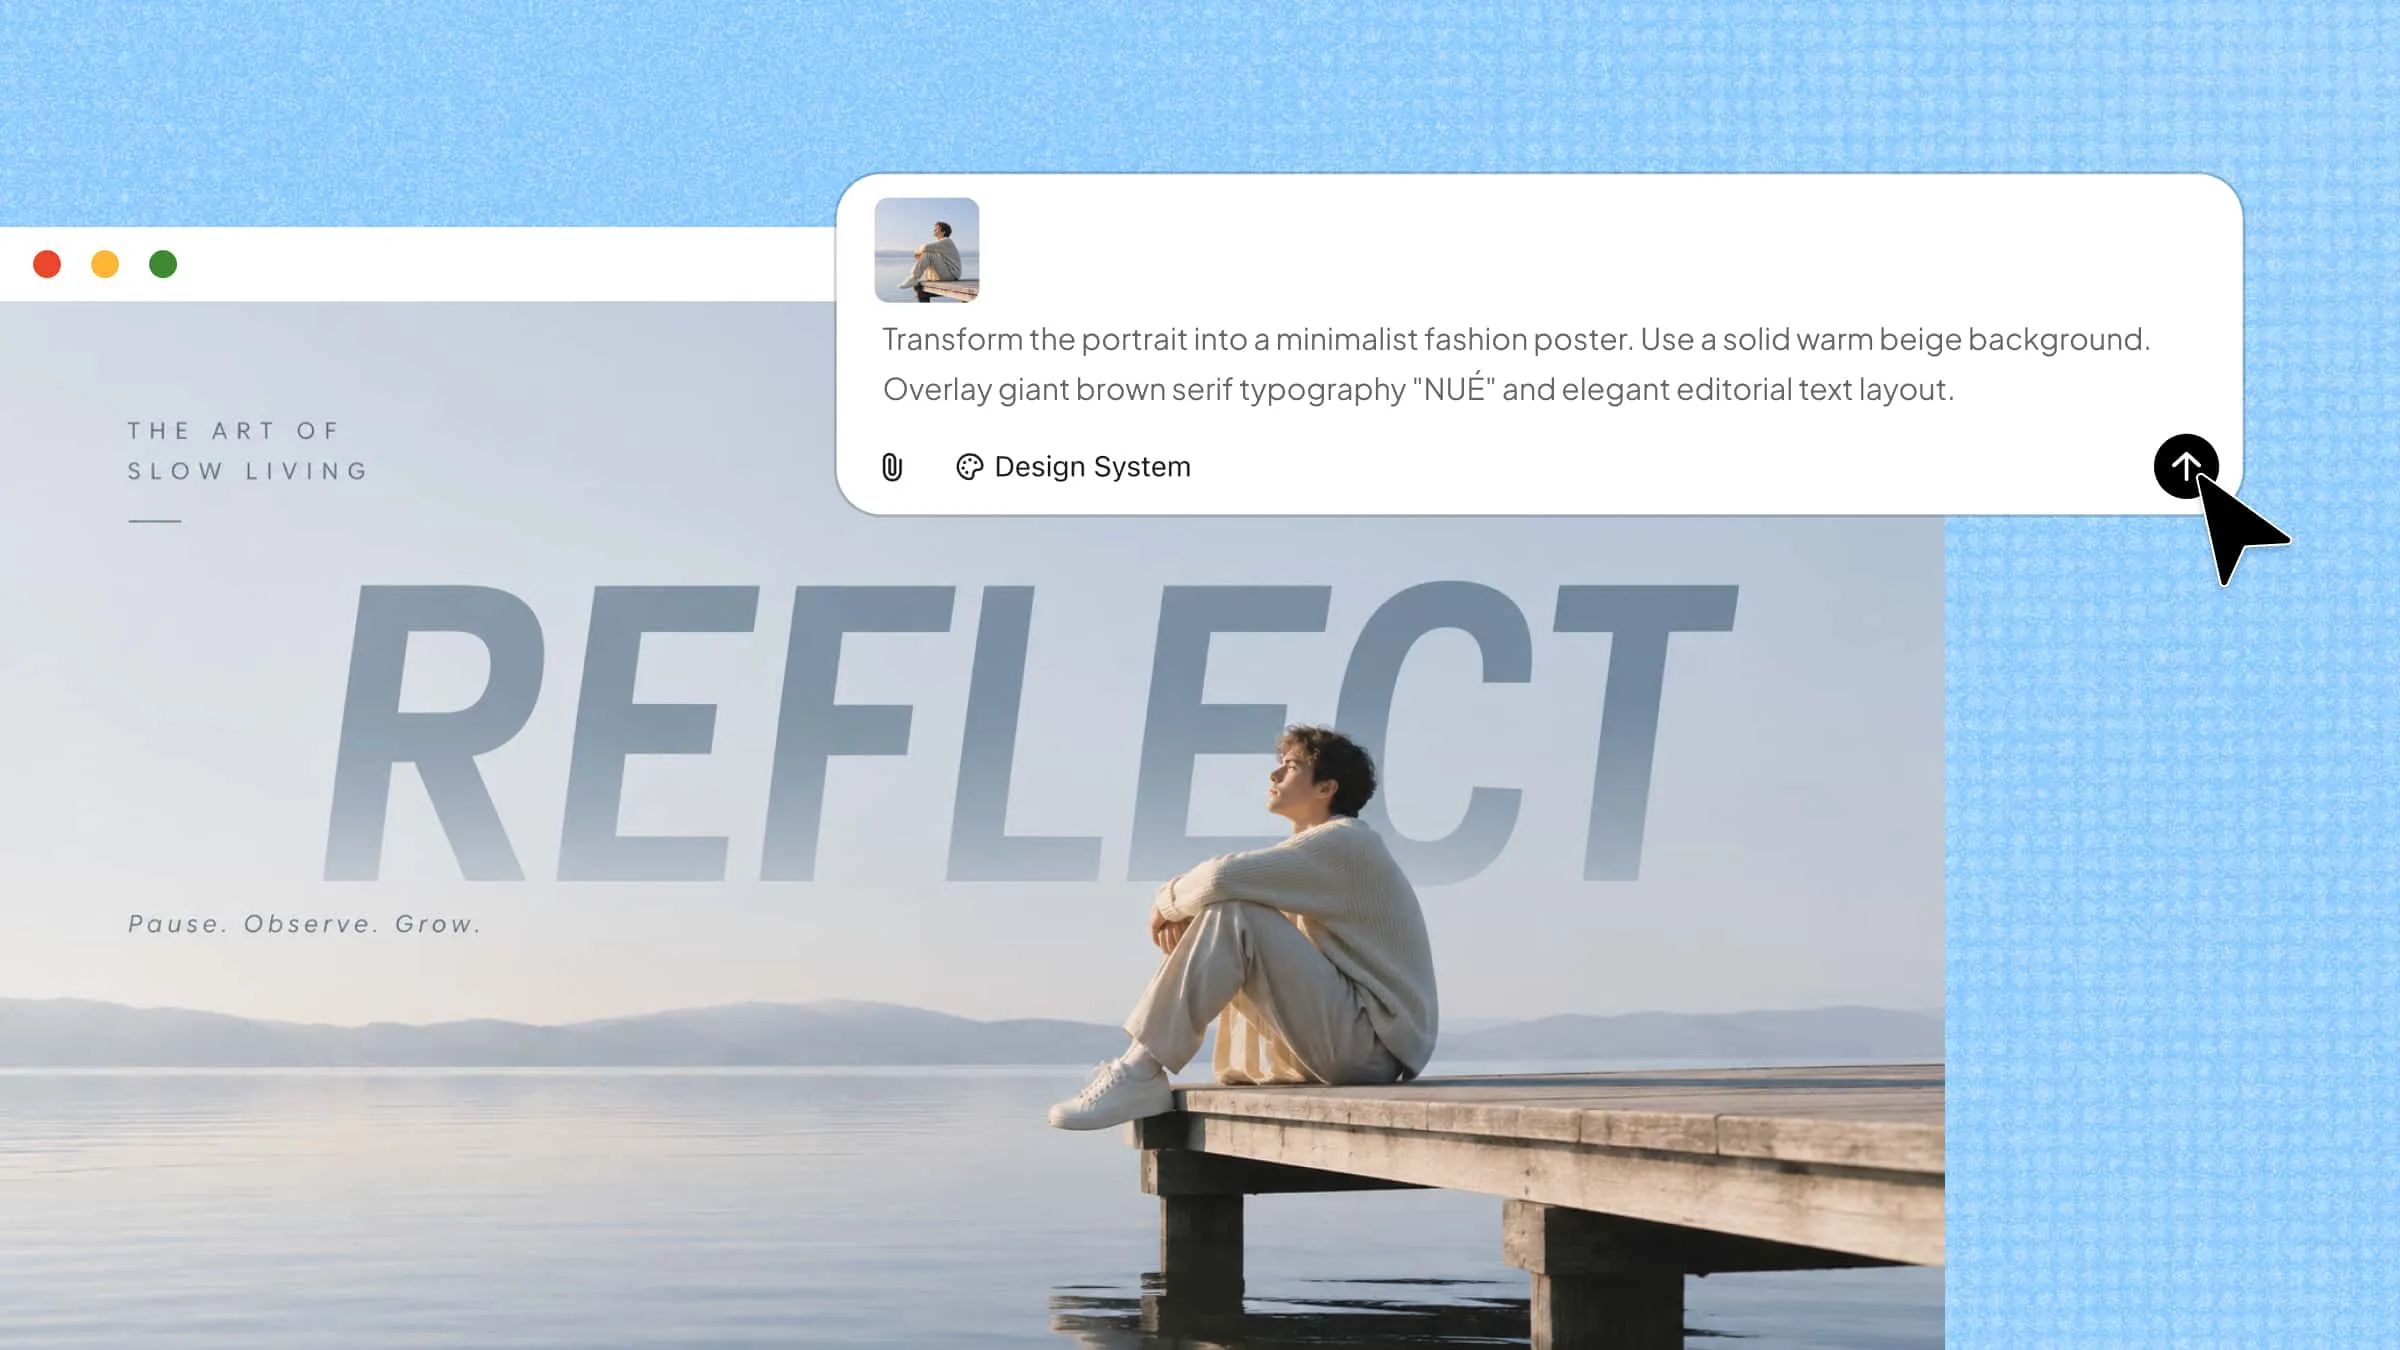
With Kimi Design, an AI design generator, you can turn content ideas into infographics using a short prompt. It can generate layouts, text, charts, icons, colors, and visual elements based on your instructions. You can review the generated design, customize individual sections, and refine the visuals to suit your content needs.
Process infographics
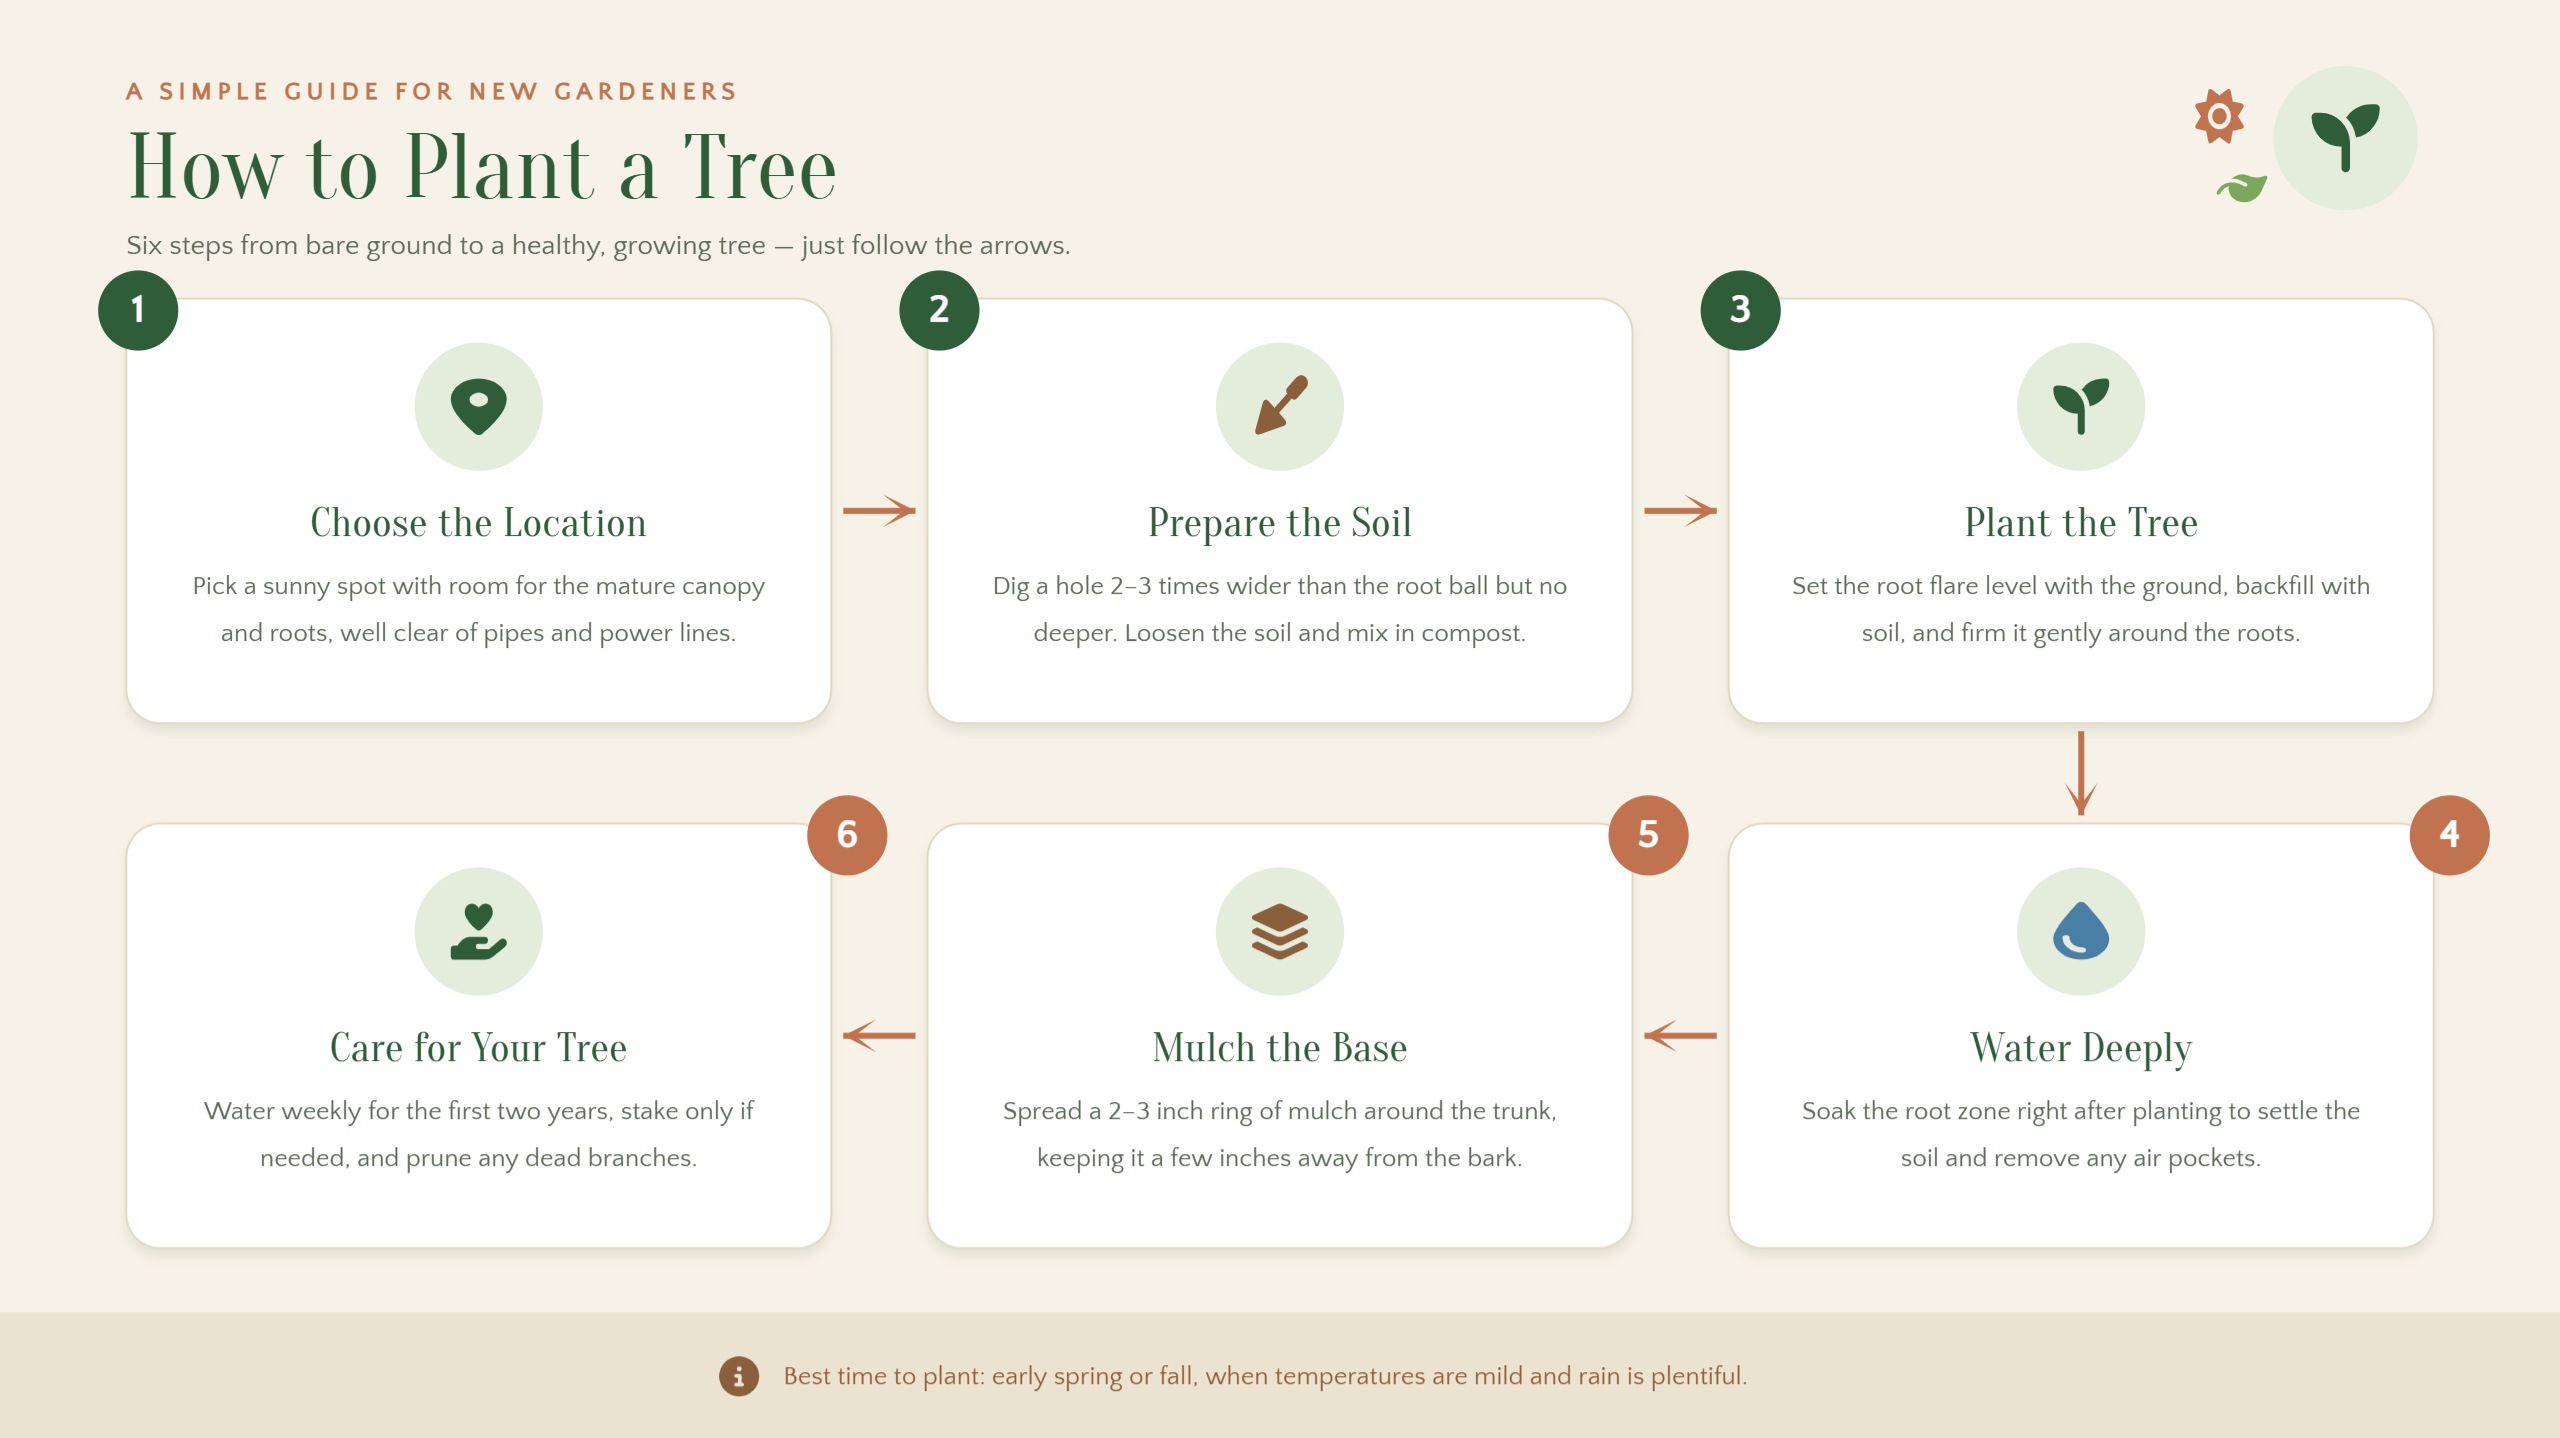
A process infographic explains how something works by presenting each step in a clear sequence. It helps readers understand instructions, workflows, and activities without going through lengthy explanations. Use numbered steps, arrows, connecting lines, and simple icons to guide readers from one stage to the next. A well-planned layout makes each action easy to follow and the entire process simple to understand.
Example Prompt
Statistical infographics
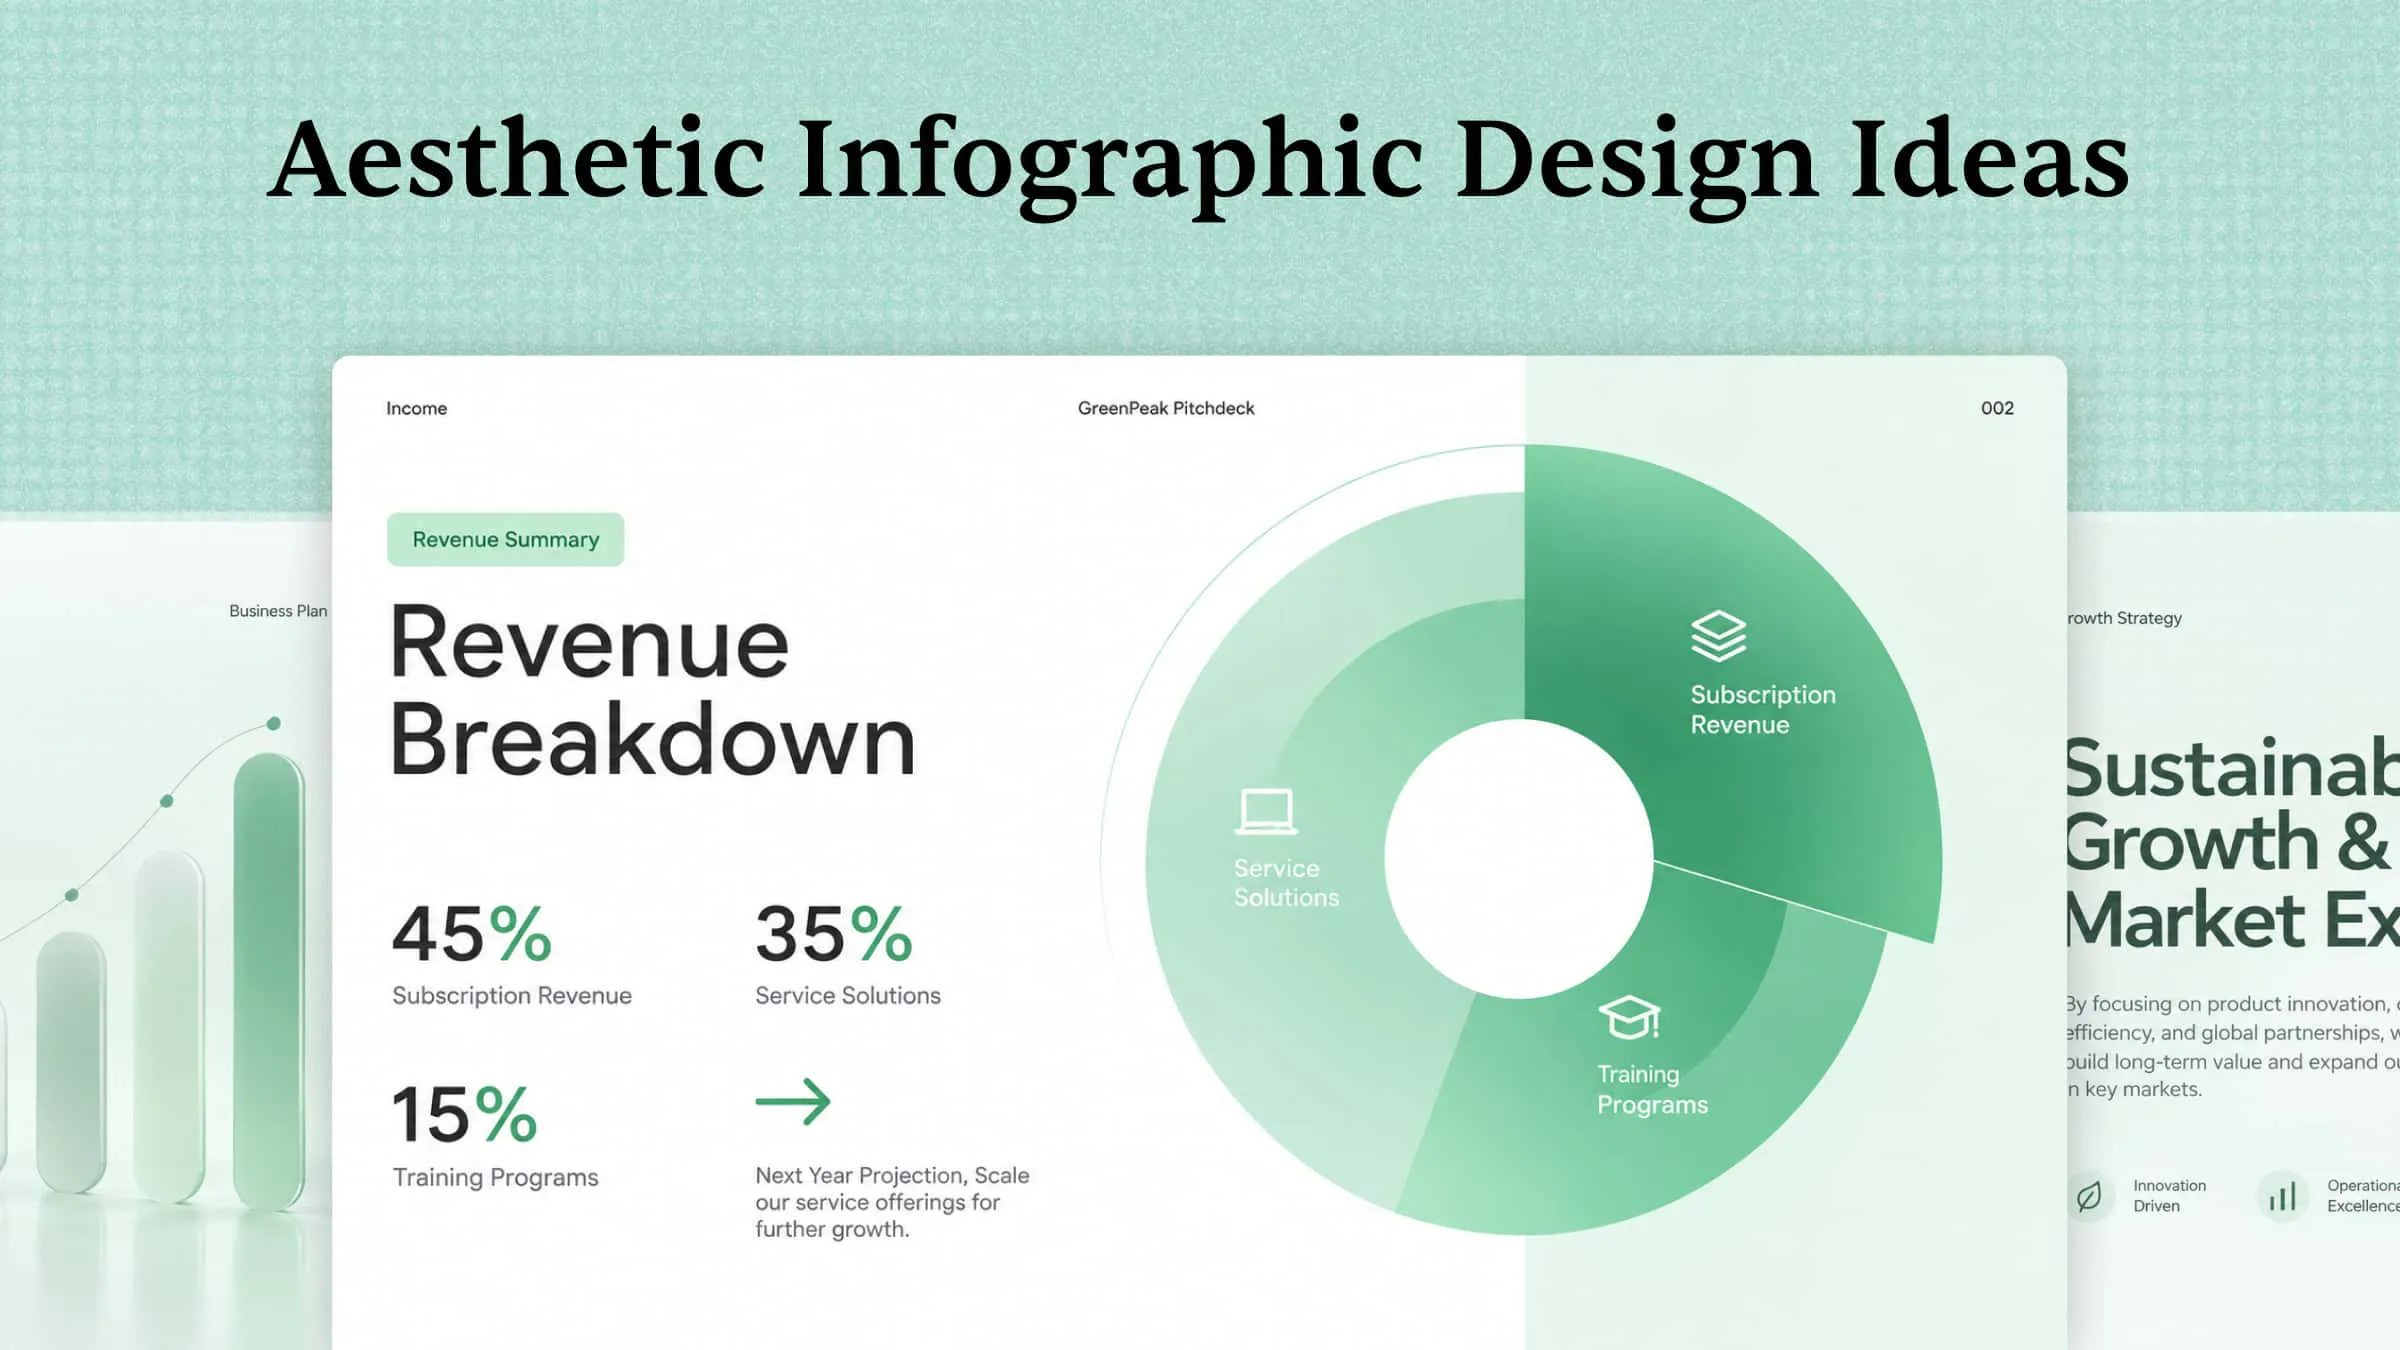
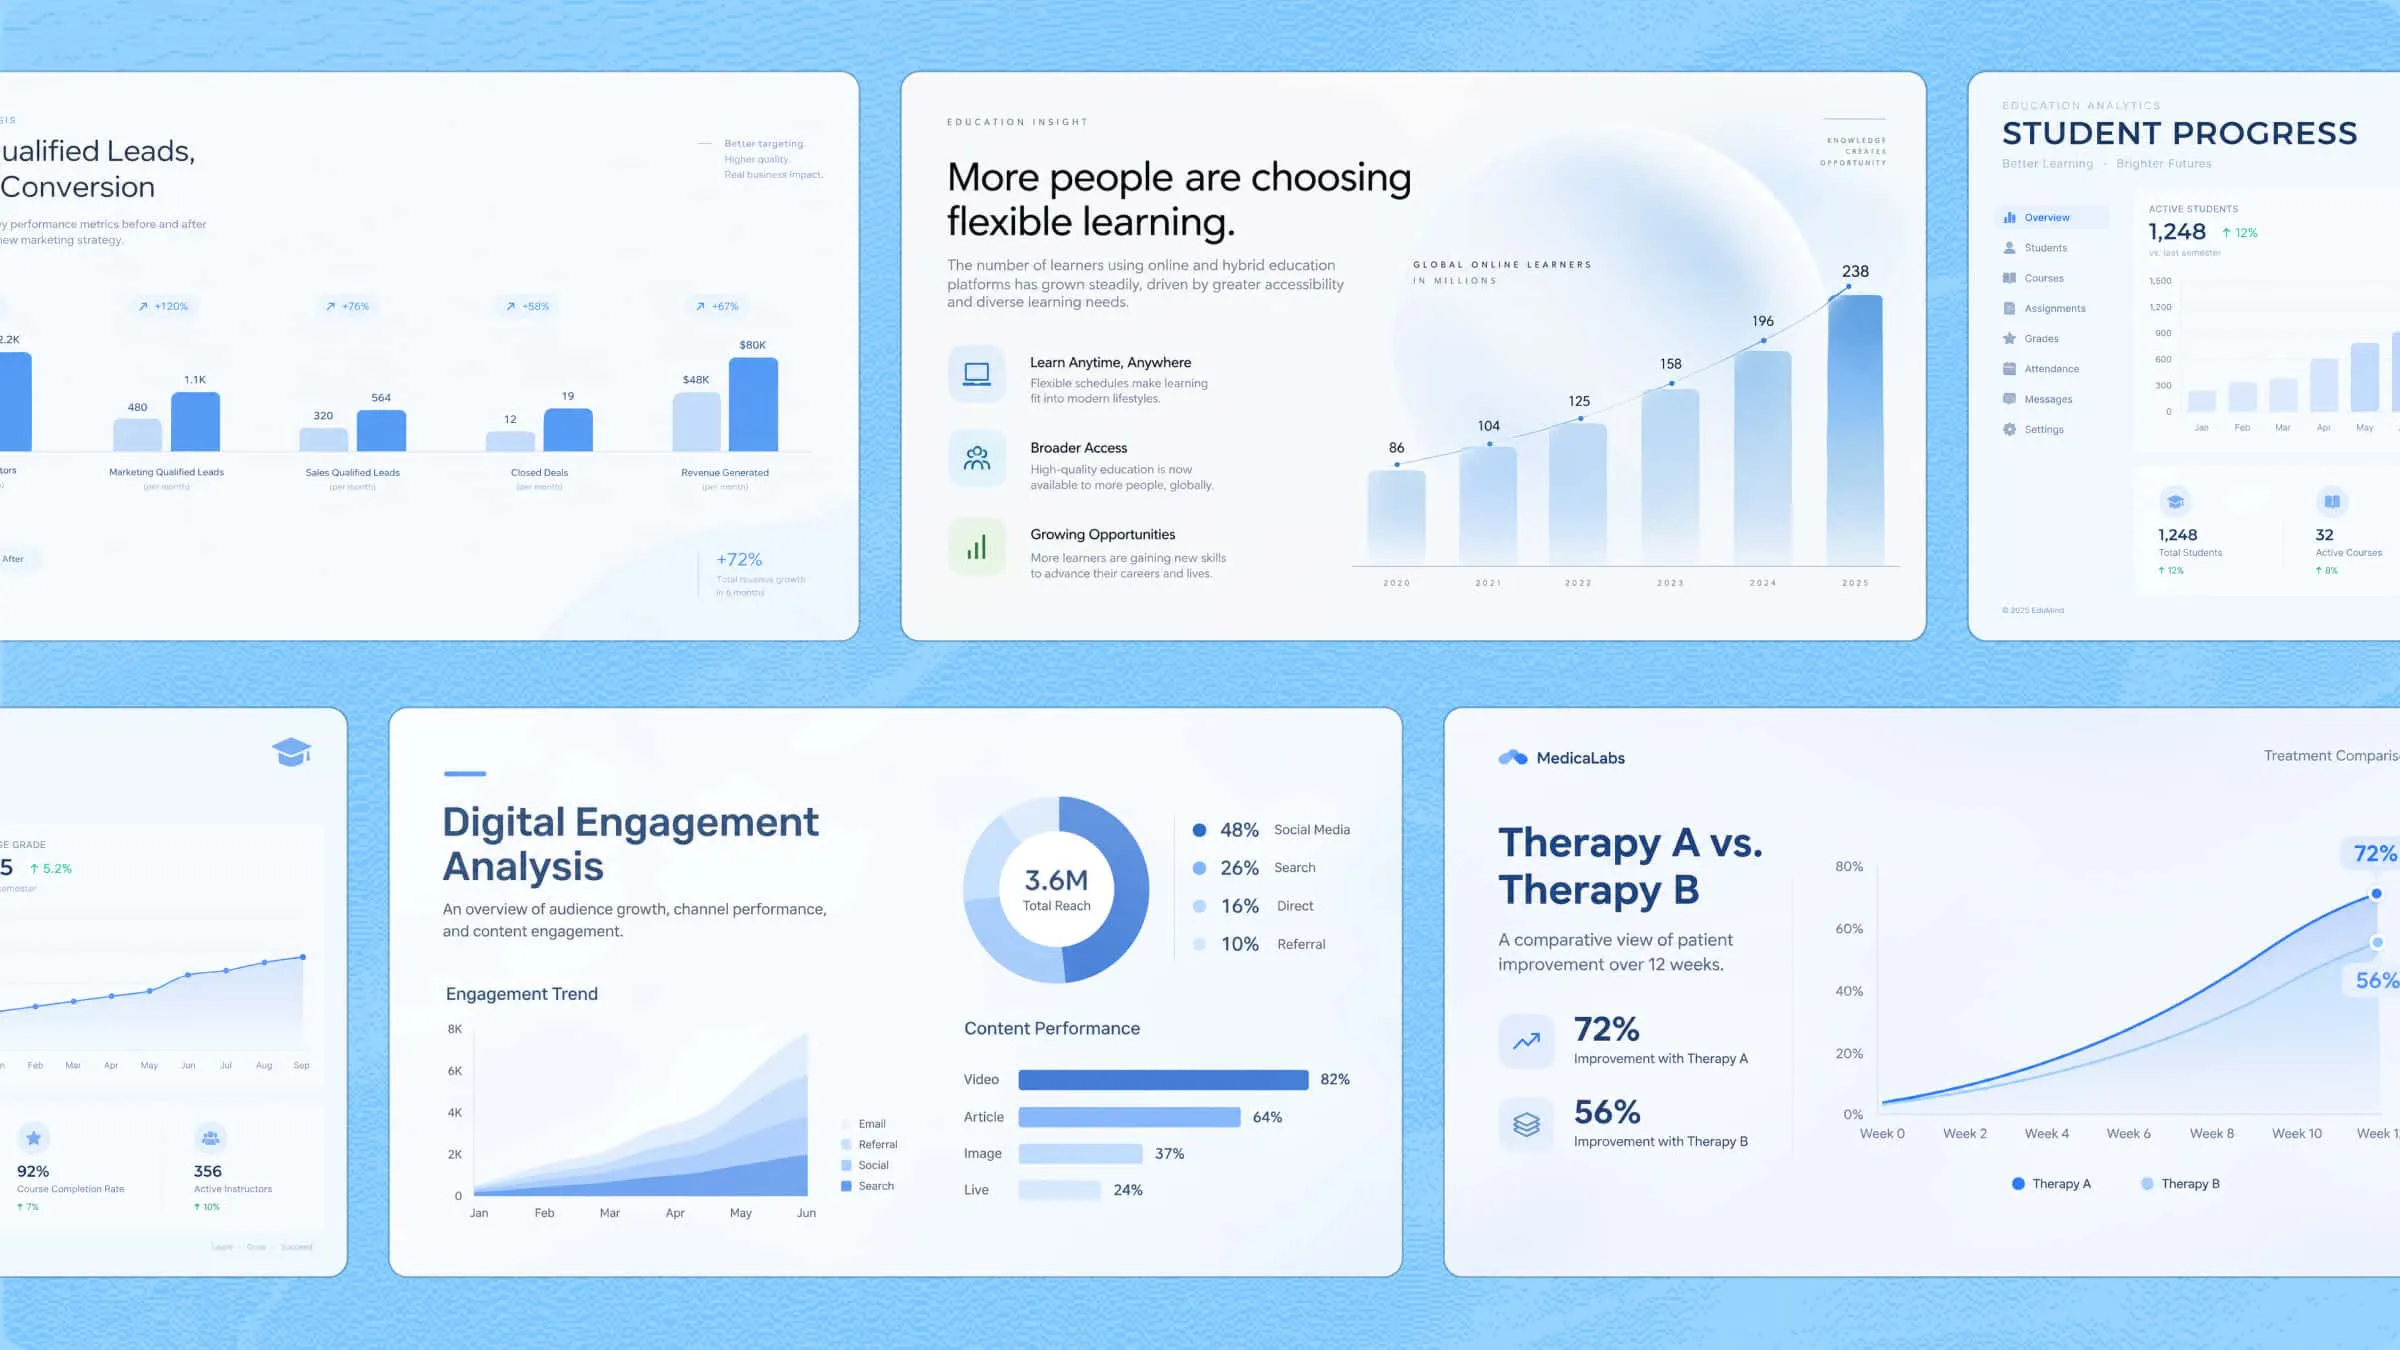
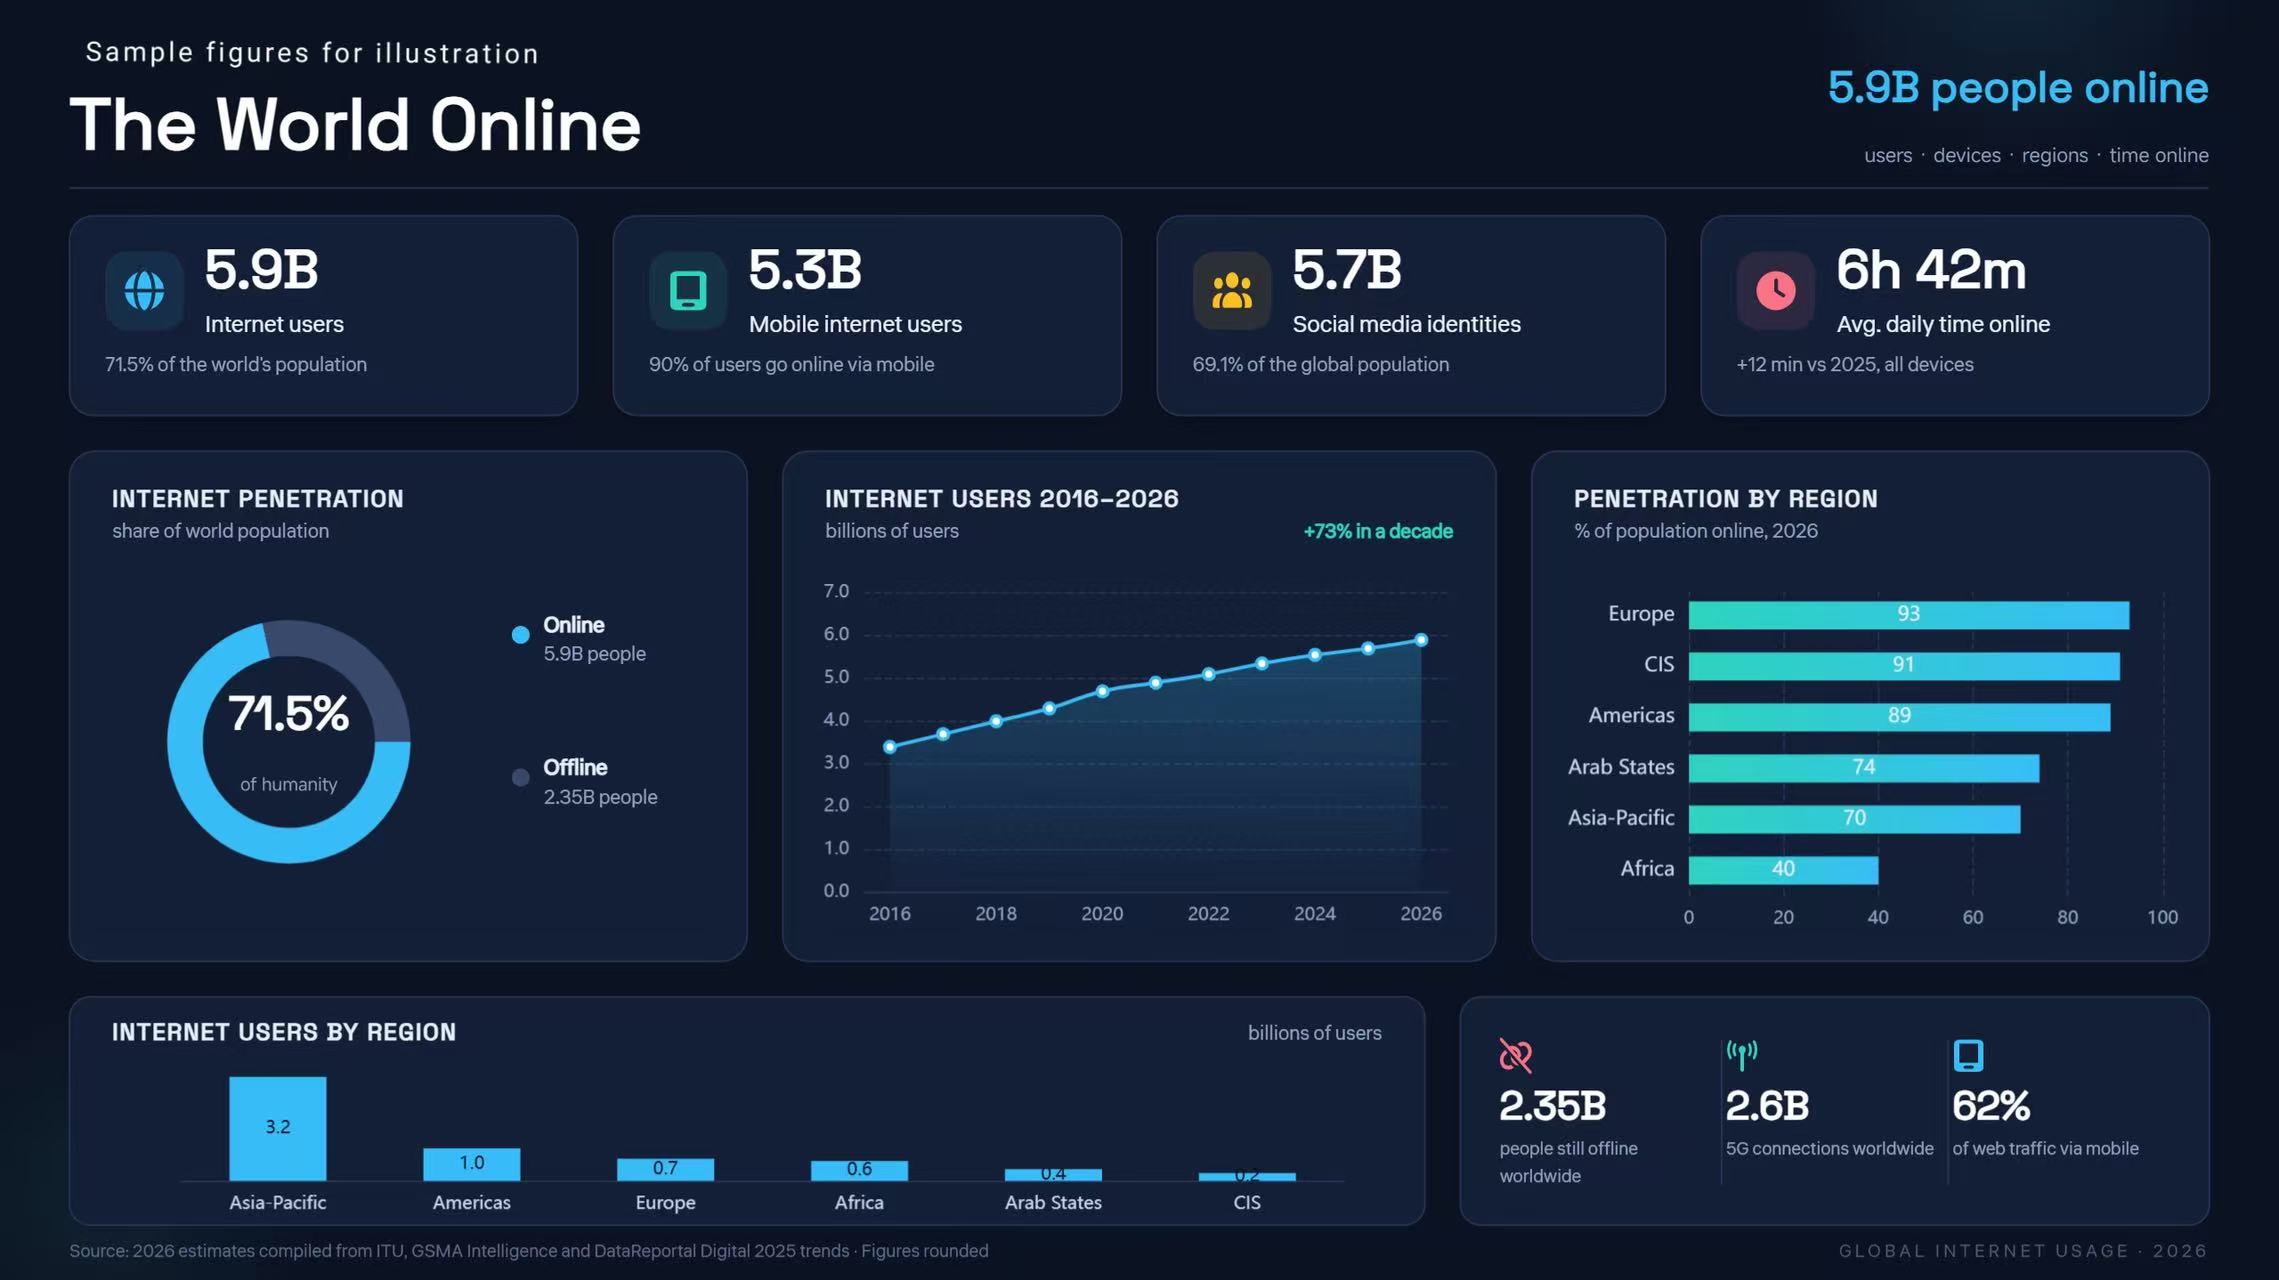
Statistical infographics turn numerical information into visuals that help readers understand data quickly. They are ideal for presenting survey results, research findings, percentages, and facts. Different chart types, including bar, pie, and line charts, highlight key figures and make comparisons easier. This approach helps readers recognize patterns and understand the message behind the data.
Example Prompt
Informational infographics
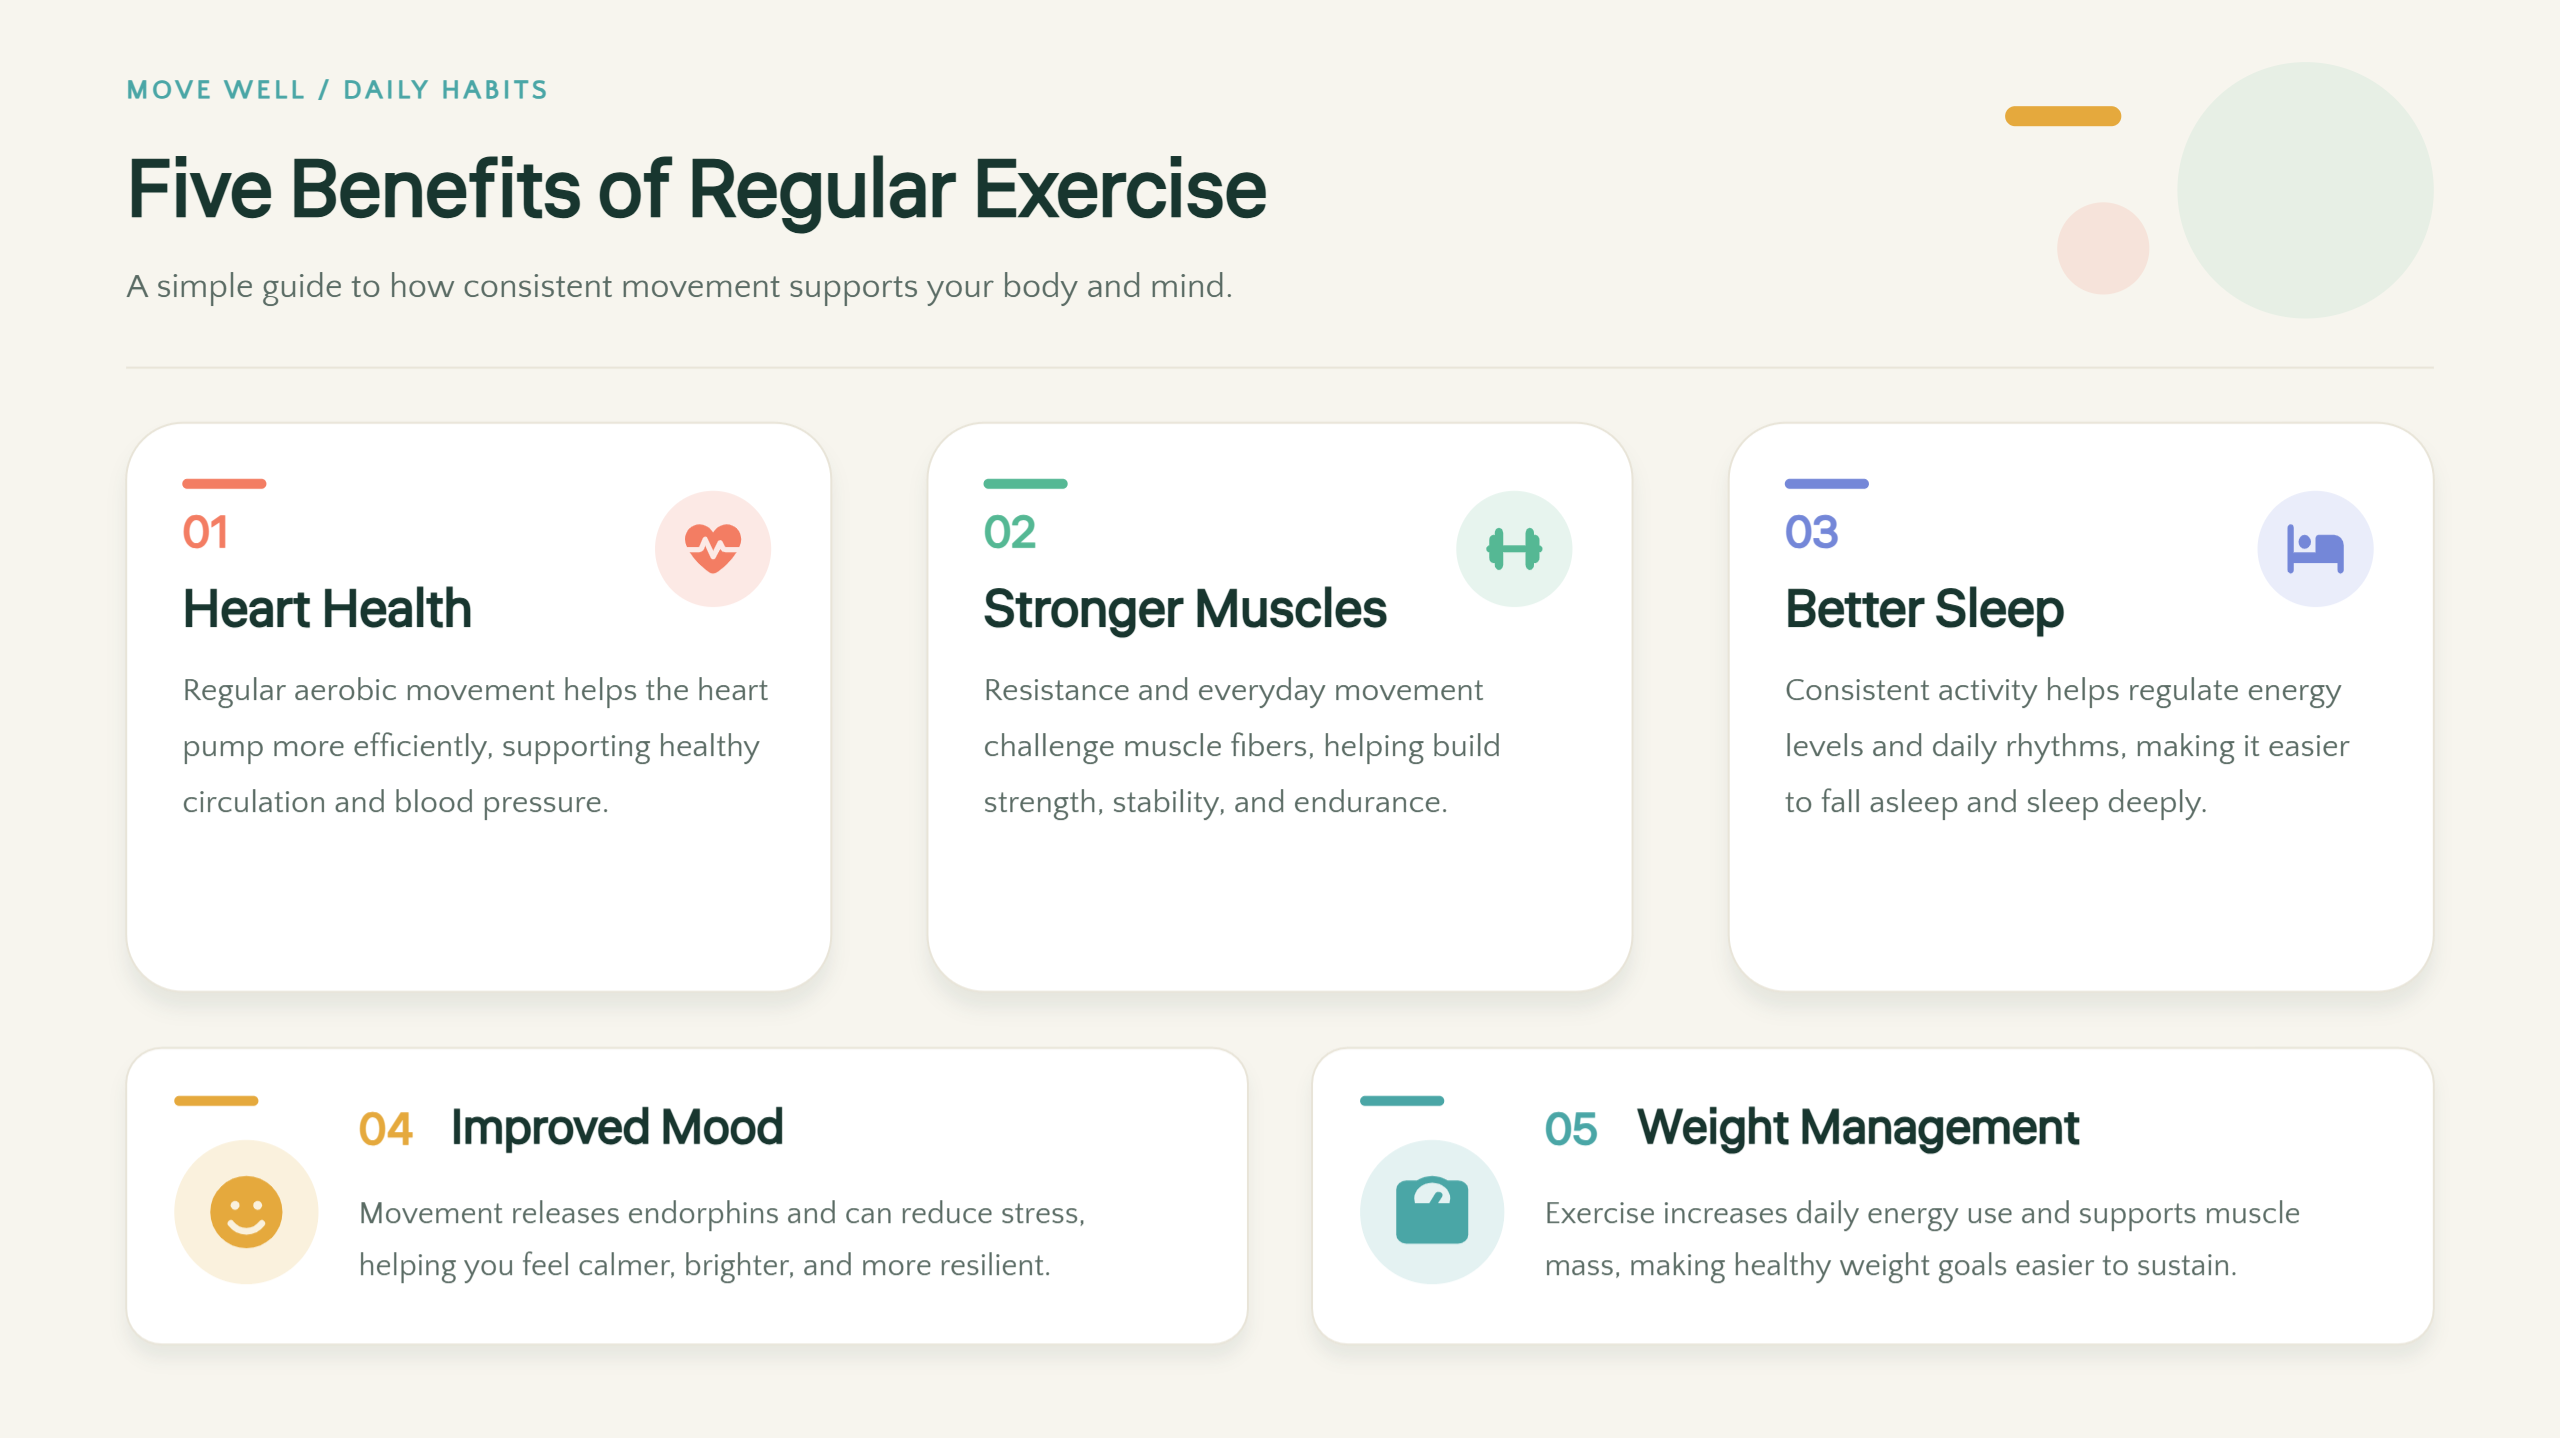
When readers need to learn about a new topic, informational infographics provide a clear overview. Key facts, short explanations, and headings break the subject into smaller sections. Numbered points and icons help organize the content into an easy-to-follow visual structure. This format works well for educational guides, awareness materials, and topic summaries.
Example Prompt
Timeline infographics
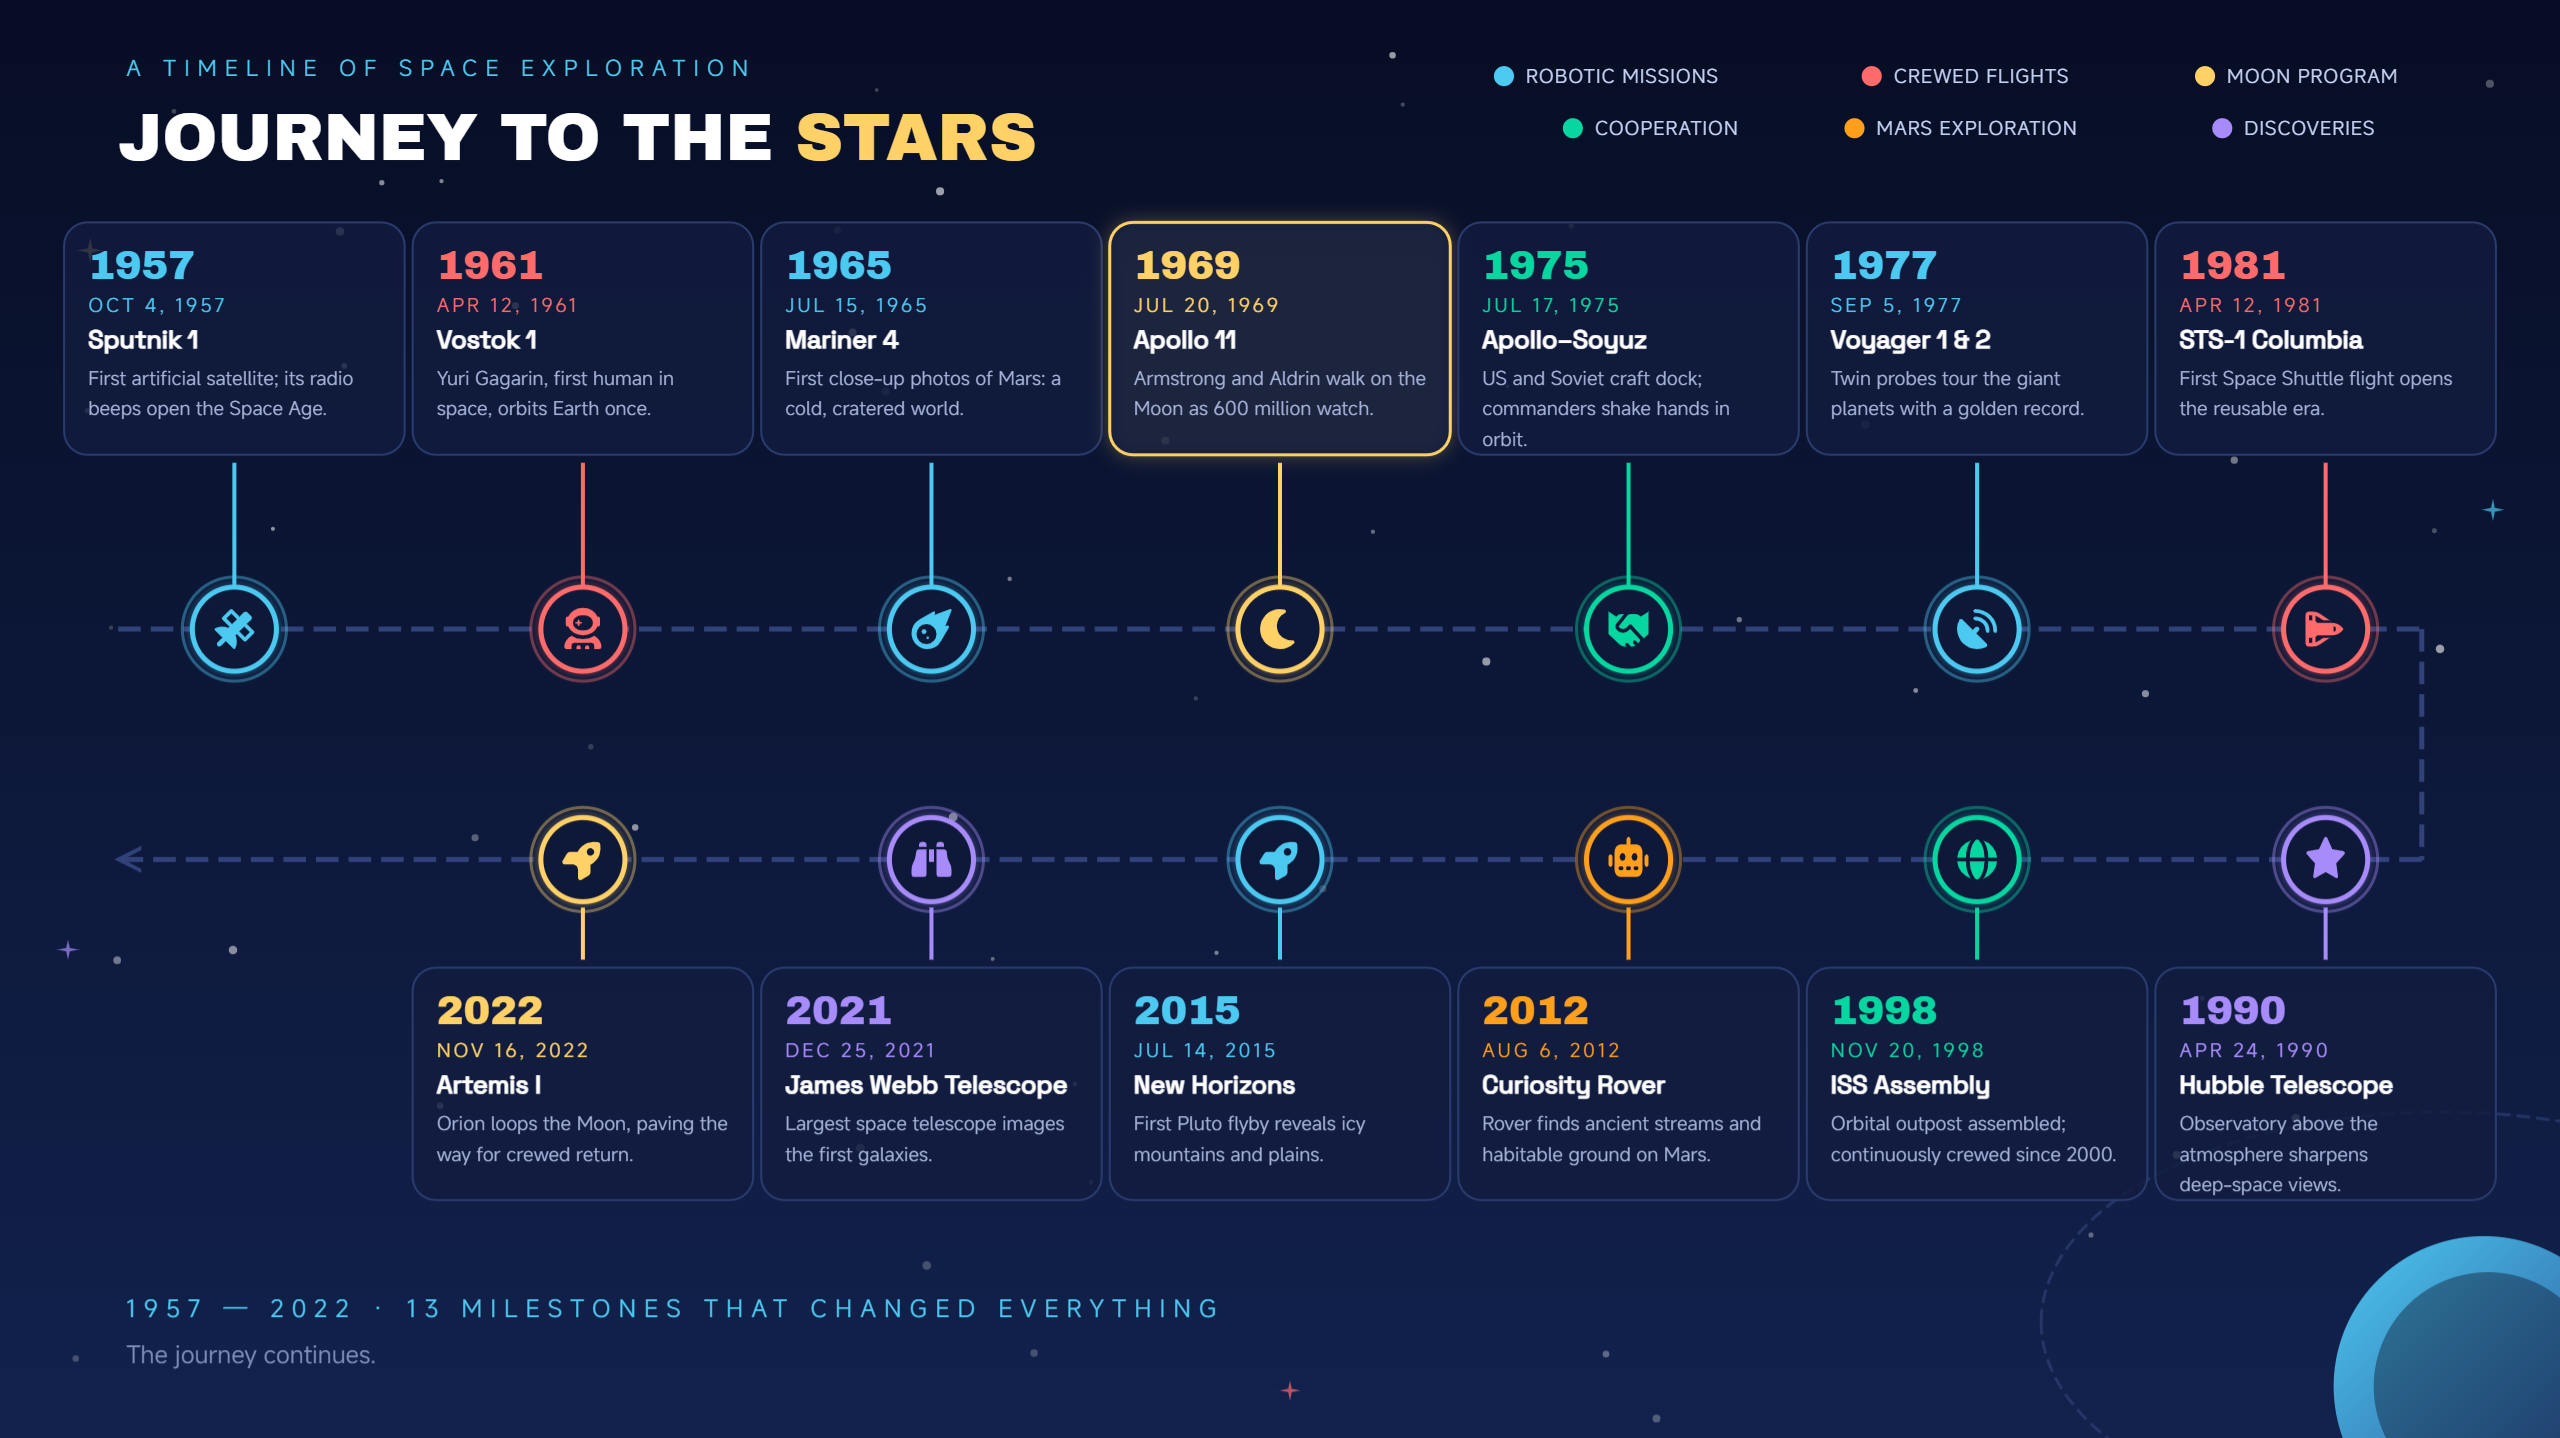
Timeline infographics arrange events in chronological order, helping readers follow changes and developments over time. Key dates, milestones, and short descriptions highlight important moments and their connections. Lines, icons, photos, and labels make each stage easier to recognize and understand. Such layouts are useful for historical summaries, project schedules, and personal achievements.
Example Prompt
Geographic infographics
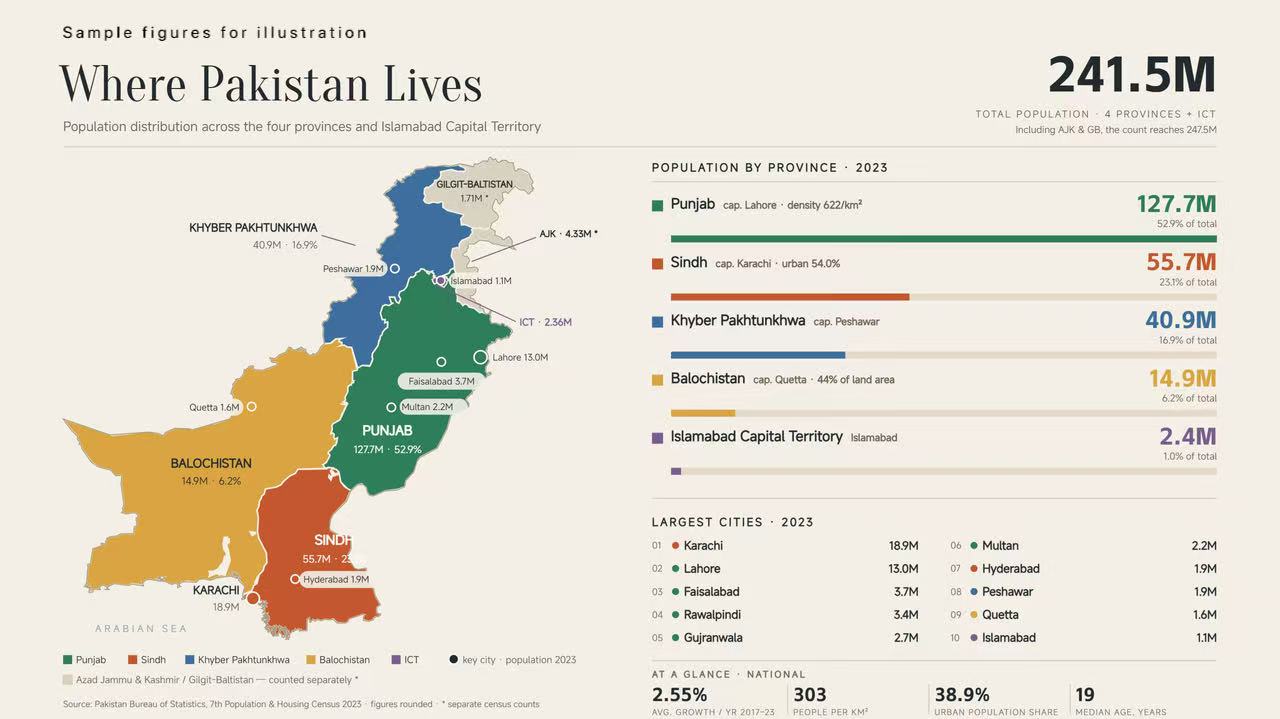
Geographic infographics present location-based information through maps, making regional data easier to explore. They help display population details, travel routes, climate patterns, and differences between areas. Map charts, location markers, labels, and color-coded regions highlight important details. This format is useful for comparing places and explaining geographical patterns.
Example Prompt
Comparison infographics
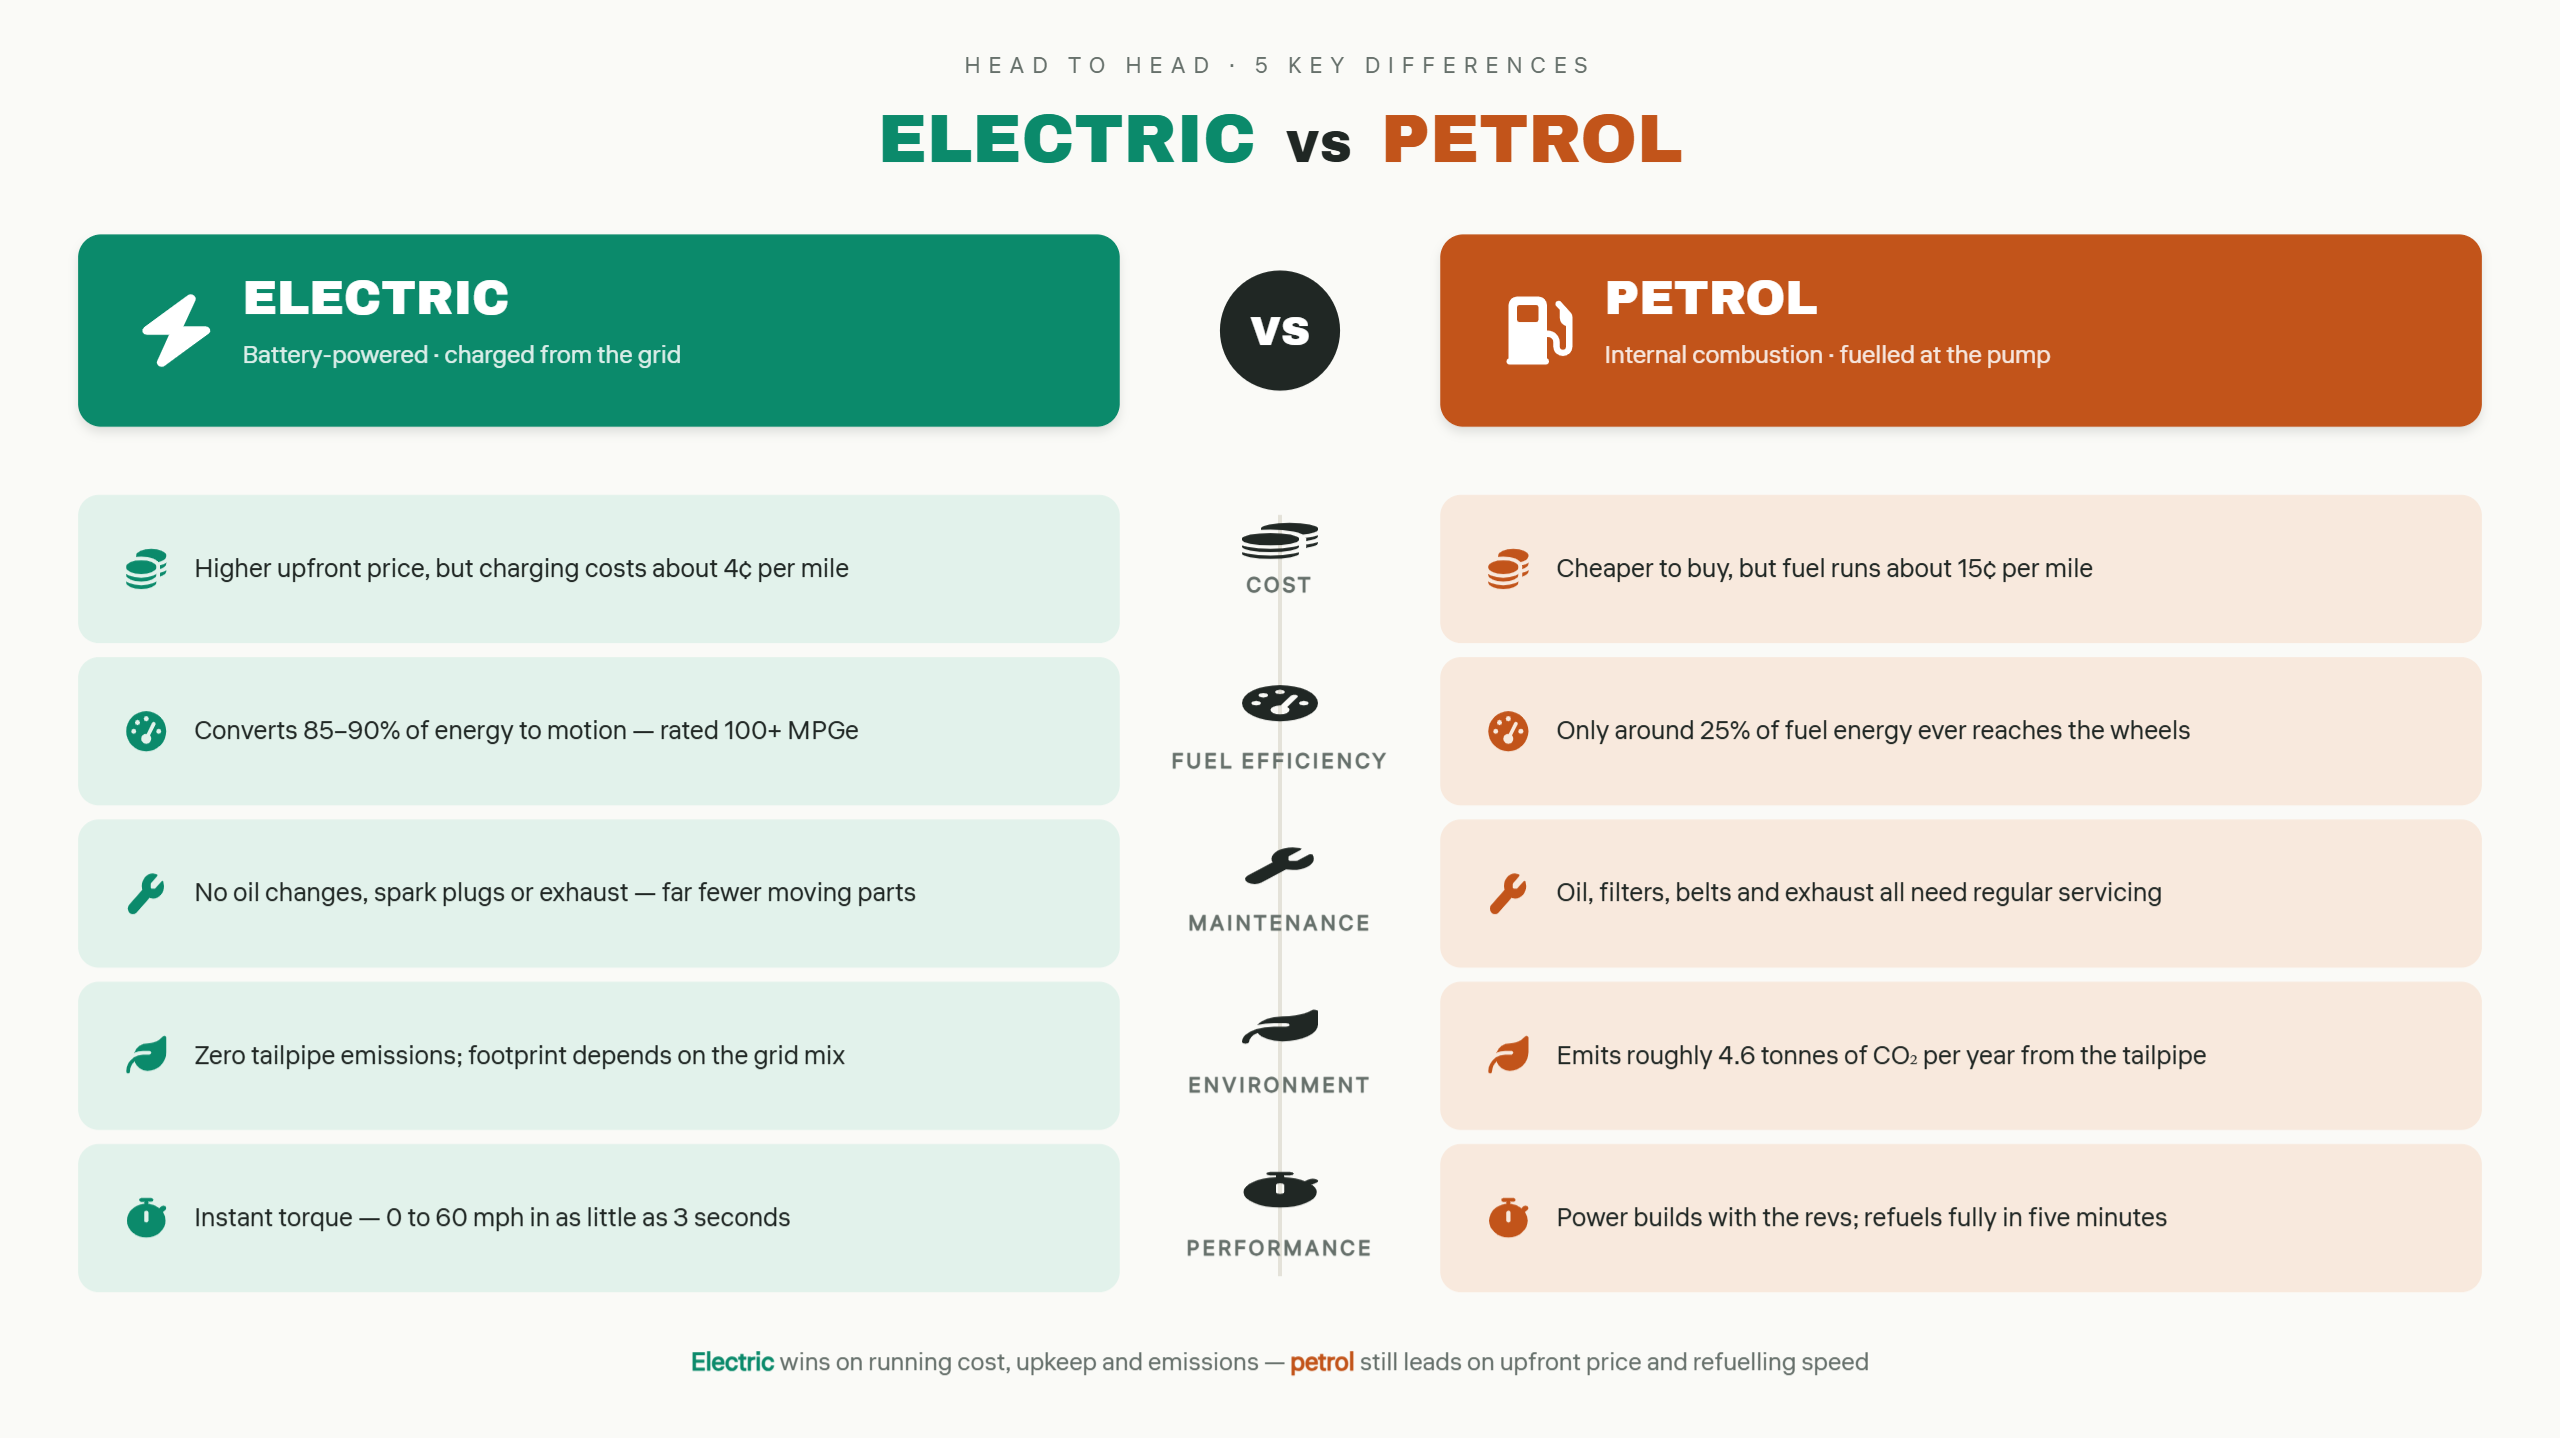
Comparison infographics present two or more options side by side, making their similarities and differences easy to understand. Features, prices, benefits, and drawbacks can be displayed without lengthy explanations. Contrasting colors, icons, short labels, and organized sections help readers examine each choice. Common uses include product reviews, service comparisons, and decision-making guides.
Example Prompt
Hierarchical infographics
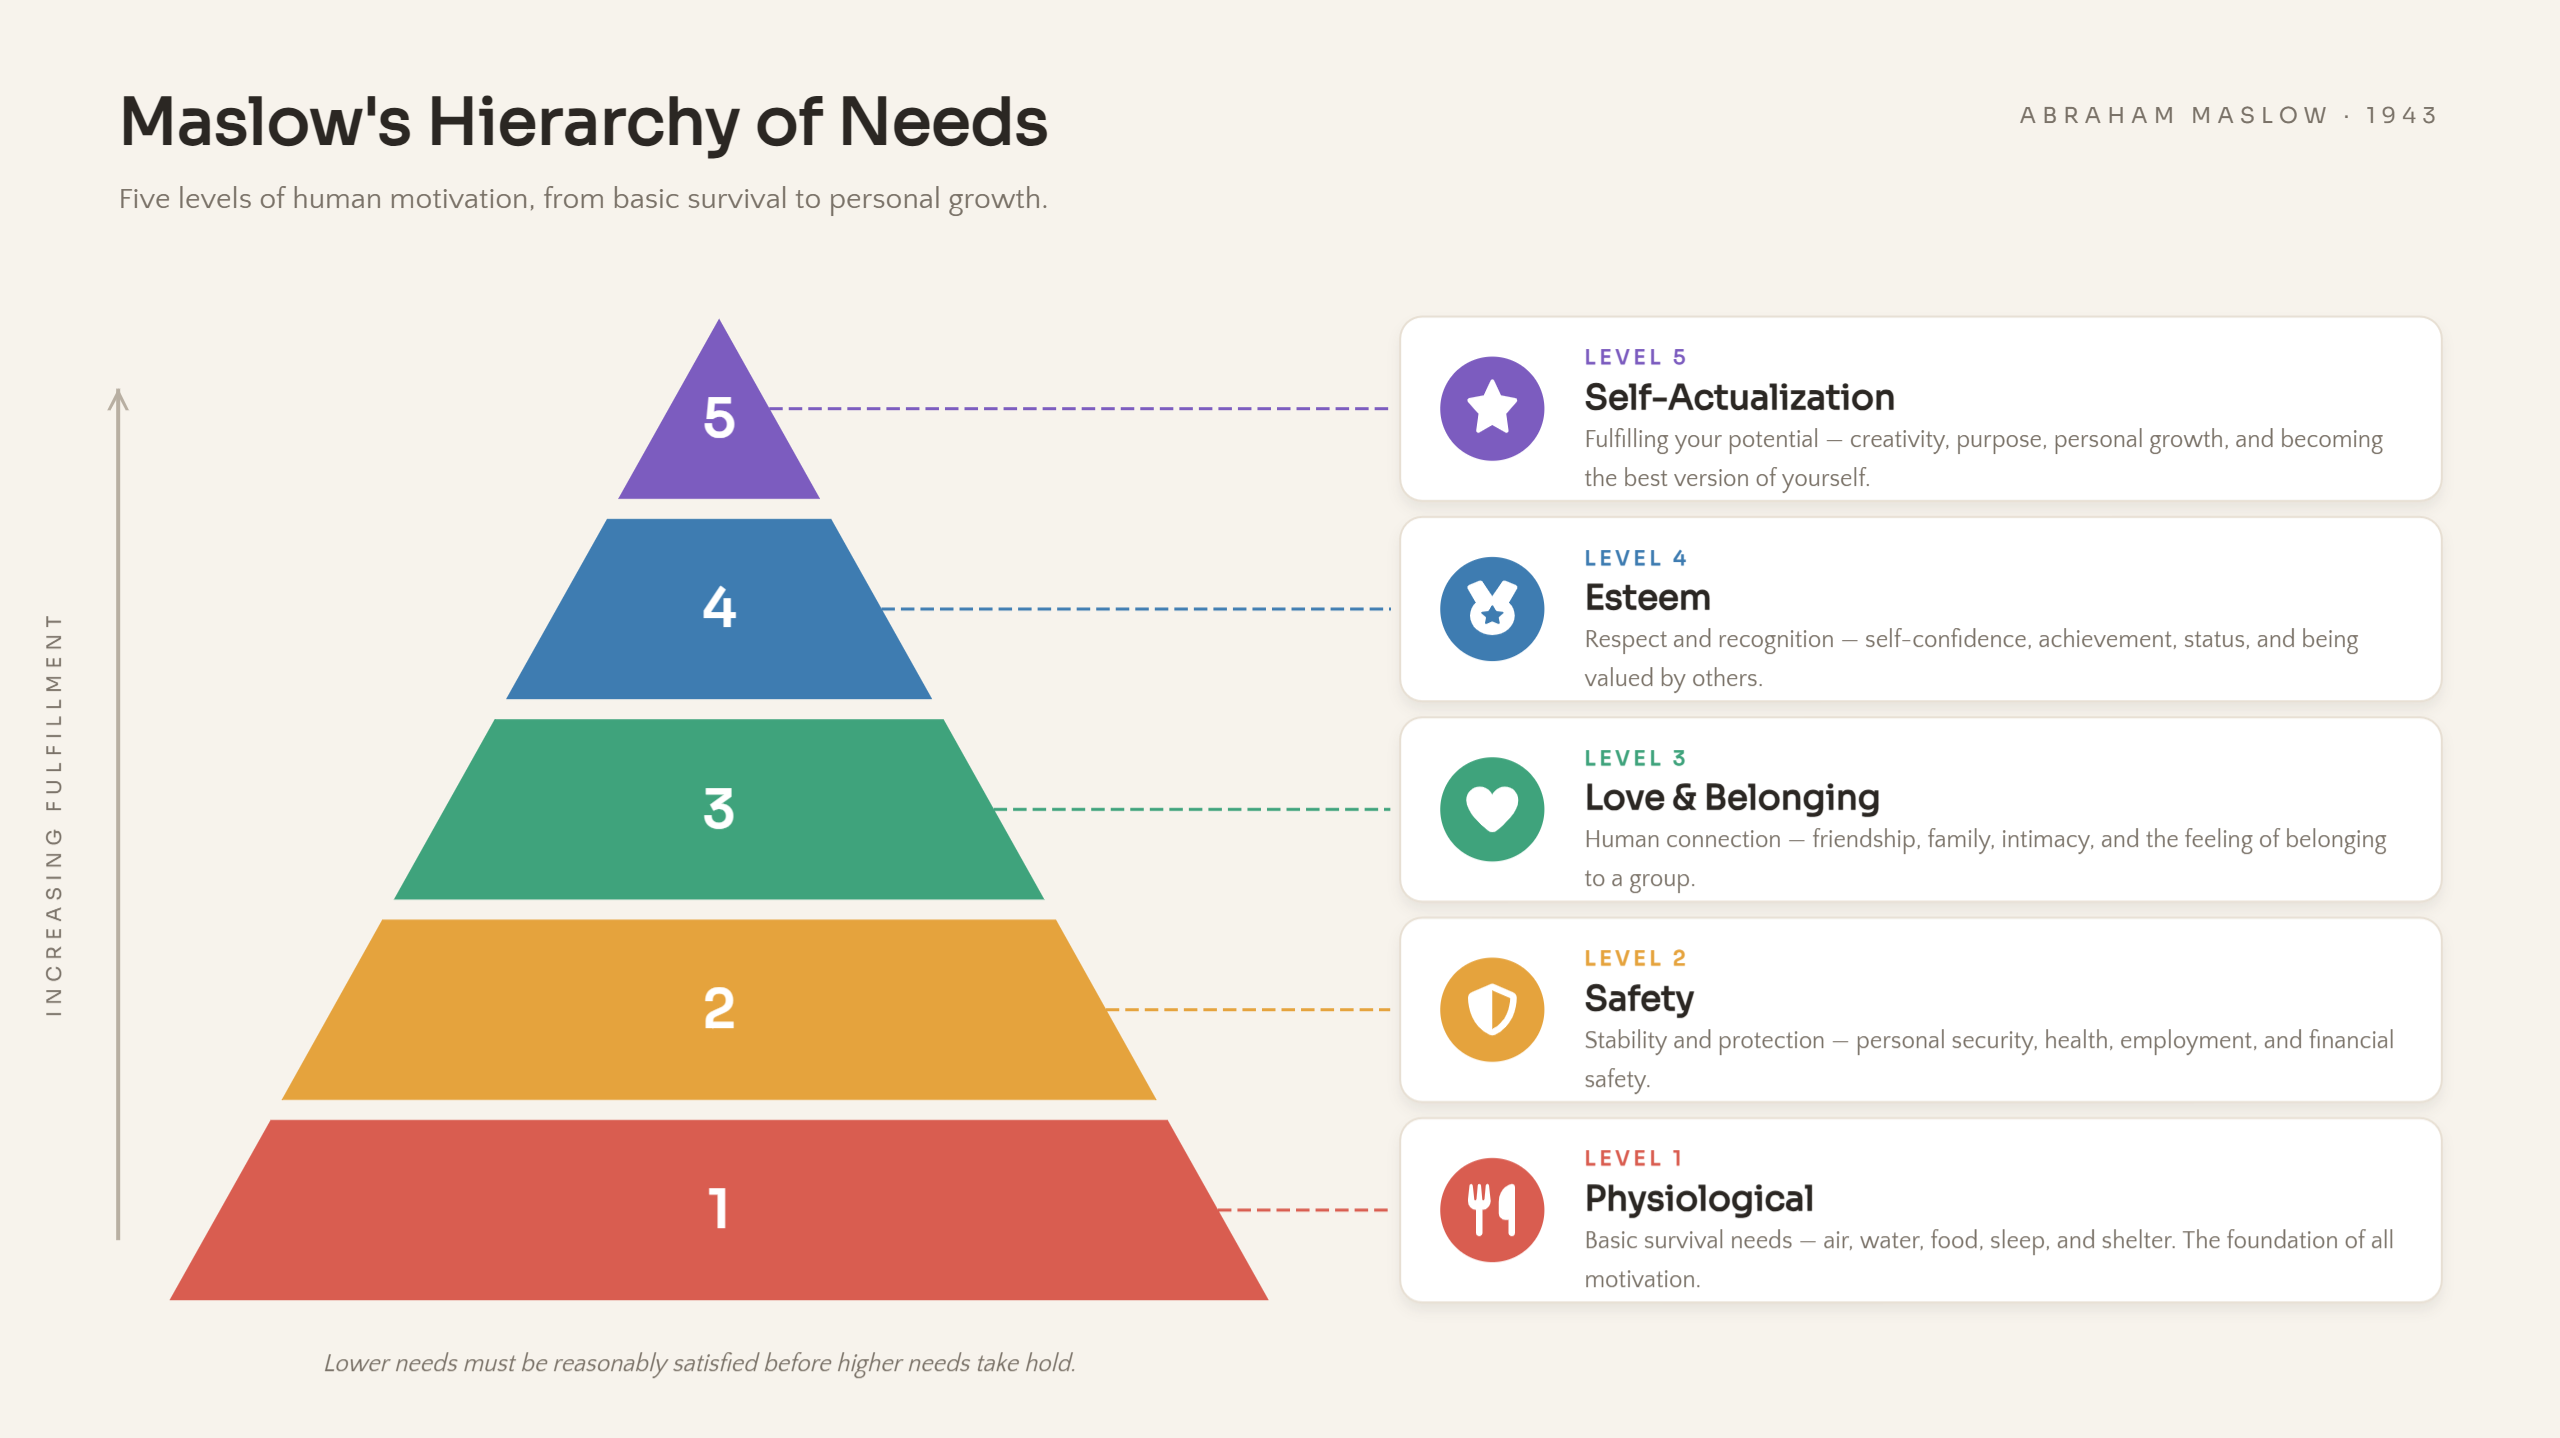
From business structures to levels of human needs, hierarchical infographics explain how information is ranked or grouped. A pyramid, tree diagram, or layered chart can represent different levels, starting with the highest or most important category. Short labels and visual sections make the order and connections easier to understand. Popular examples include company structures, ranking systems, and educational models.
Example Prompt
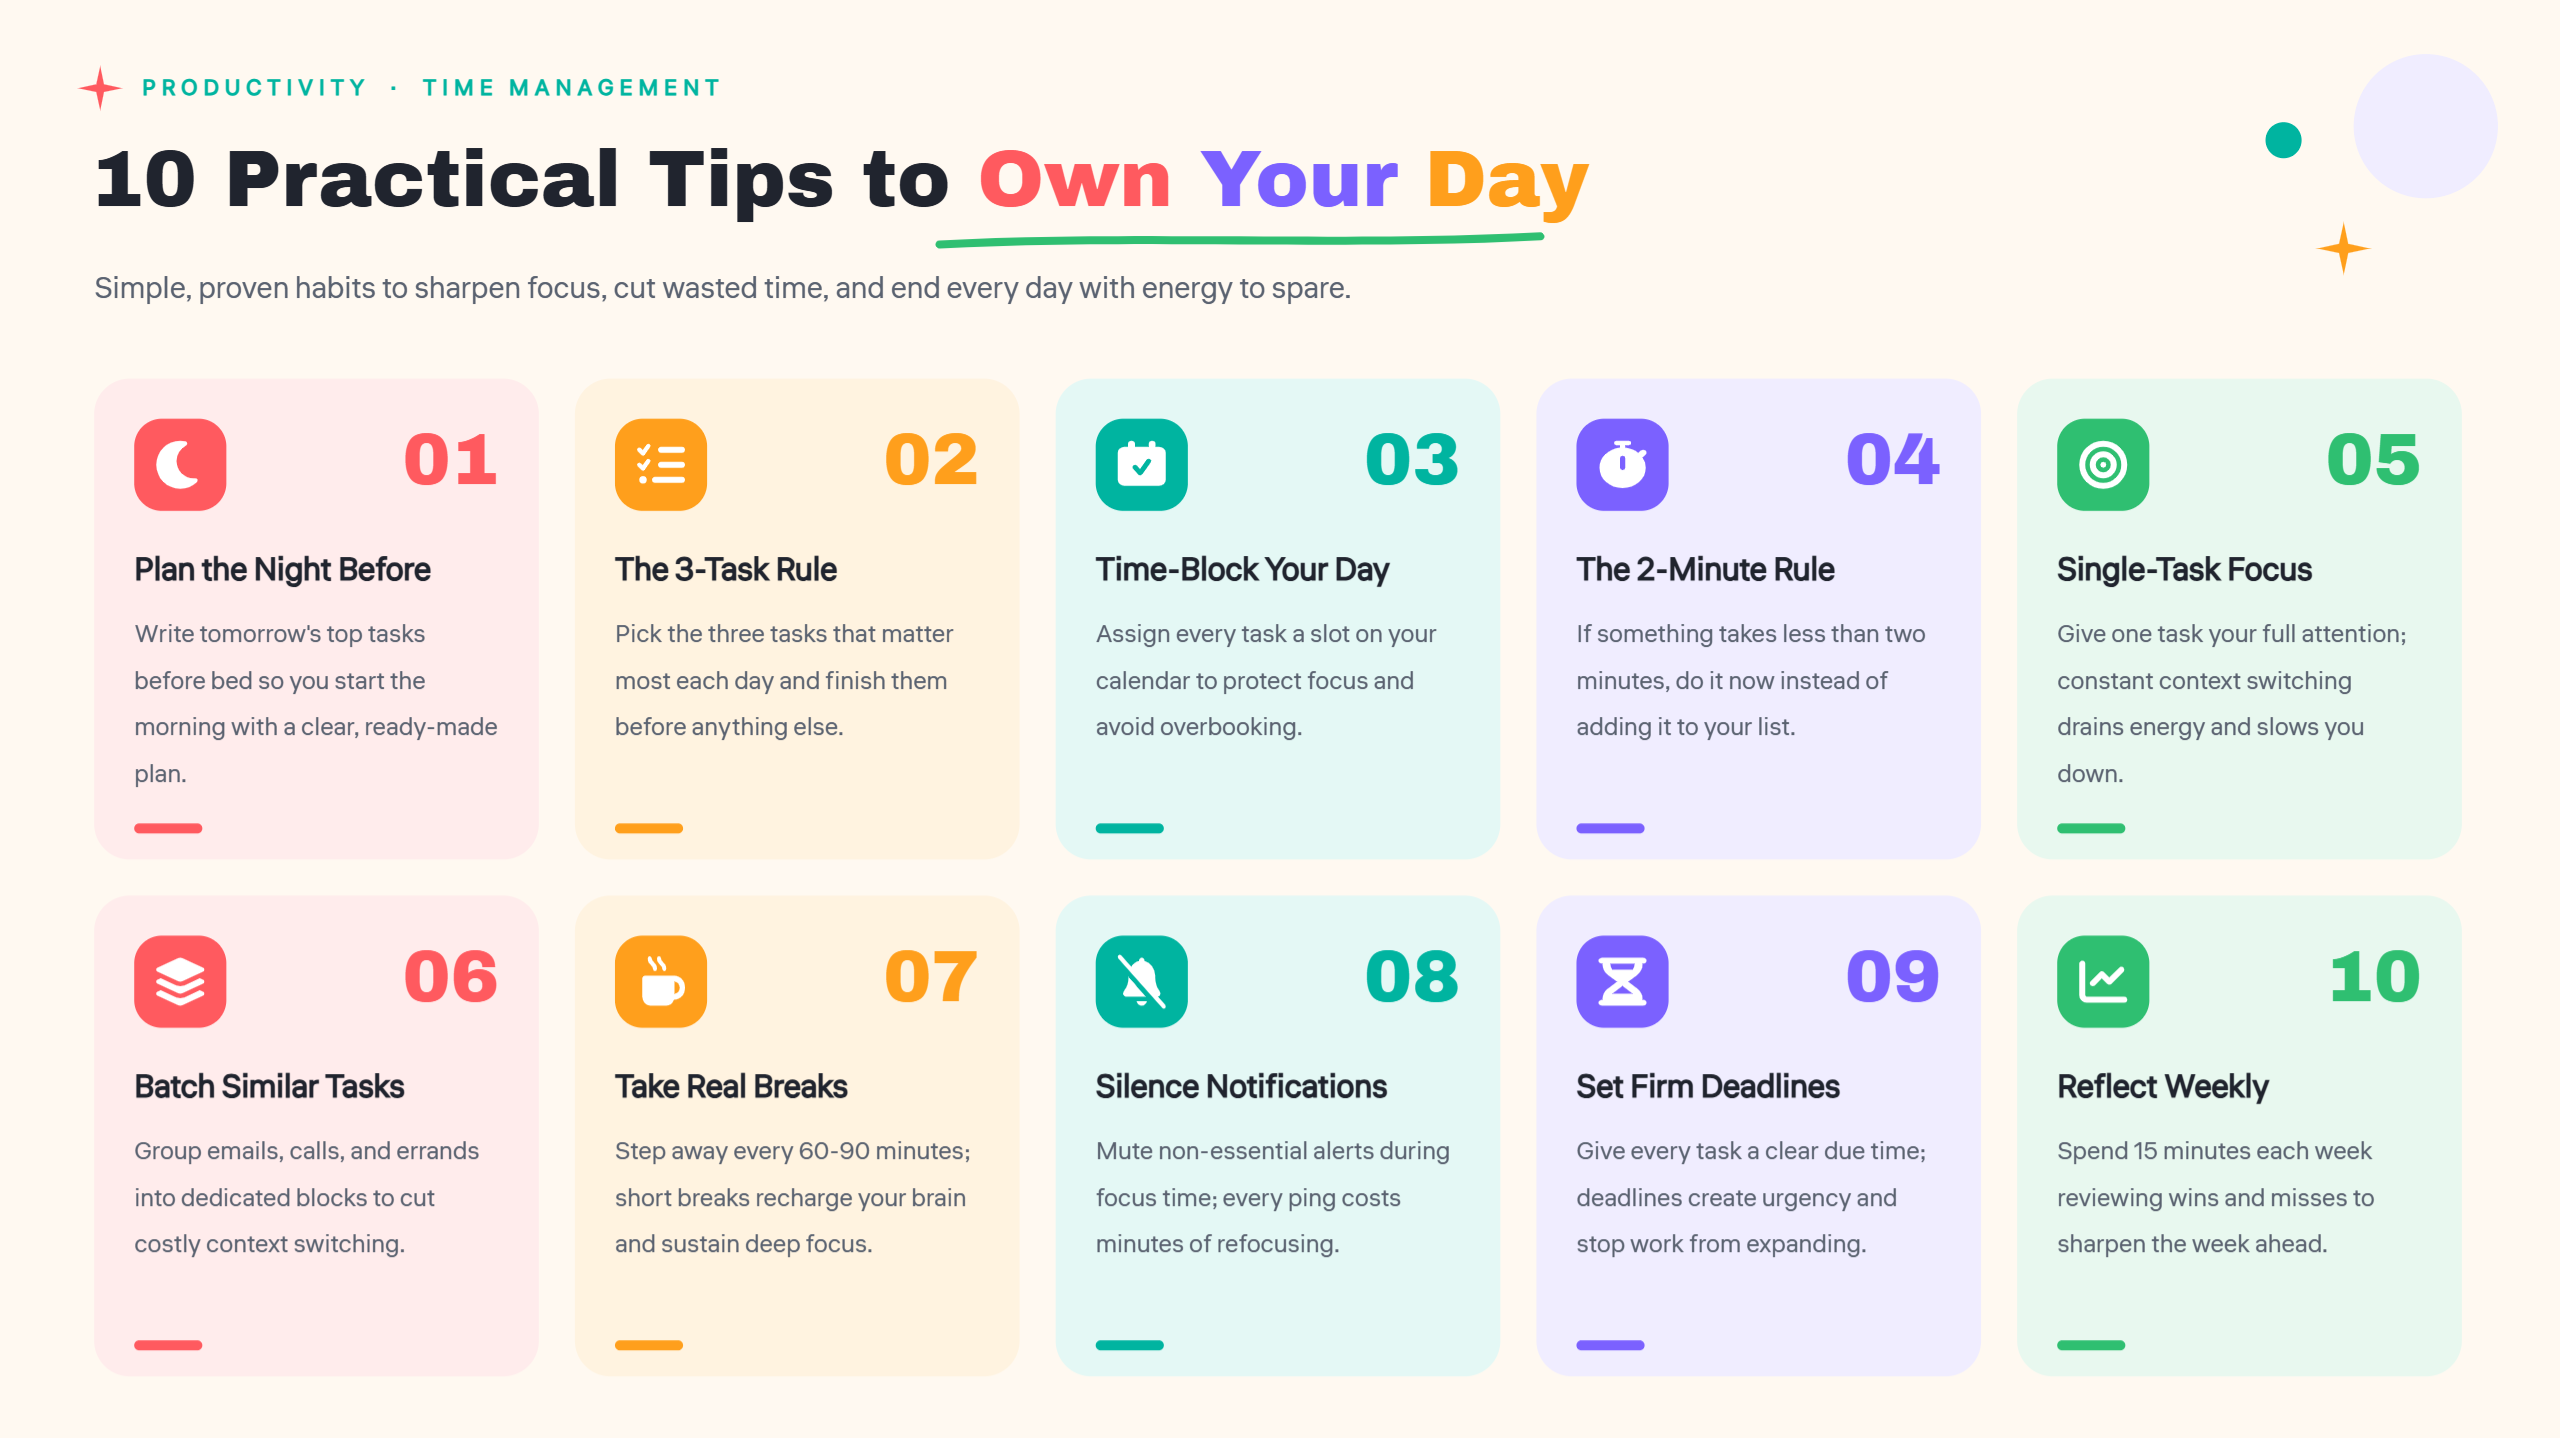
List infographics
List infographics turn a collection of points into an attractive visual presentation. They are ideal for sharing tips, useful resources, examples, or important facts in an organized way. Numbered sections, colorful icons, and creative layouts help each item stand out and keep the content easy to scan. This style works well for blog posts, quick guides, educational materials, and social media content.
Example Prompt
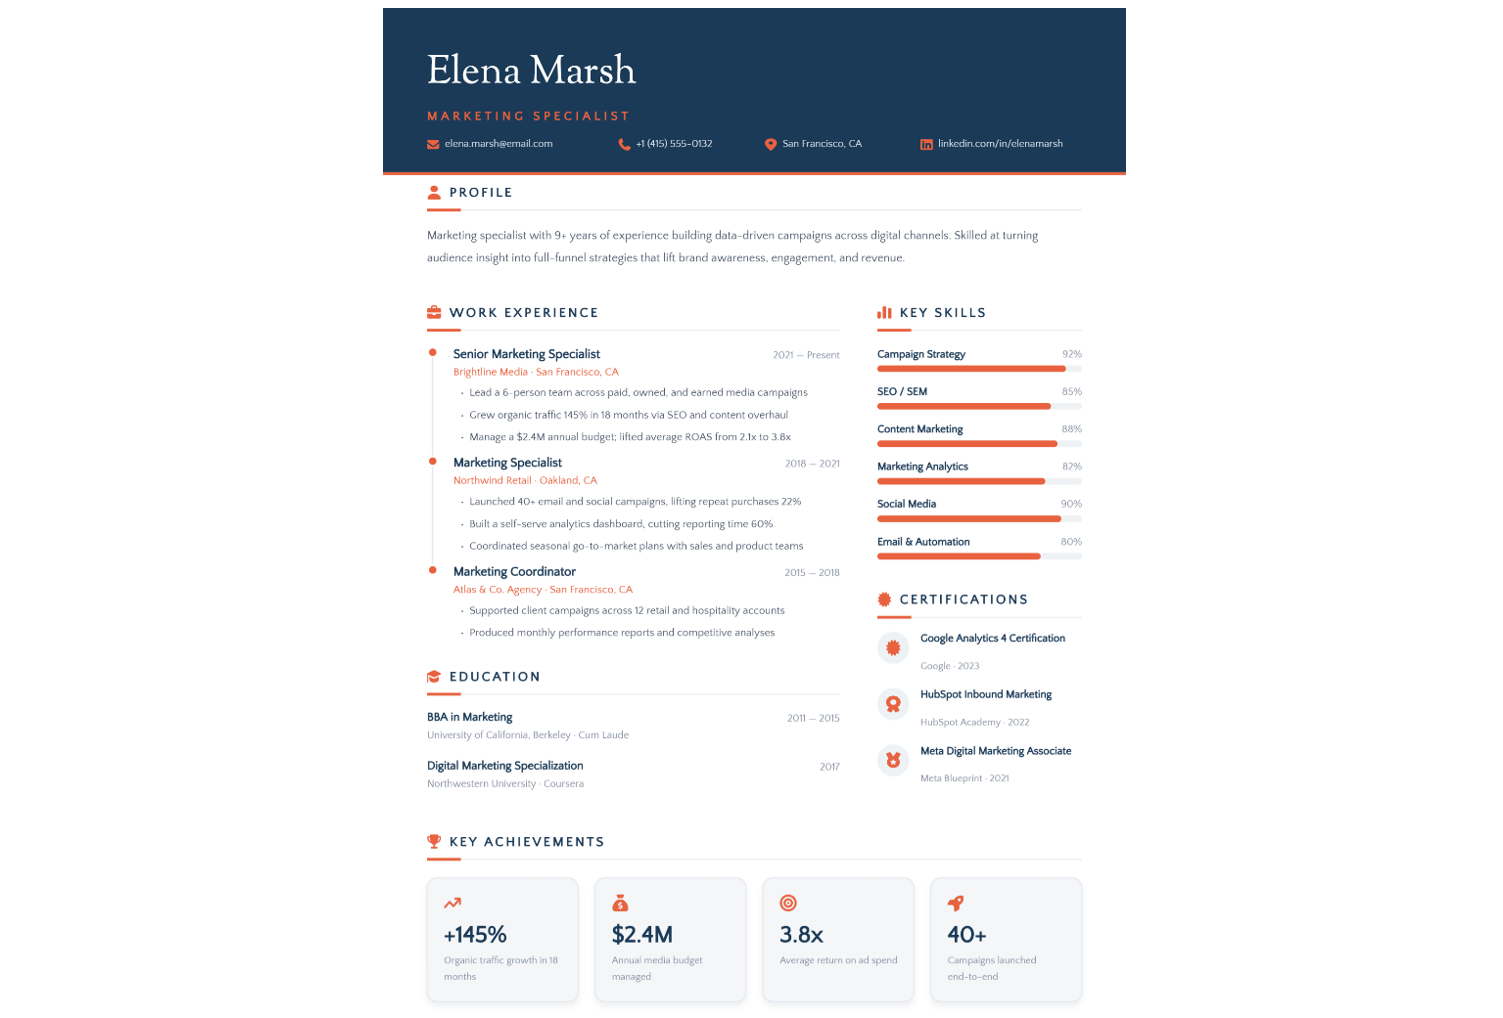
Resume infographics
Resume infographics present a person's qualifications and career history through creative visuals. Education, work experience, skills, and achievements can be arranged in a clear and attractive layout. Charts, icons, and simple color schemes help employers quickly understand a candidate's background. Such designs work well for online portfolios, job applications, and interview presentations.
Example Prompt
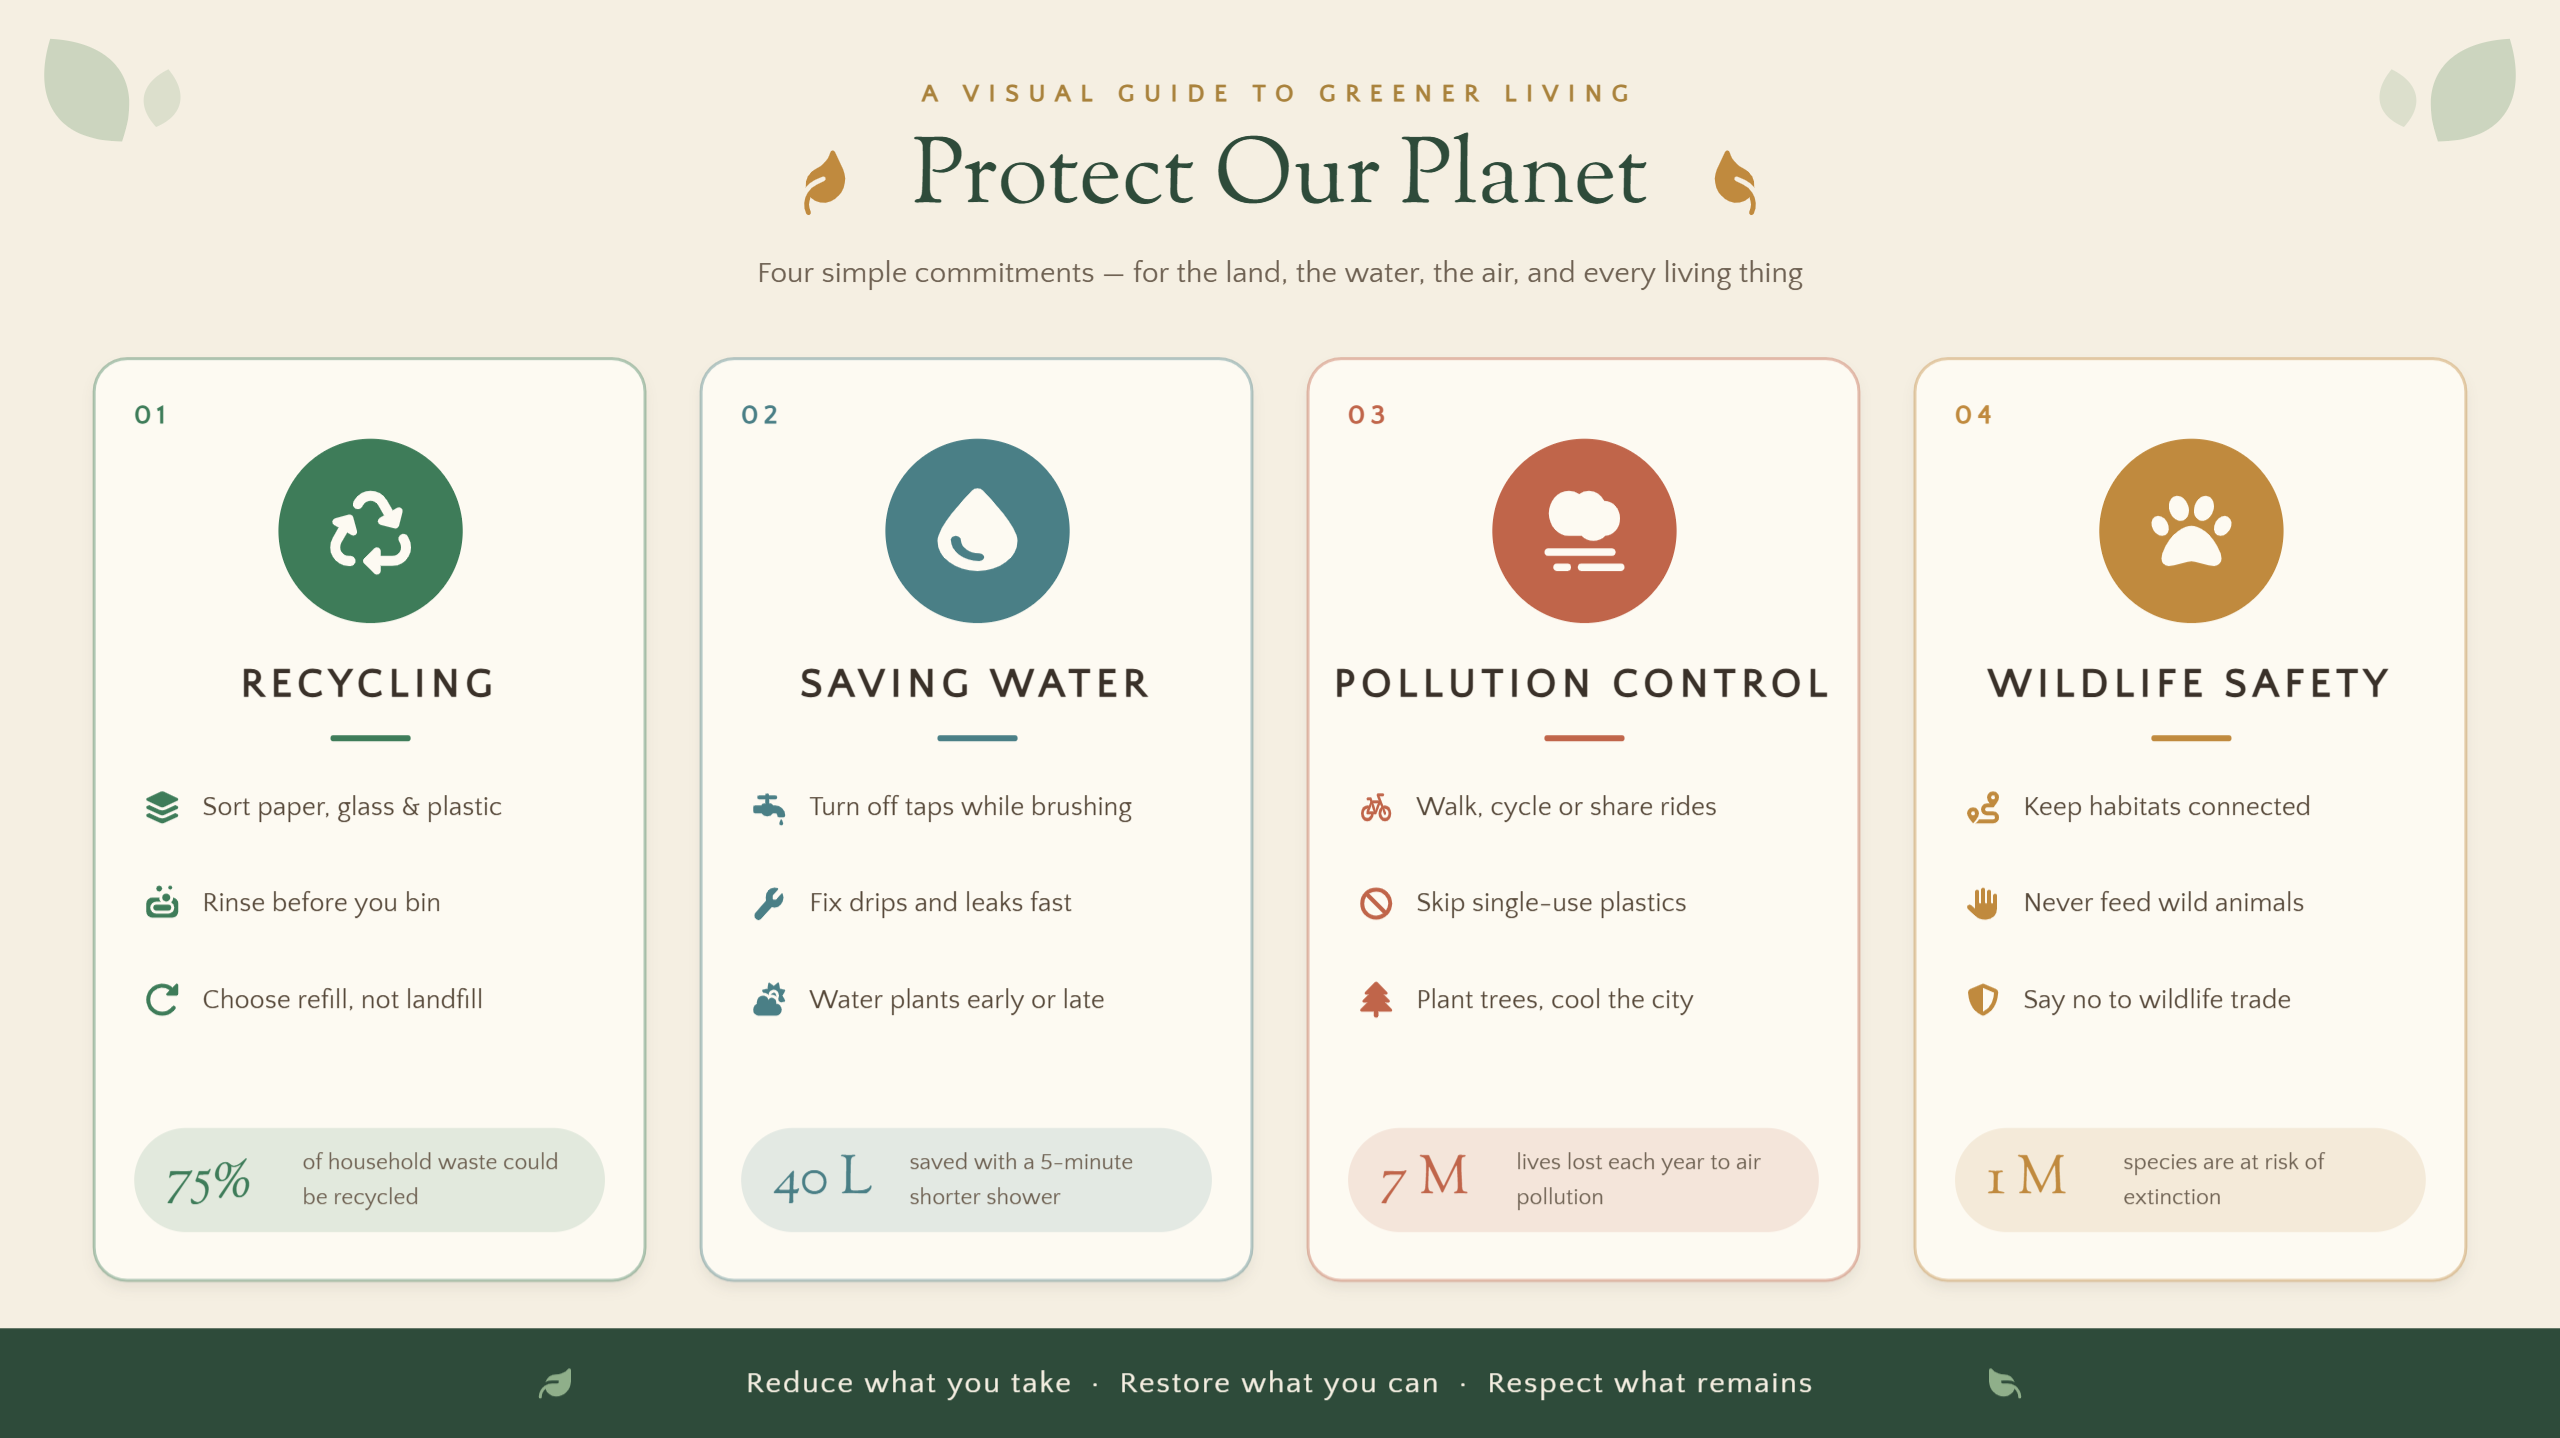
Visual-based infographics
Images and illustrations take center stage in visual-based infographics, allowing ideas to be shared with fewer words. Symbols, graphics, and short captions explain topics that might require lengthy descriptions. Meaningful visuals and colors keep the design attractive and the message easy to grasp. Common examples include brand storytelling, educational illustrations, and promotional content.
Example Prompt
Why choose Kimi Design for creating infographics
Kimi Design combines AI-powered generation with flexible editing tools to support the entire infographic creation process. From organizing source materials and visualizing information to refining layouts and exporting finished designs, it helps you turn ideas into clear, polished infographics with less manual effort. Here are the key features that make Kimi Design a practical tool for creating, editing, and exporting infographics.
Build infographics around your prompts and references
Start with a text prompt outlining your topic, audience, and essential information, or provide documents, spreadsheets, and visual references. Kimi Design arranges your materials into a cohesive infographic with readable text, supporting graphics, and a logical flow.
Generate different infographic types and layouts
There are multiple infographic formats to match different content and communication goals, including timelines, flowcharts, comparison charts, statistical infographics, and process diagrams. Choose layouts that suit the information you want to present. Kimi Design helps organize information into suitable visual structures that make key points easier to follow and understand.
Make targeted changes to your infographic
Update wording, adjust colors, rearrange layouts, or modify graphic elements through natural-language prompts. Comments and manual editing provide additional ways to refine specific parts of the design and align the result with your requirements.
Export designs for sharing and future updates
Export your infographic in PNG, JPG, PSD, PDF, or Slides format. PNG and JPG support custom export sizes in pixels or centimeters, with PNG also offering transparent backgrounds. PSD preserves editing states and layer data, making it easier to share designs and continue refining them later.
How to choose the right type of infographic
Selecting the right infographic becomes easier when you understand your content and what you want to communicate. Consider your main goal, the amount of information, and how readers will interact with the visuals. Here are some factors to help you choose the right types of infographics.
Start with the question you want to answer
Begin by deciding what you want readers to learn from your infographic. Focus on one main question or message to keep the content clear and relevant. Your goal will help you select a visual format that communicates the information effectively.
Identify your target audience
Think about the people who will read or view your infographic. Consider their age, interests, and knowledge of the subject before planning the content. Simple language and familiar visuals can make your message easier for them to understand.
Choose a suitable layout according to your information structure
Review the content you want to present and identify whether it includes steps, dates, statistics, comparisons, or key facts. Then choose an infographic format that fits the information: use process layouts for instructions, timelines for events and milestones, and charts, maps, or lists to present other types of data clearly.
Assess the volume and complexity of your data
Consider how much information needs to fit into your infographic. Large amounts of data may require charts, separate sections, or a more detailed layout. Keep descriptions brief and remove unnecessary details to prevent the design from looking crowded.
Check where and how the infographic will be used
Consider the platform where you plan to share your infographic, such as social media, websites, or presentations. Each platform may require different dimensions, text sizes, and visual details. Make sure the final layout remains clear and readable on different screens.
Conclusion
From statistical data and process steps to comparisons and visual storytelling, different infographic types suit different communication needs. Choosing the right format helps present information clearly and makes it easier for your audience to understand key messages. With Kimi Design, you can turn these ideas into infographics by entering a prompt, then refine the generated design through chat instructions or manual editing.