Turning information into clear, engaging visuals requires more than simply adding charts, images, or decorative elements. The right visual approach depends on the type of information you want to communicate. Statistics may be easier to understand through charts, while complex topics often benefit from diagrams, timelines, or illustrated explanations. To help you get started, here are 10 infographic ideas for different content needs, along with practical prompts you can use to create them with Kimi Design.
Overview of 10 aesthetic infographic design ideas
Here is an overview of 10 aesthetic infographic ideas, along with their main purposes and example applications.
| Infographic idea | Main purpose | Recommended visual elements | Example application | Recommended content format |
|---|---|---|---|---|
| Process infographic | Explain a sequence of activities | Arrows, illustrations, numbered stages | Coffee production | Sequential flow diagram |
| Component breakdown | Simplify complex information | Labeled diagrams, pointers, icons | Computer components | Annotated component diagram |
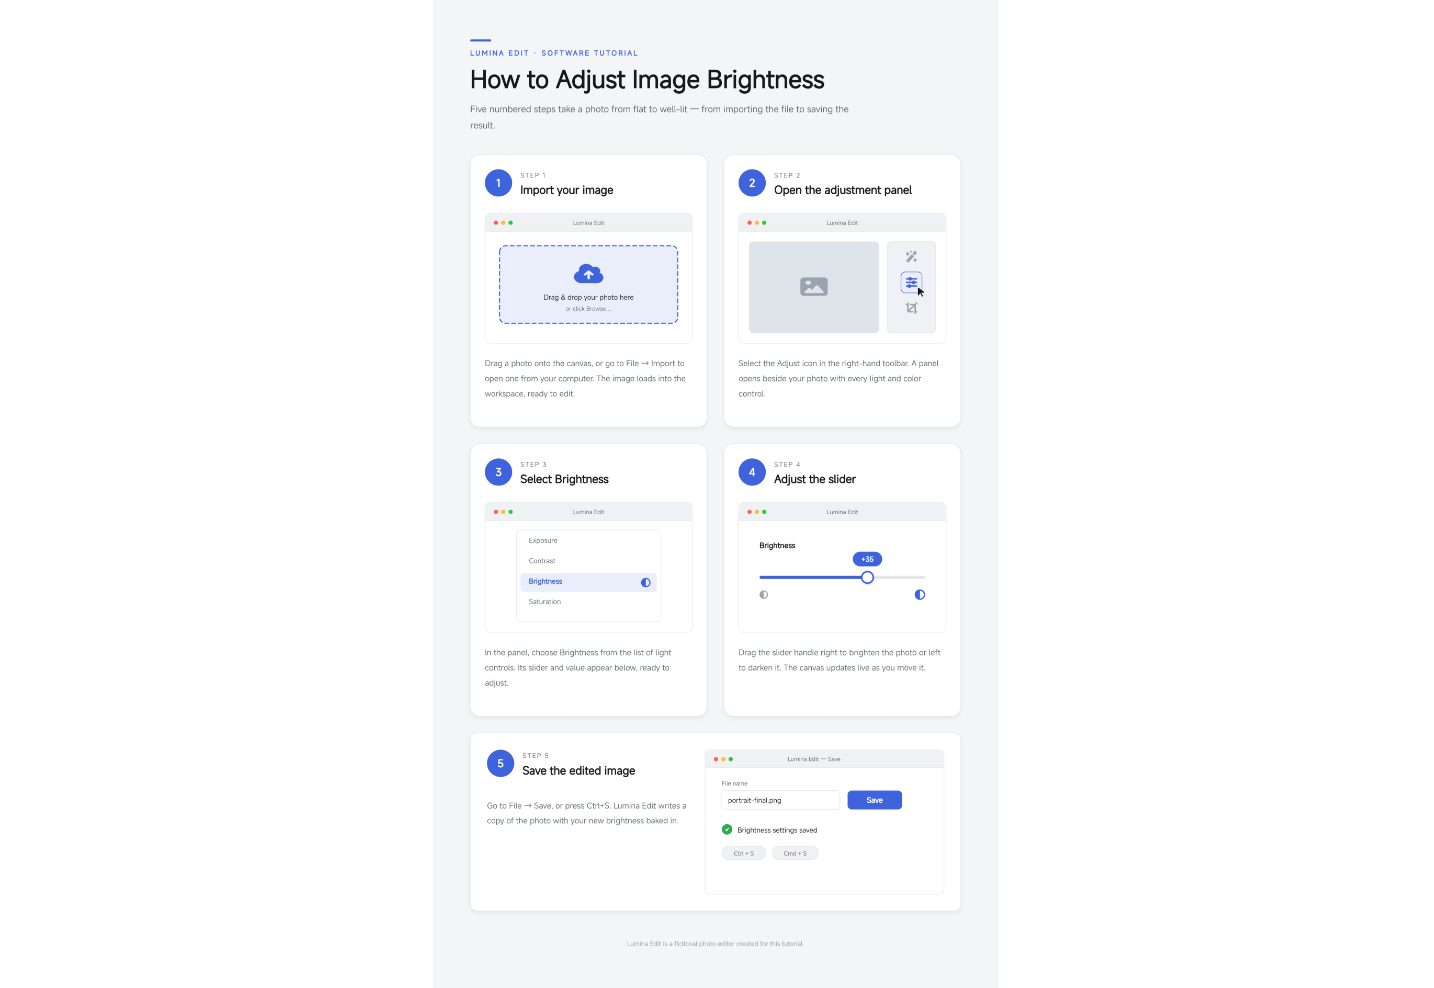
| Instructional guide | Present instructions step by step | Numbered steps, illustrations, labels | Pizza recipe | Step-by-step visual guide |
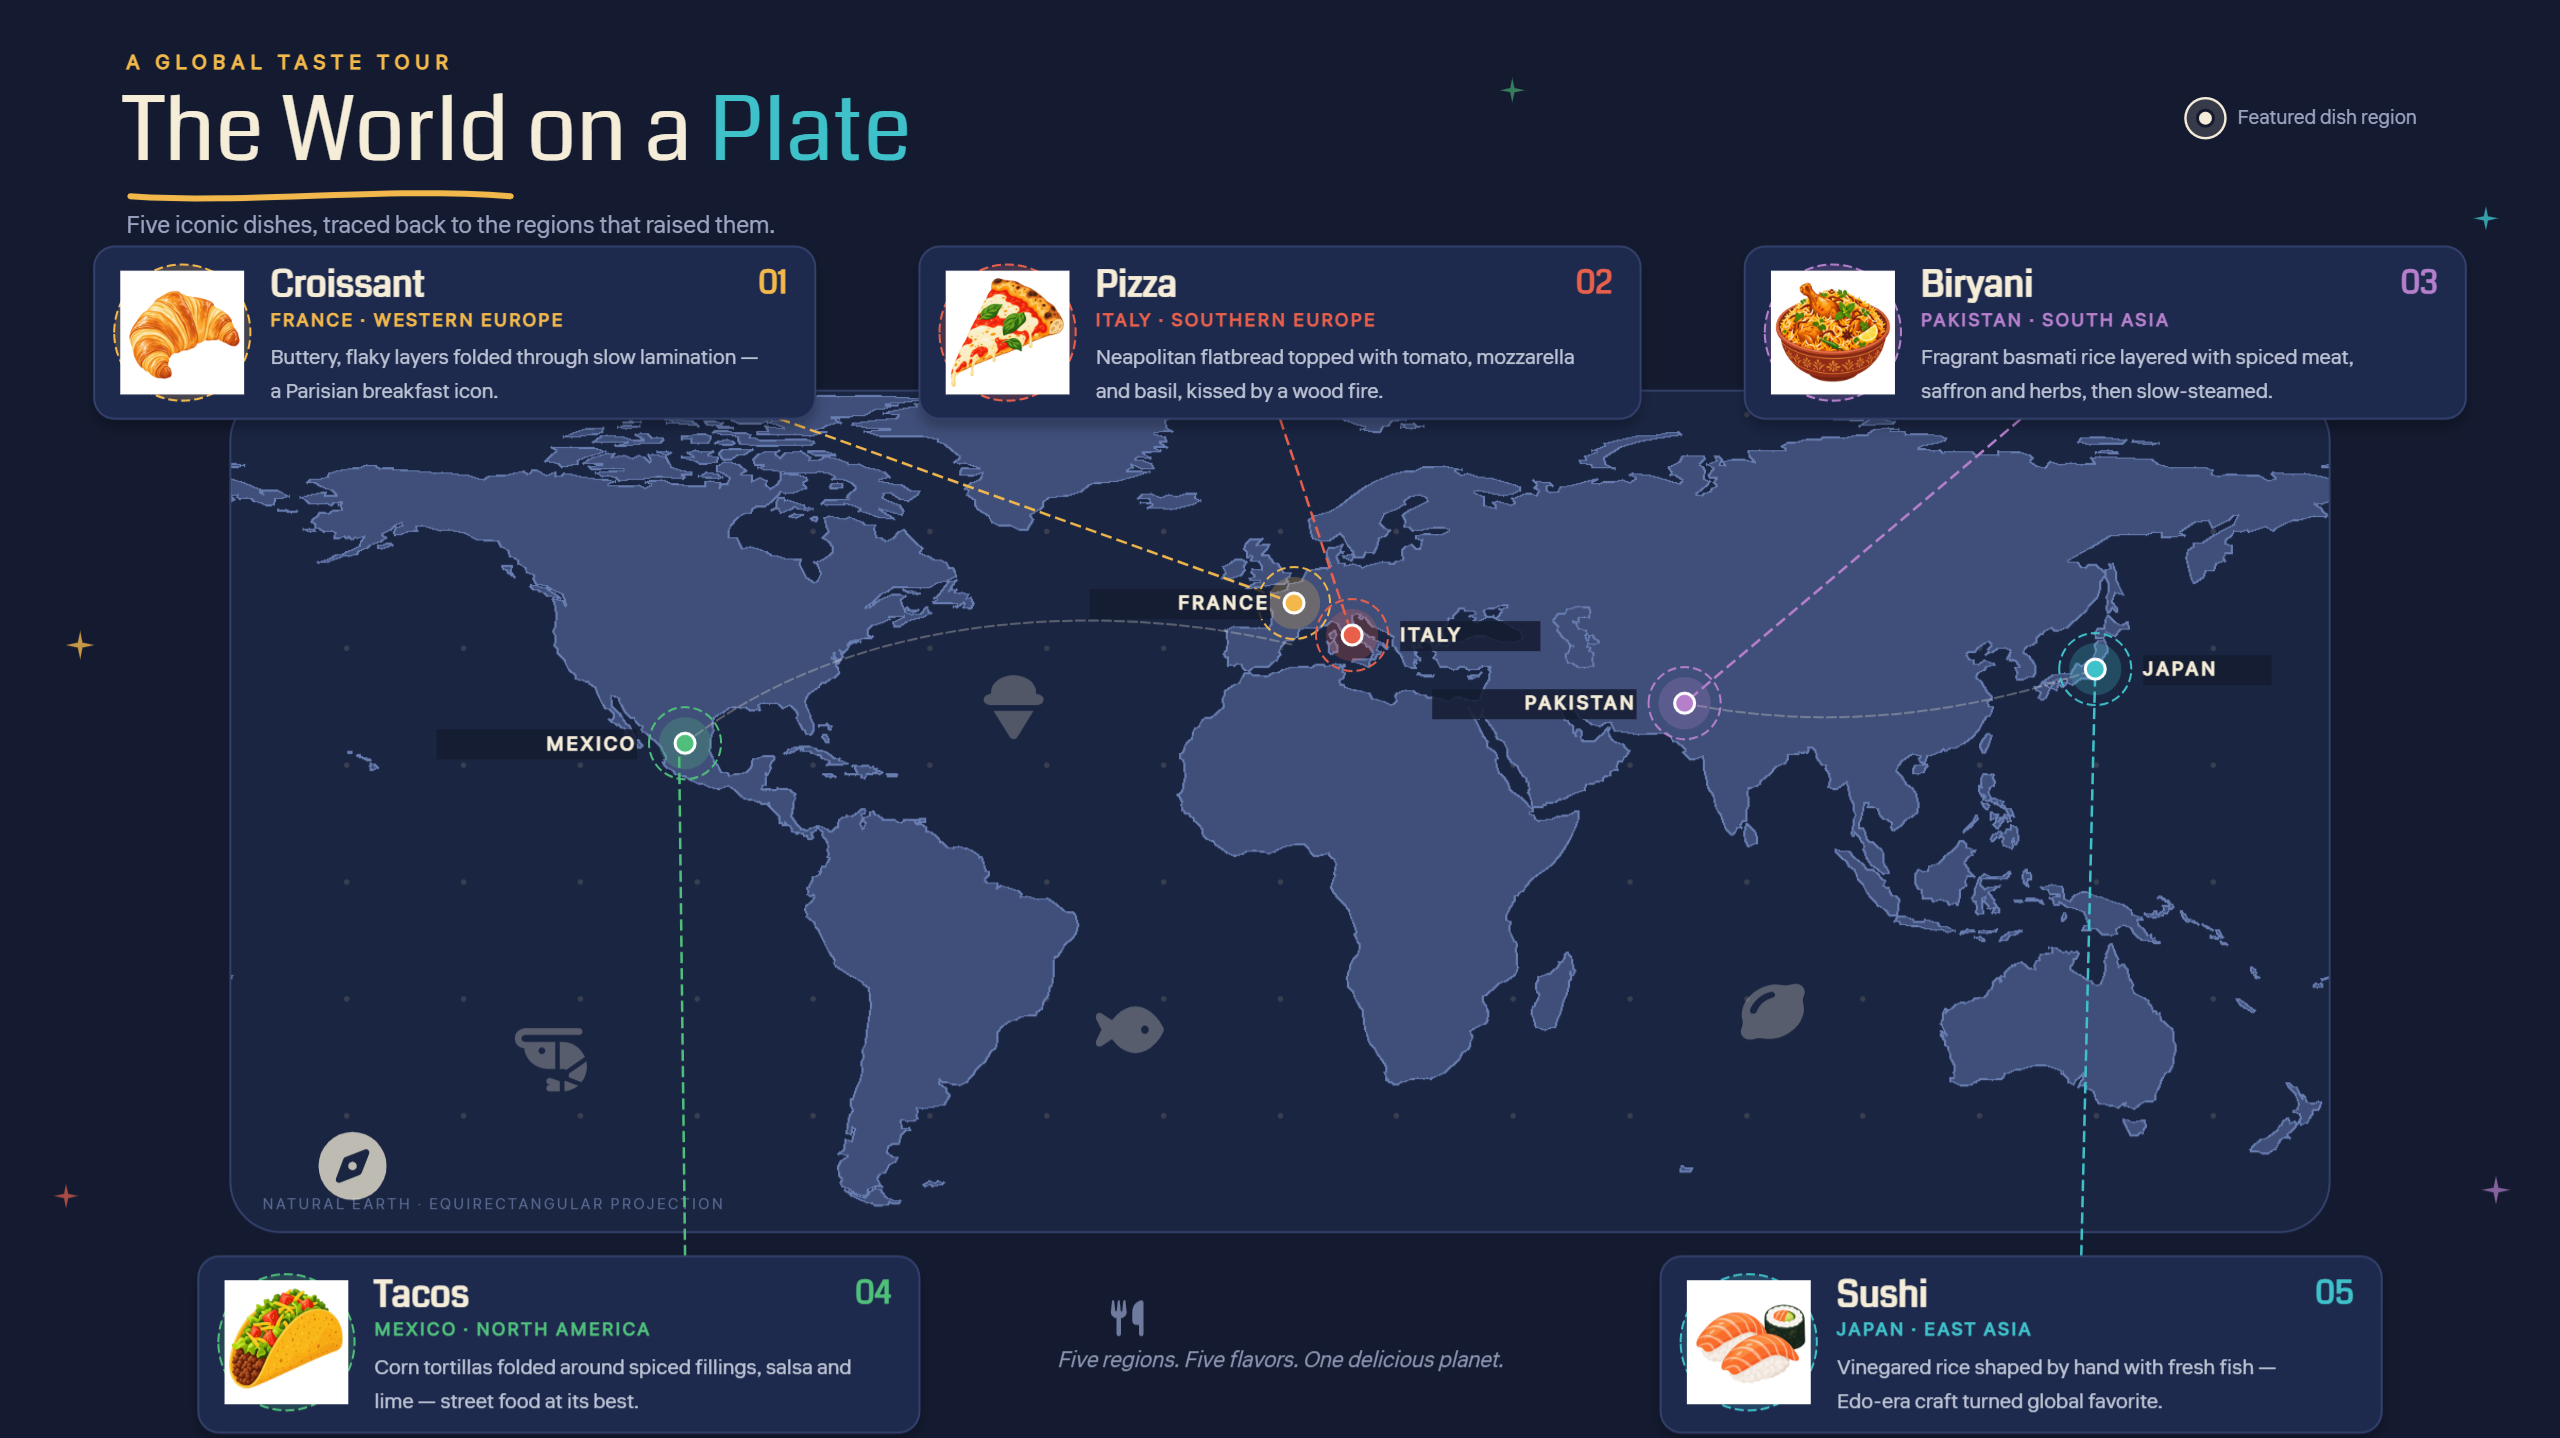
| Map-based infographic | Communicate geographic information | Maps, markers, symbols, labels | Regional food cultures | Geographic data visualization |
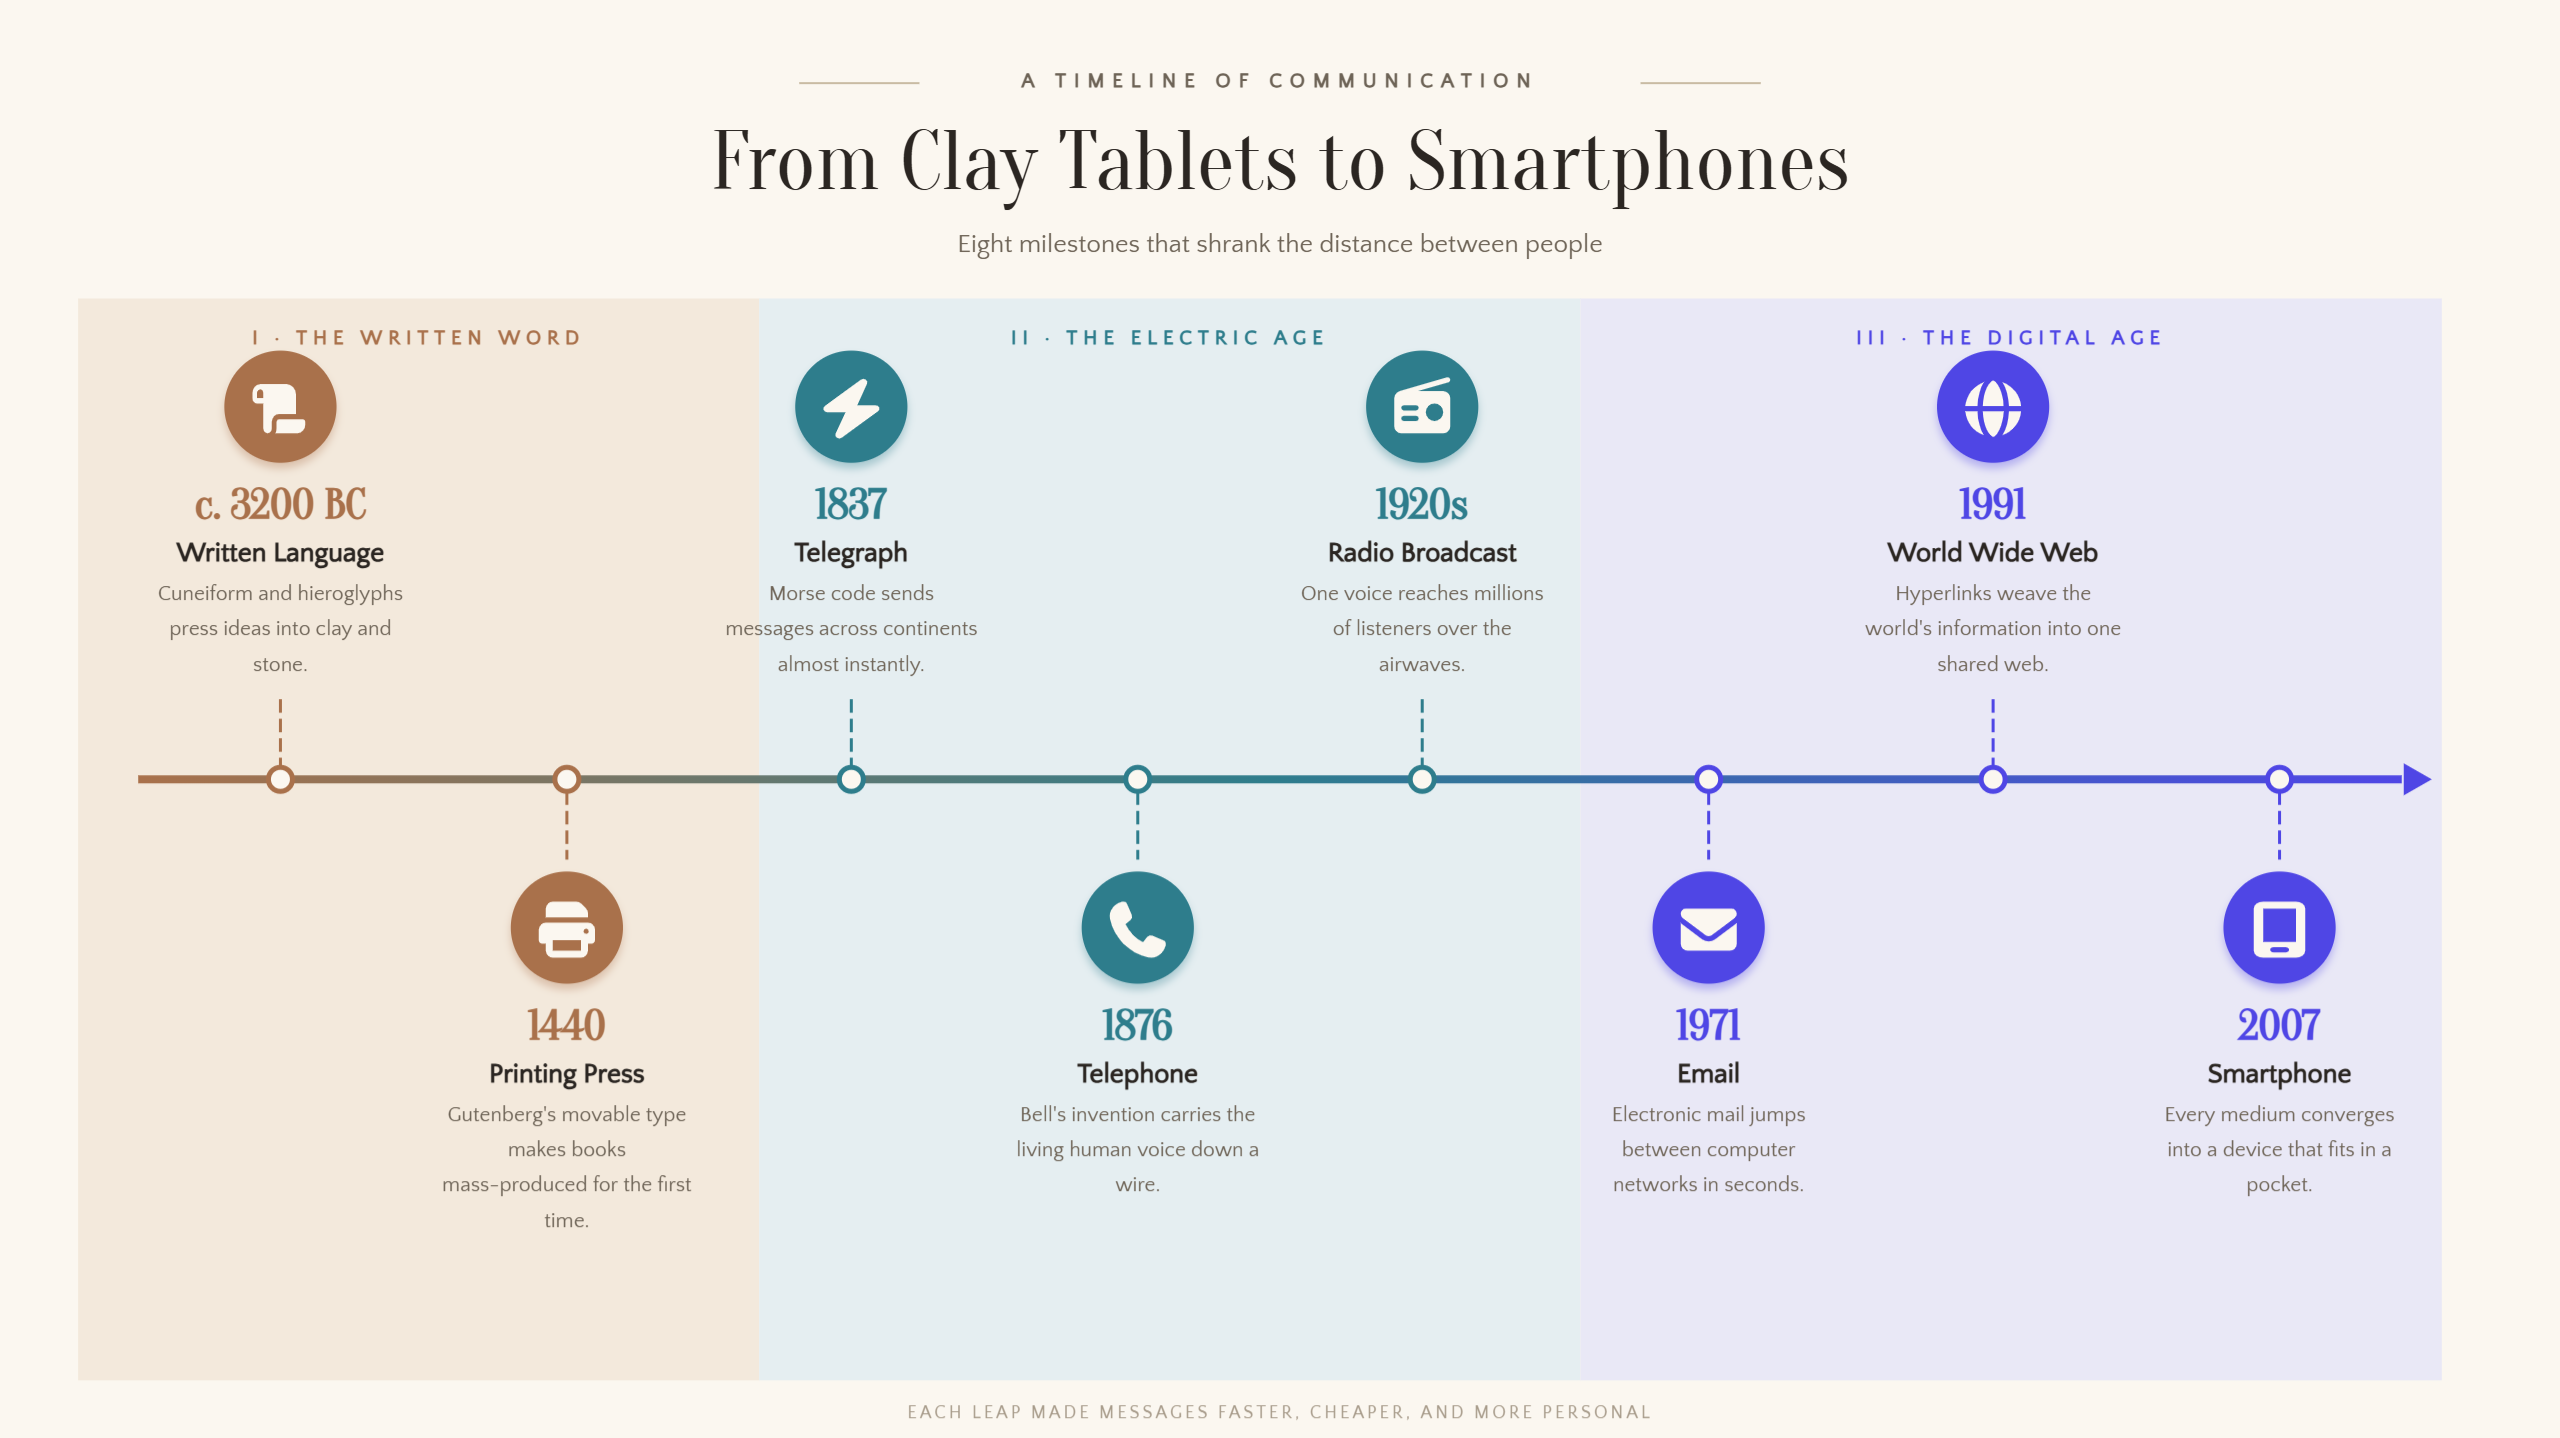
| Timeline infographic | Show events in chronological order | Dates, milestones, connecting lines | Communication technology | Chronological timeline |
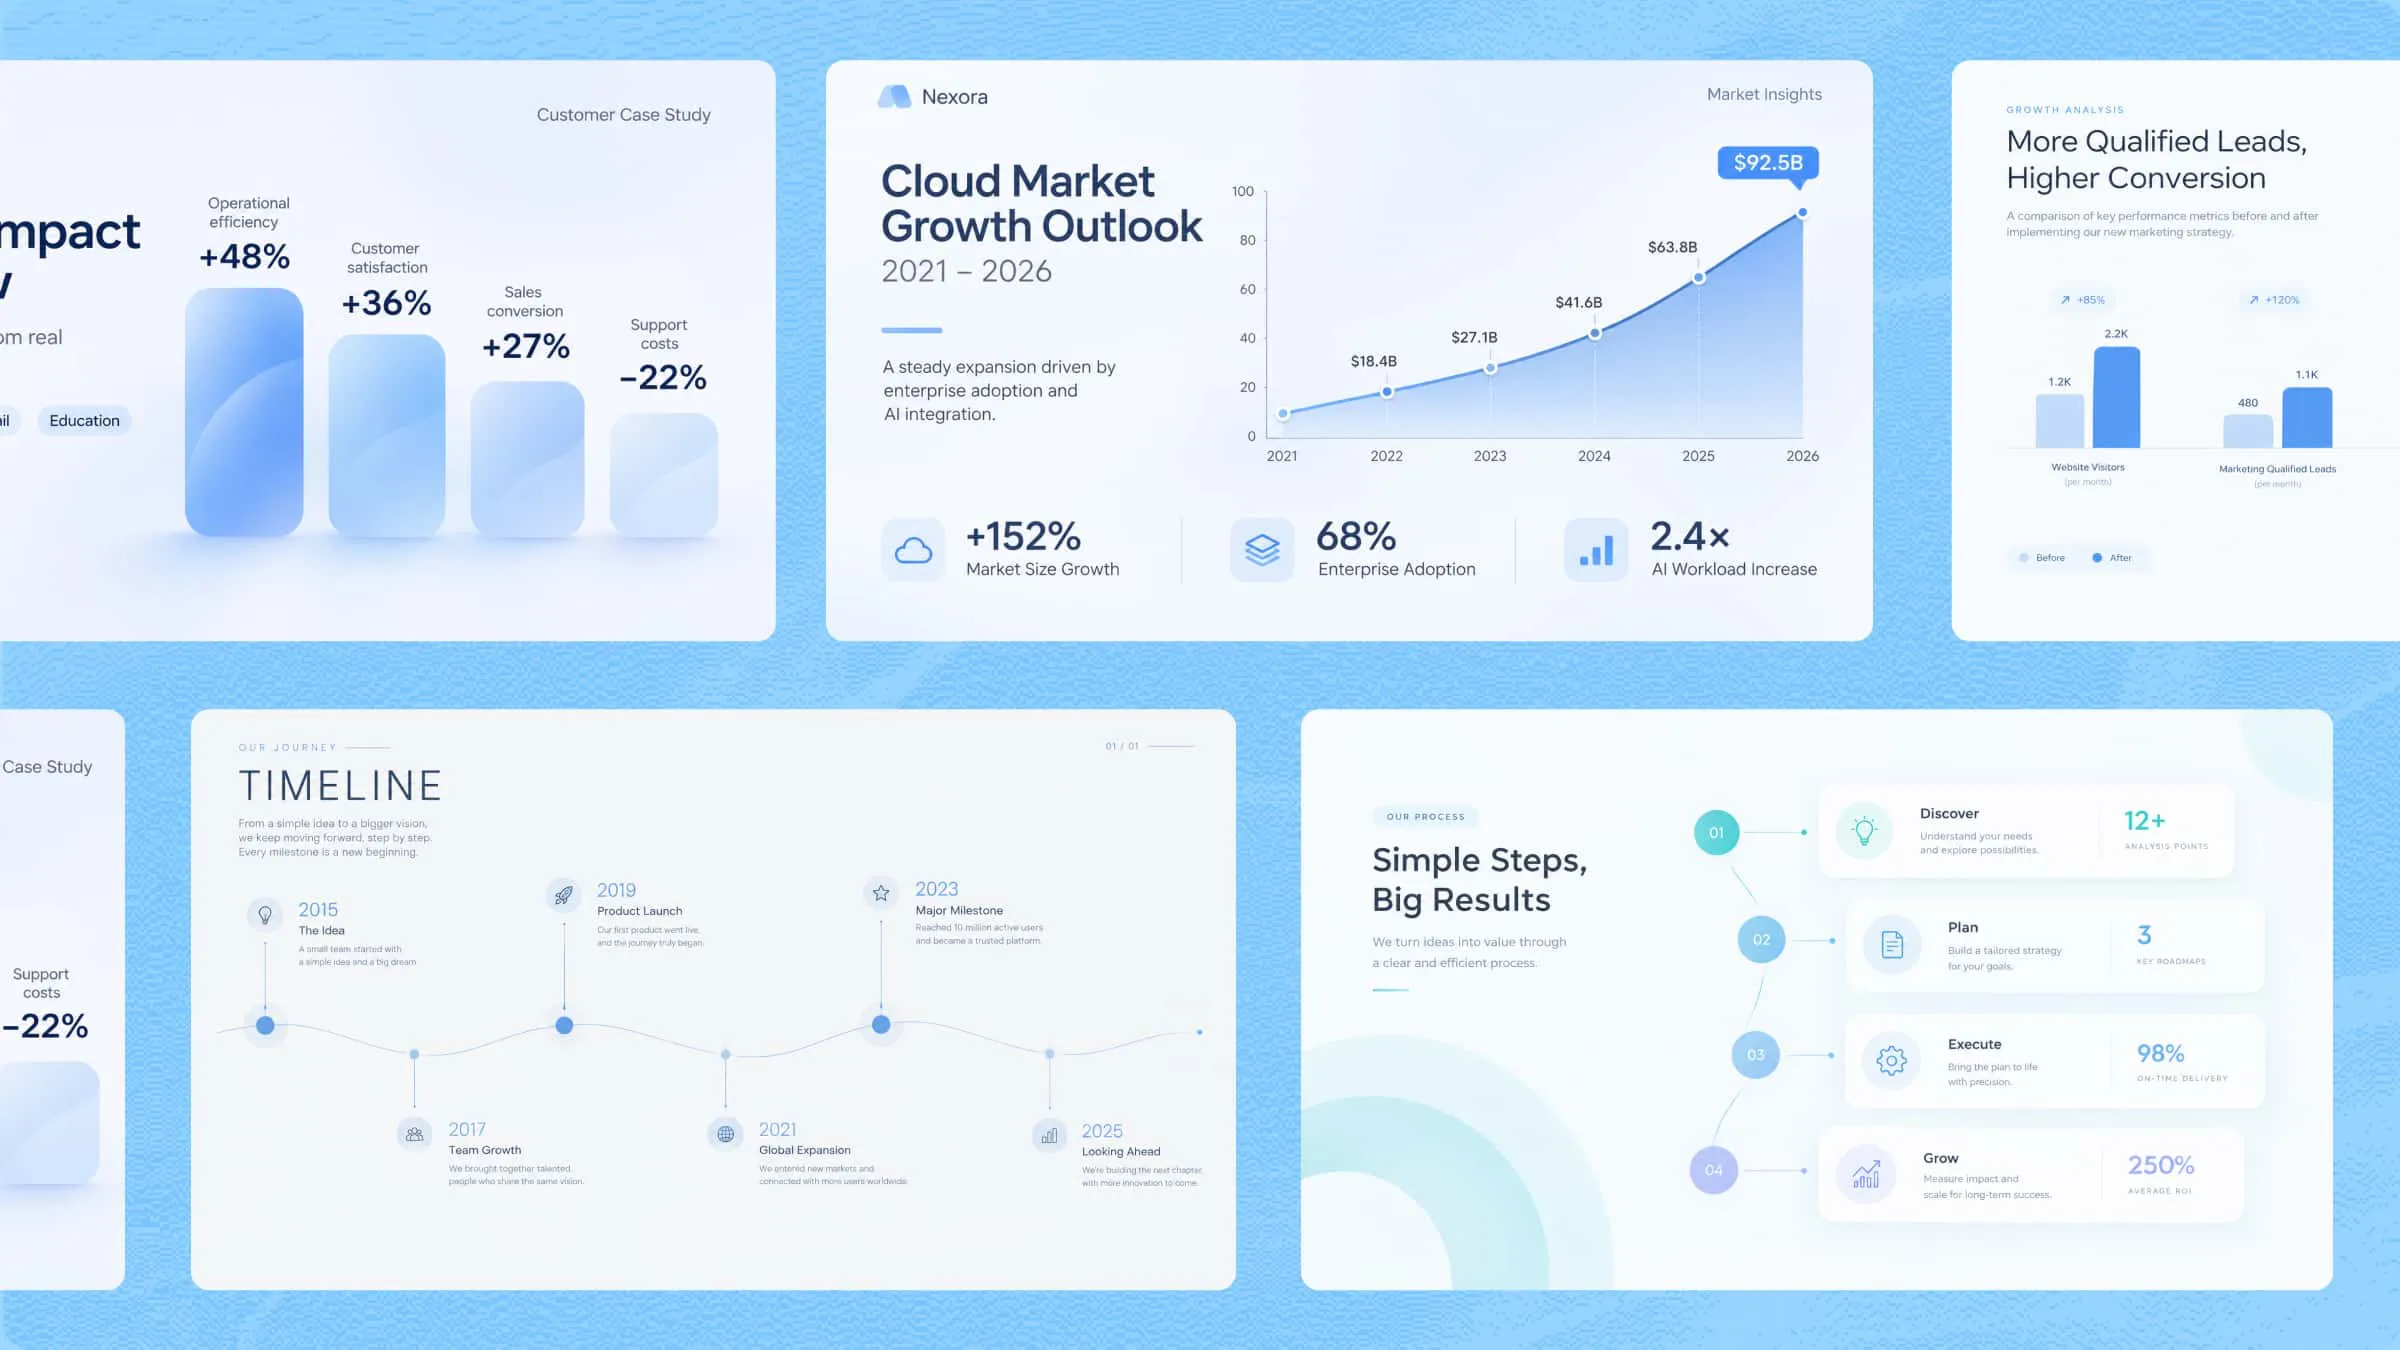
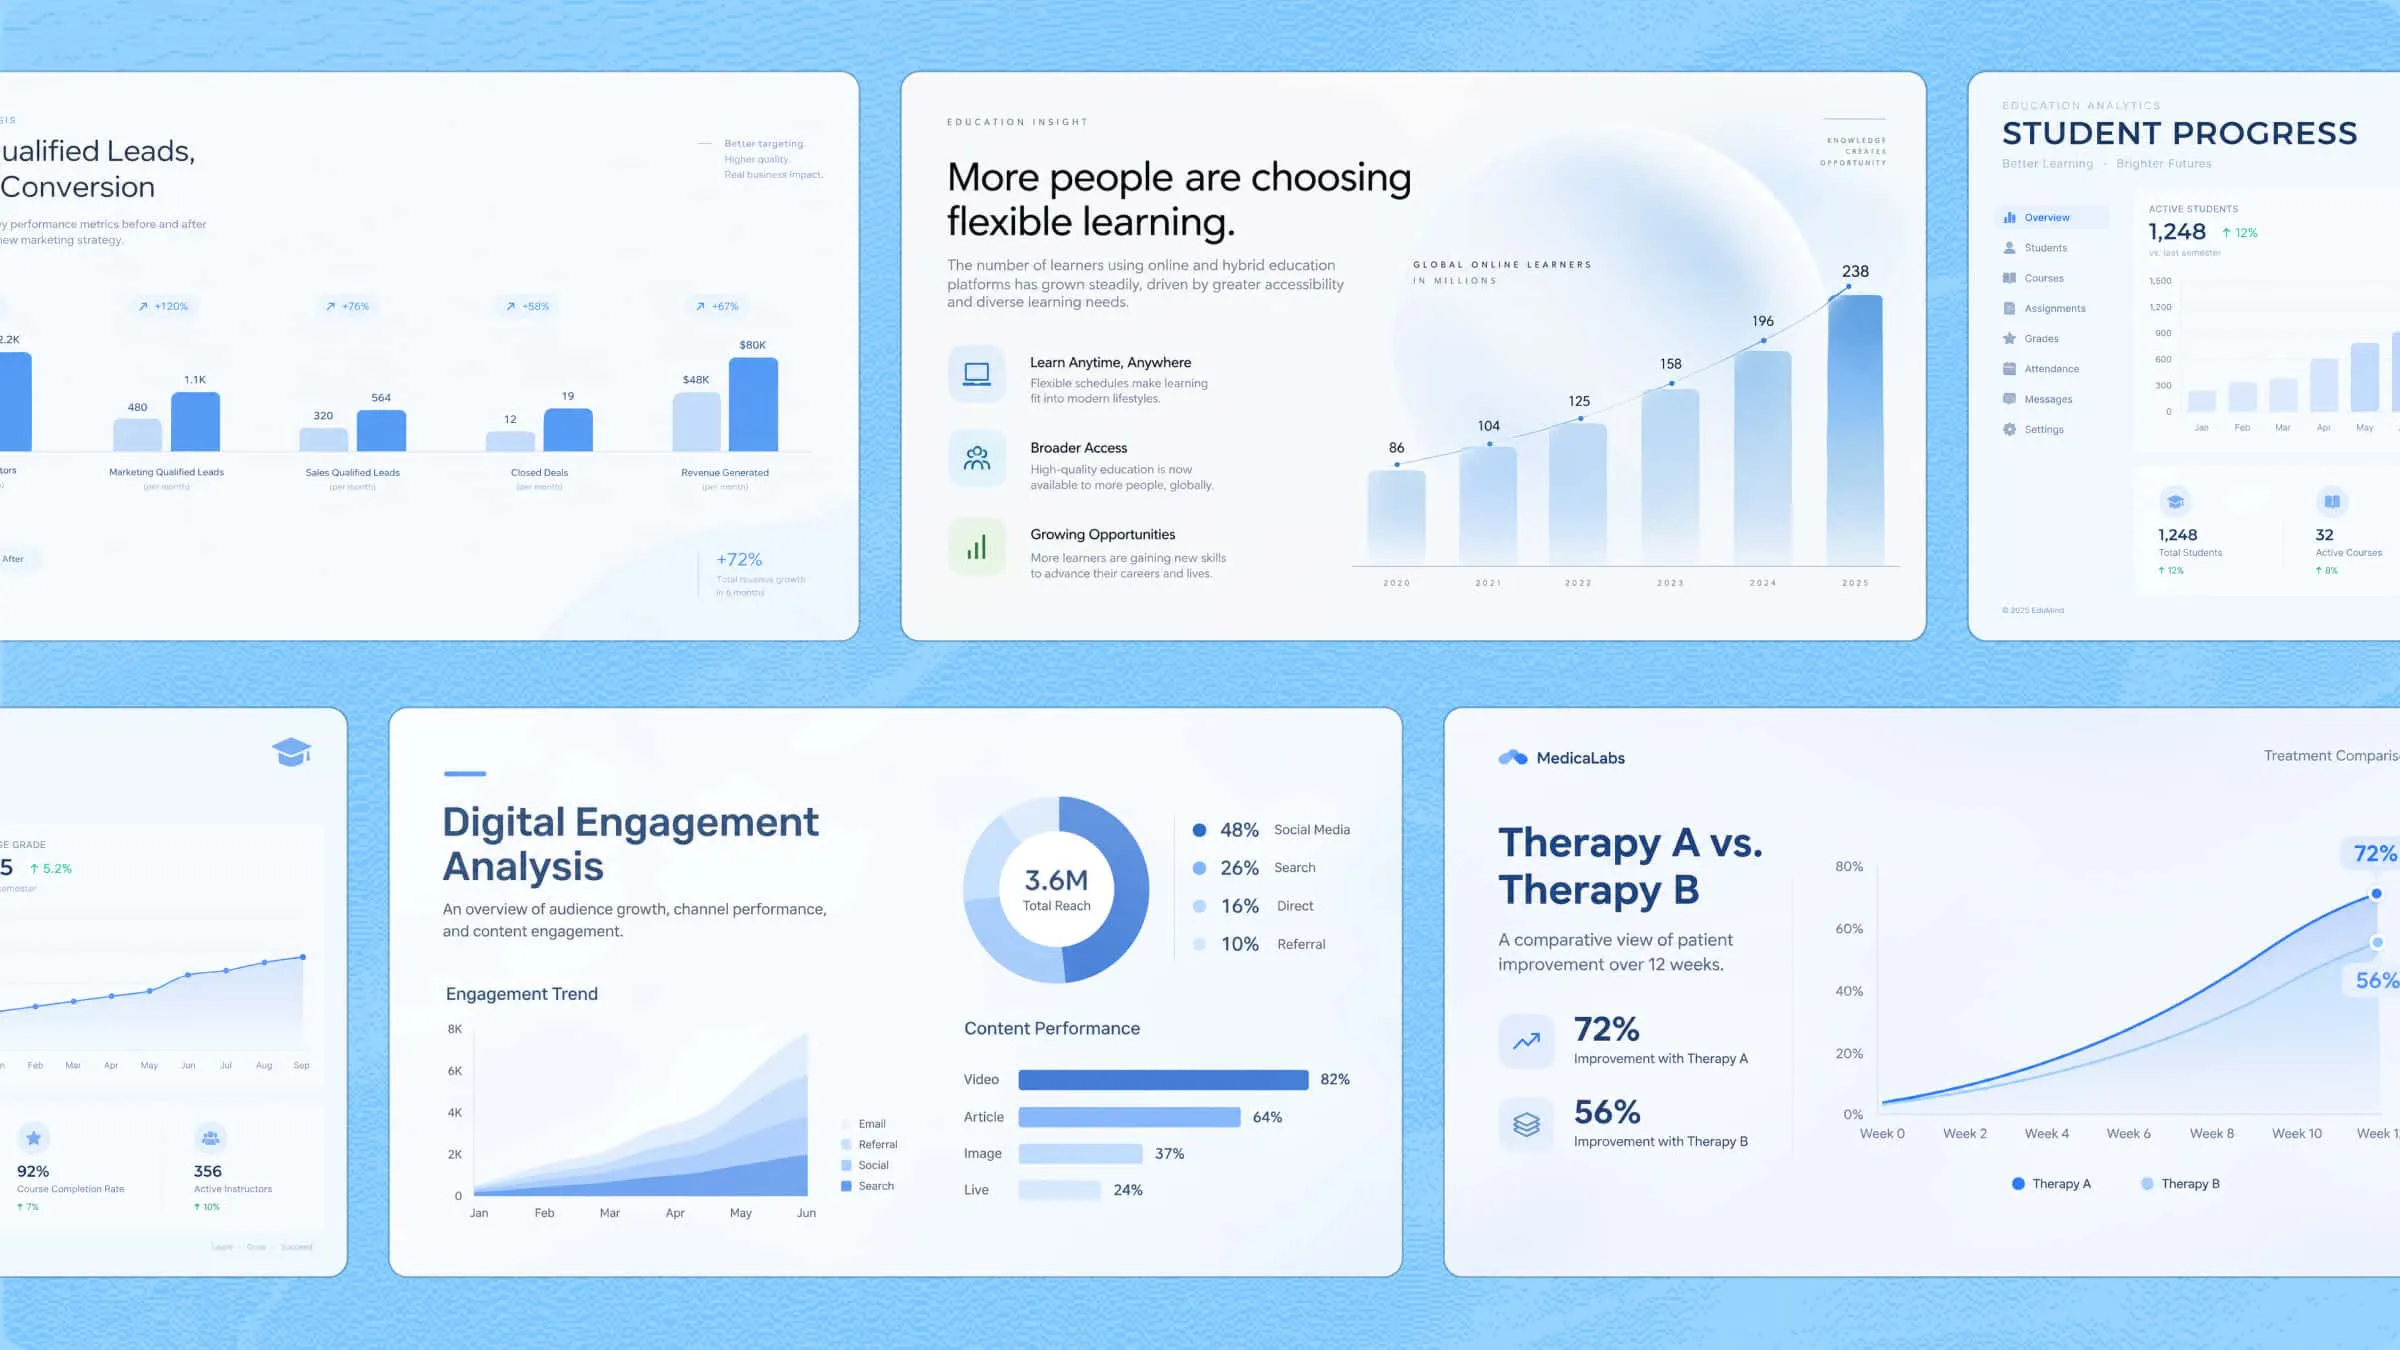
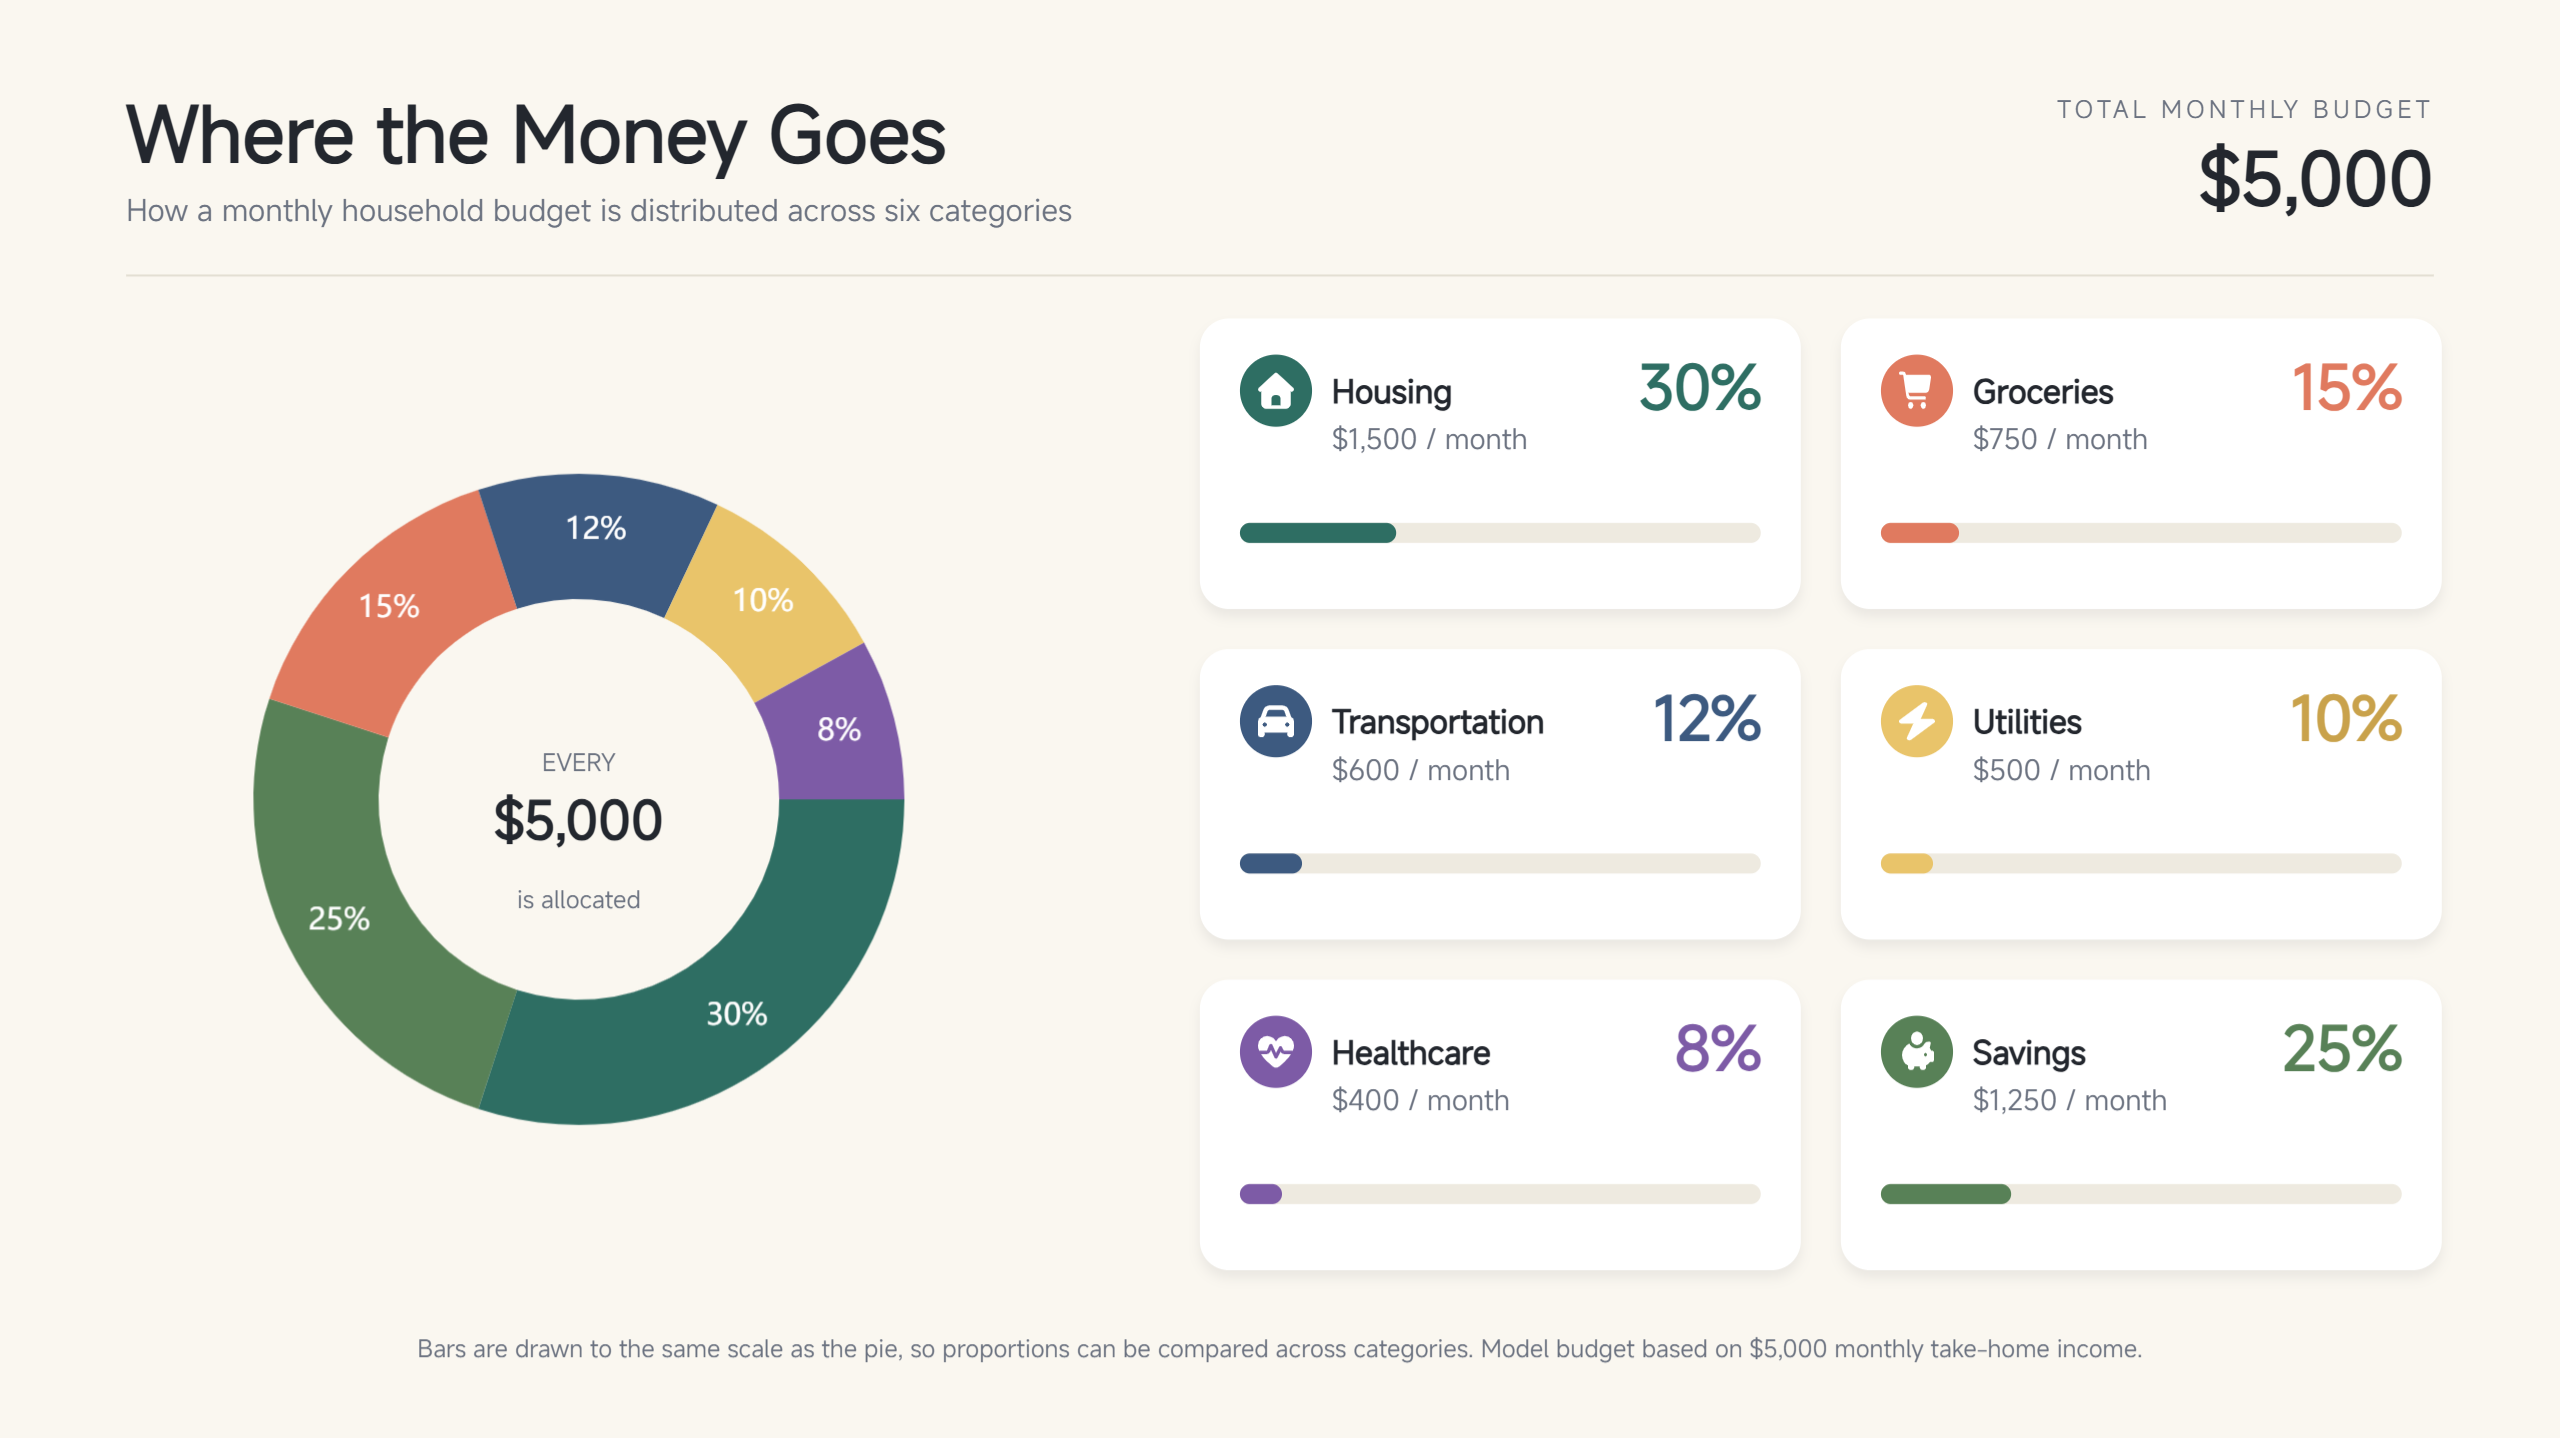
| Percentage infographic | Present proportions and numerical data | Pie charts, progress bars, percentage labels | Household budget | Statistical data visualization |
| Comparison infographic | Highlight similarities and differences | Side-by-side sections, matching categories | Online vs. classroom learning | Comparative visual layout |
| Color-coded infographic | Organize information into distinct groups | Contrasting colors, legends, category labels | Customer survey results | Color-coded category chart |
| Icon-based infographic | Communicate key points efficiently | Recognizable icons, short labels, descriptions | Workplace safety | Icon-led information layout |
| Visual résumé | Summarize professional qualifications | Career timeline, skill indicators, icons | Digital marketing résumé | Structured professional profile |
10 unique infographic ideas to elevate your content
Infographics can make information easier to understand by turning lengthy explanations and abstract concepts into engaging visual content. From step-by-step guides to data-rich illustrations, different formats serve different communication goals.
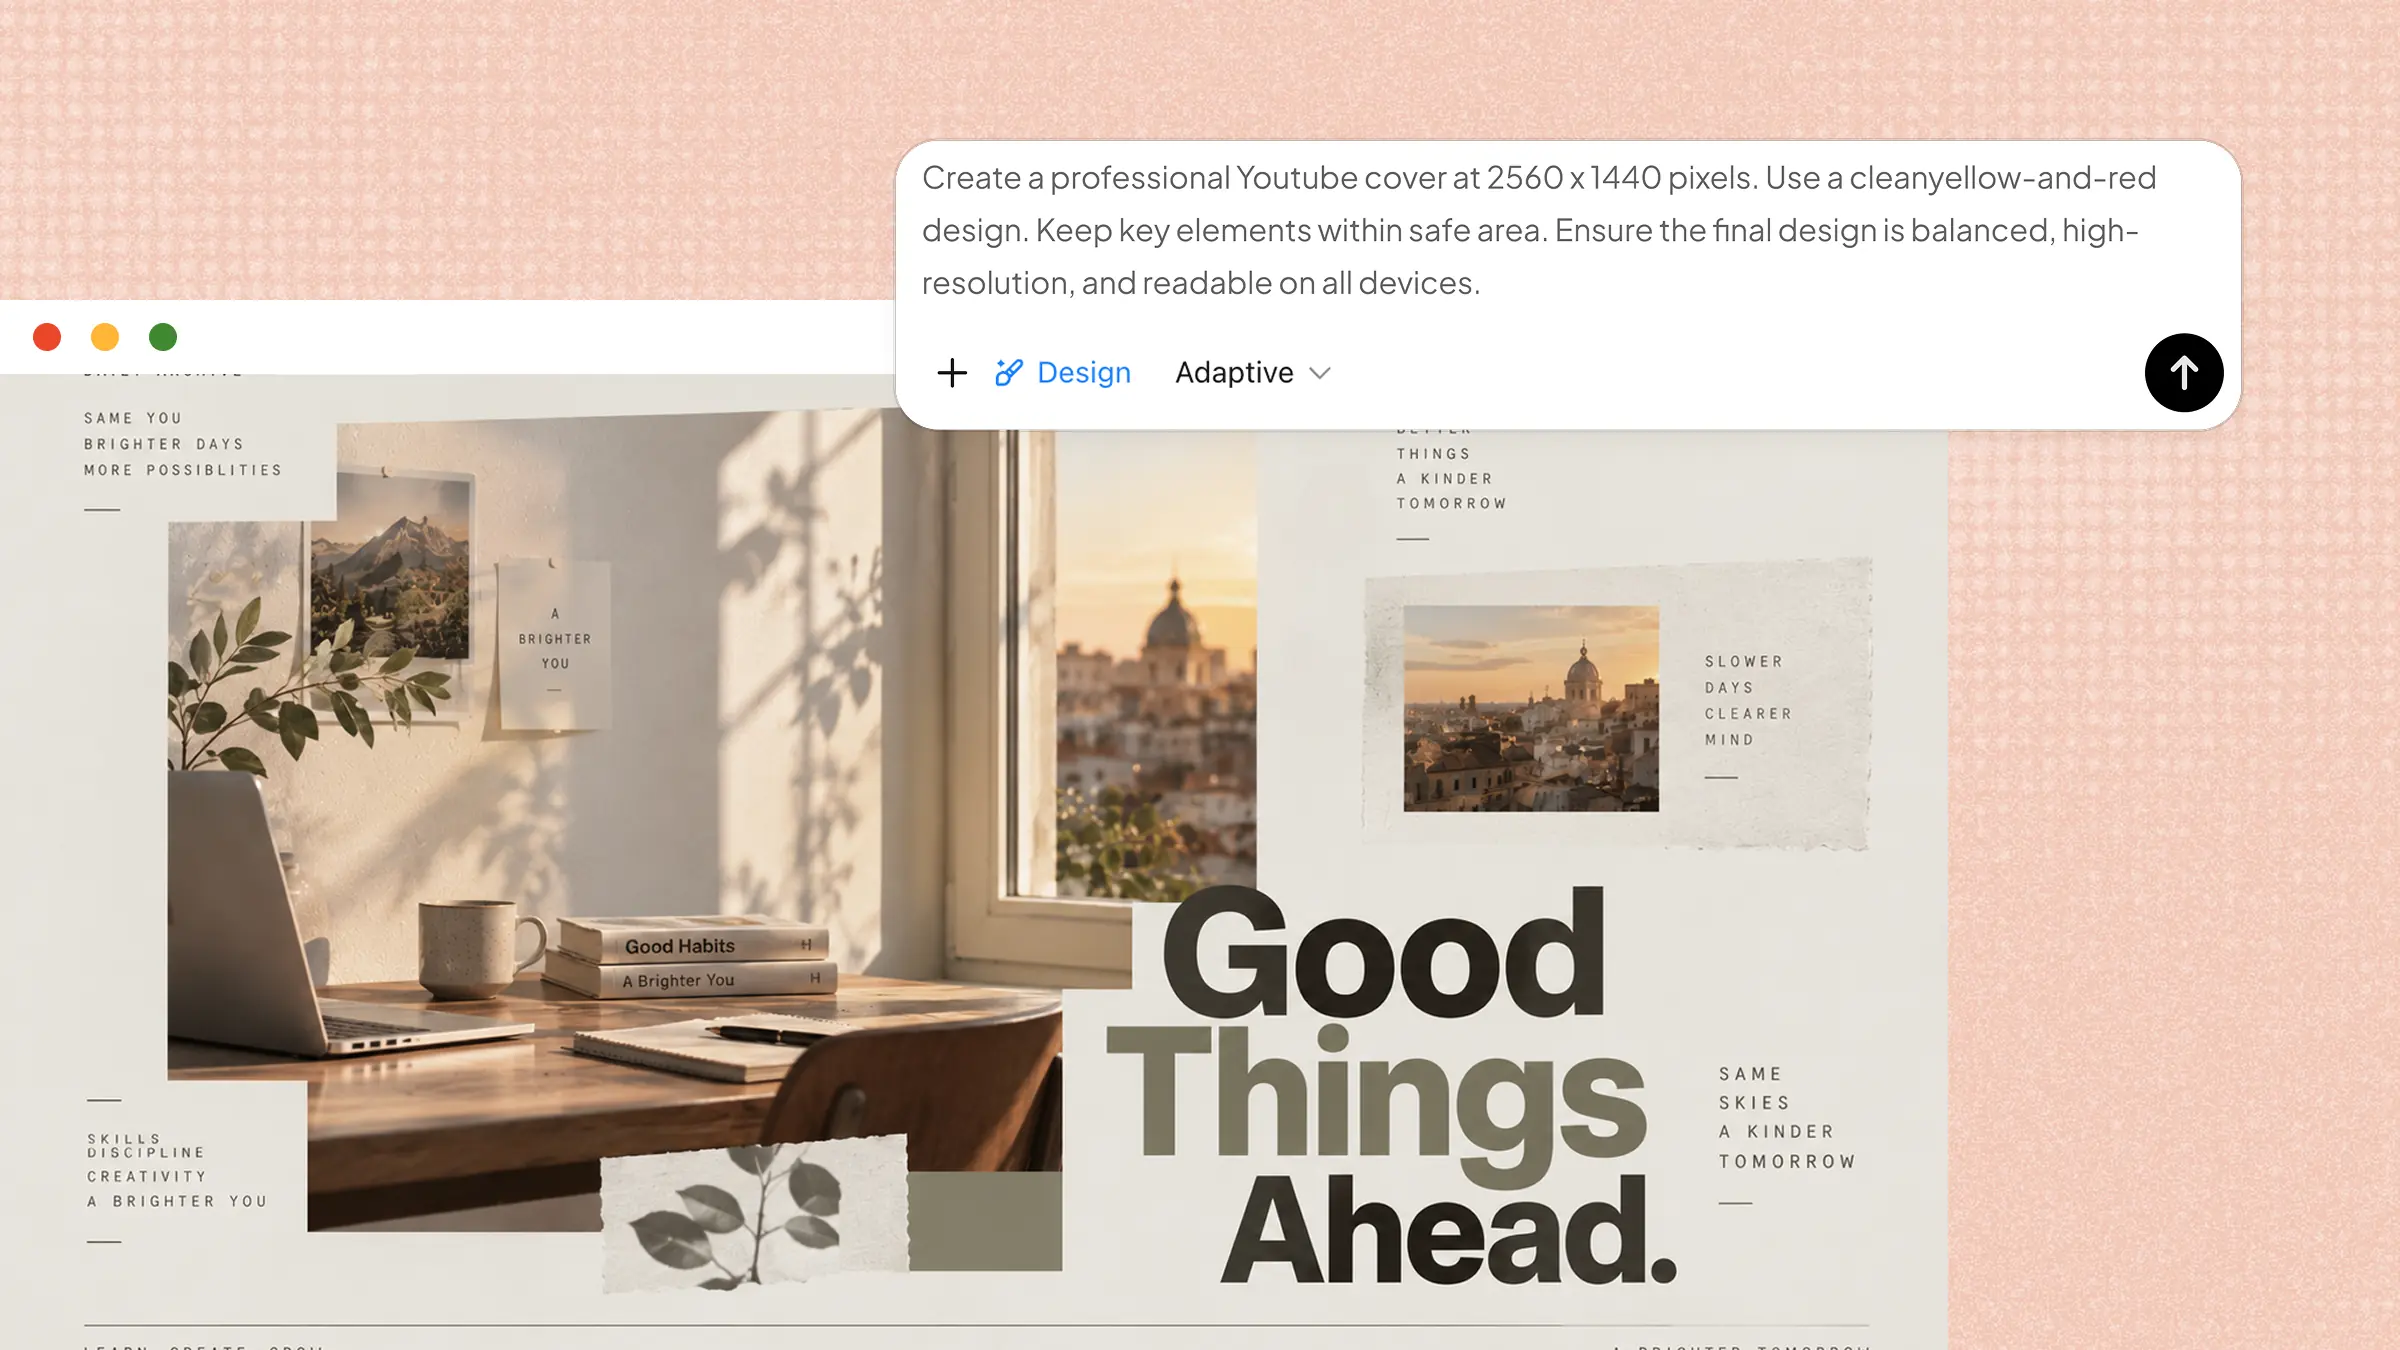
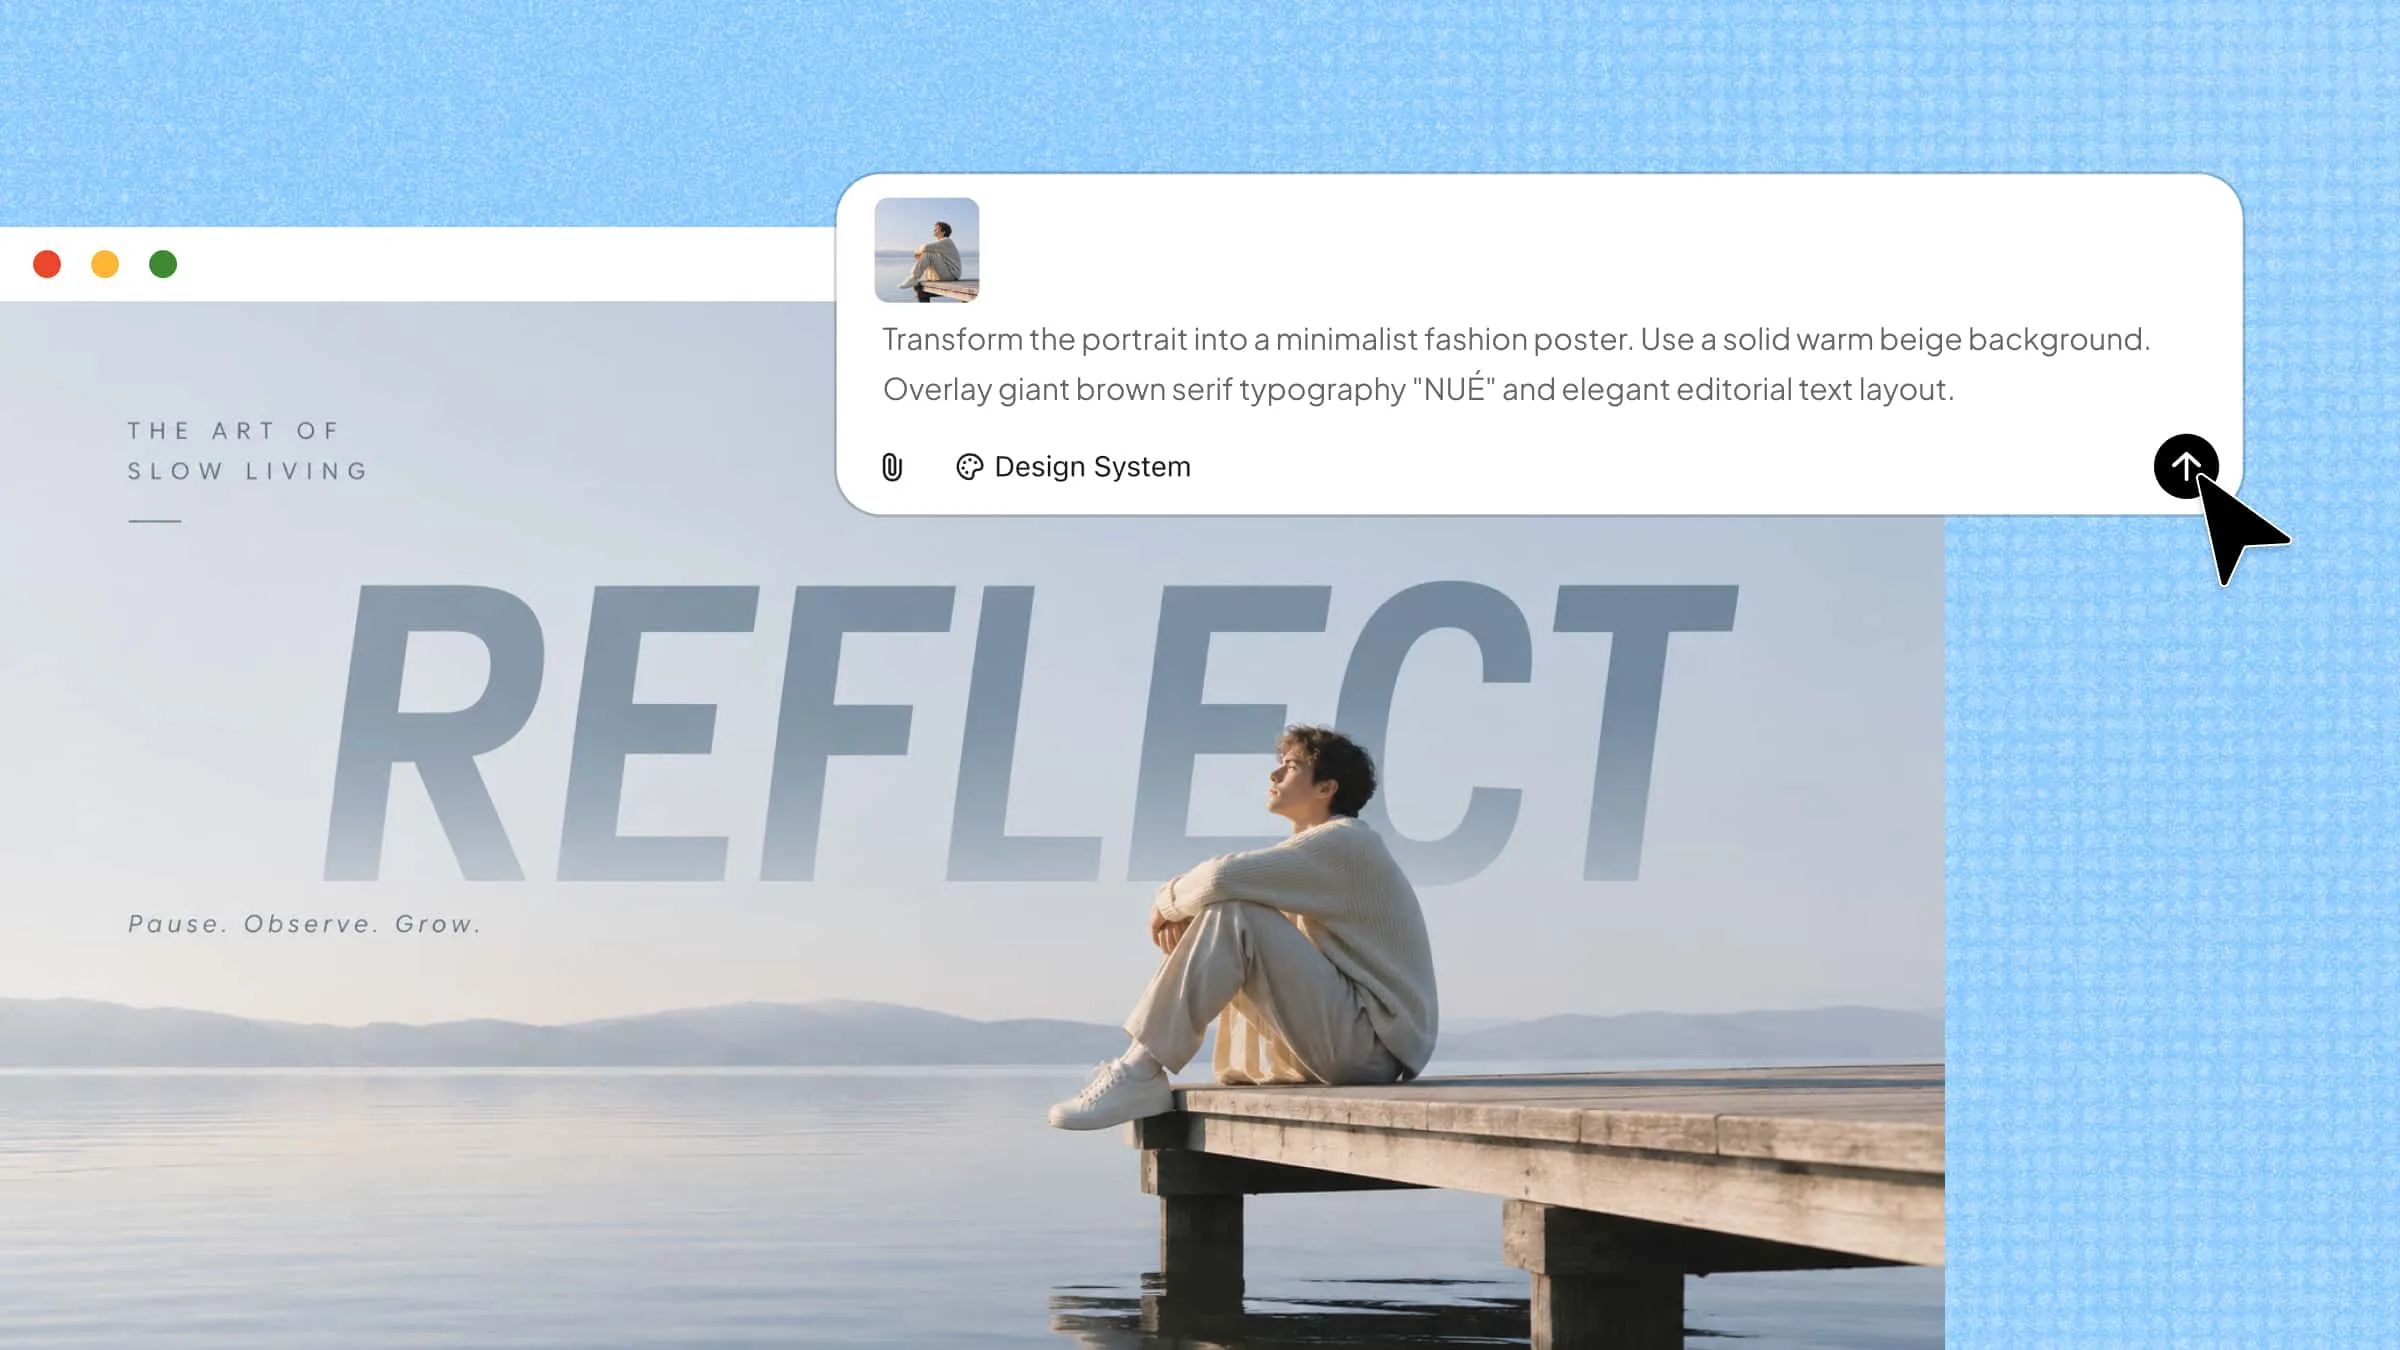
Kimi Design is an AI design generator that turns text content into visual materials, including infographics, diagrams, and educational graphics. Simply enter a prompt describing your topic and design requirements, and Kimi Design will generate an initial design. You can then refine it through chat instructions or manual editing before exporting the finished work. Here are 10 infographic ideas to inspire your next project.
Show how a process works
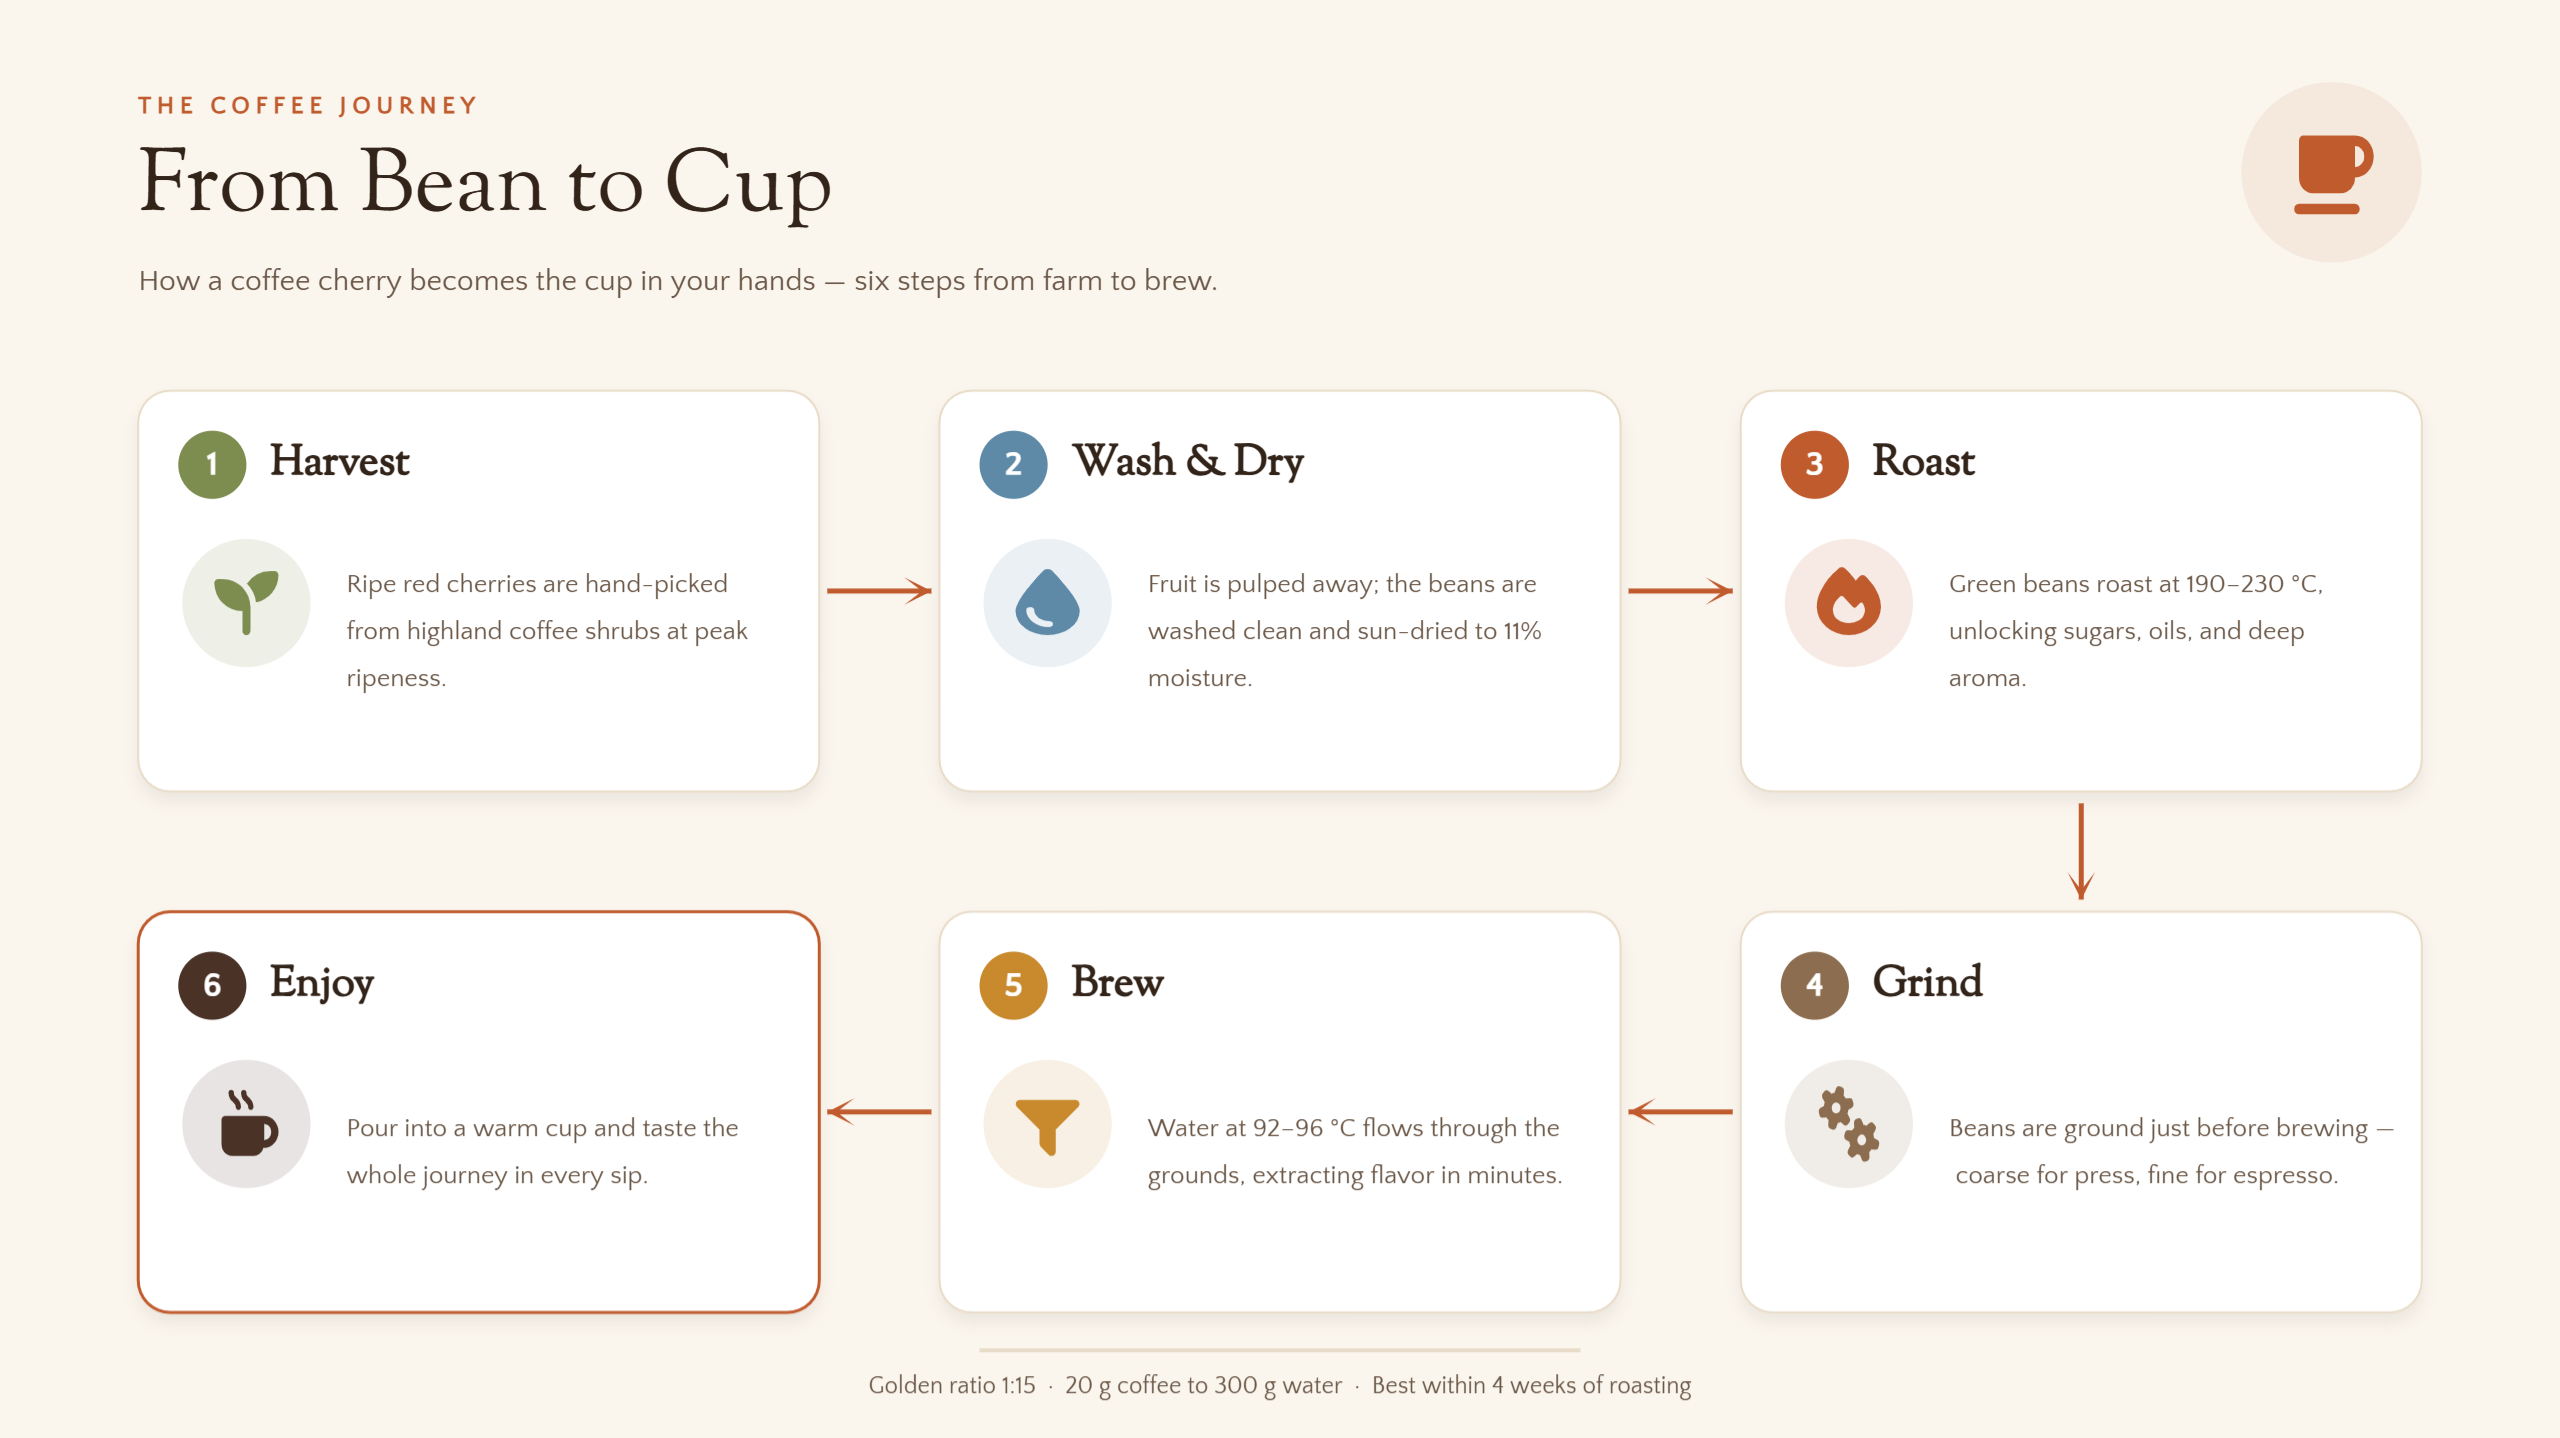
When you need to explain a sequence of activities, a process infographic makes each stage easier to follow. Arrange the steps in their correct order using arrows, icons, and brief descriptions to establish a clear visual flow. For example, you could illustrate coffee production, from harvesting beans to brewing the final cup. It helps readers understand how individual actions connect to produce an outcome.
Example Prompt
Break down a complex subject into smaller parts
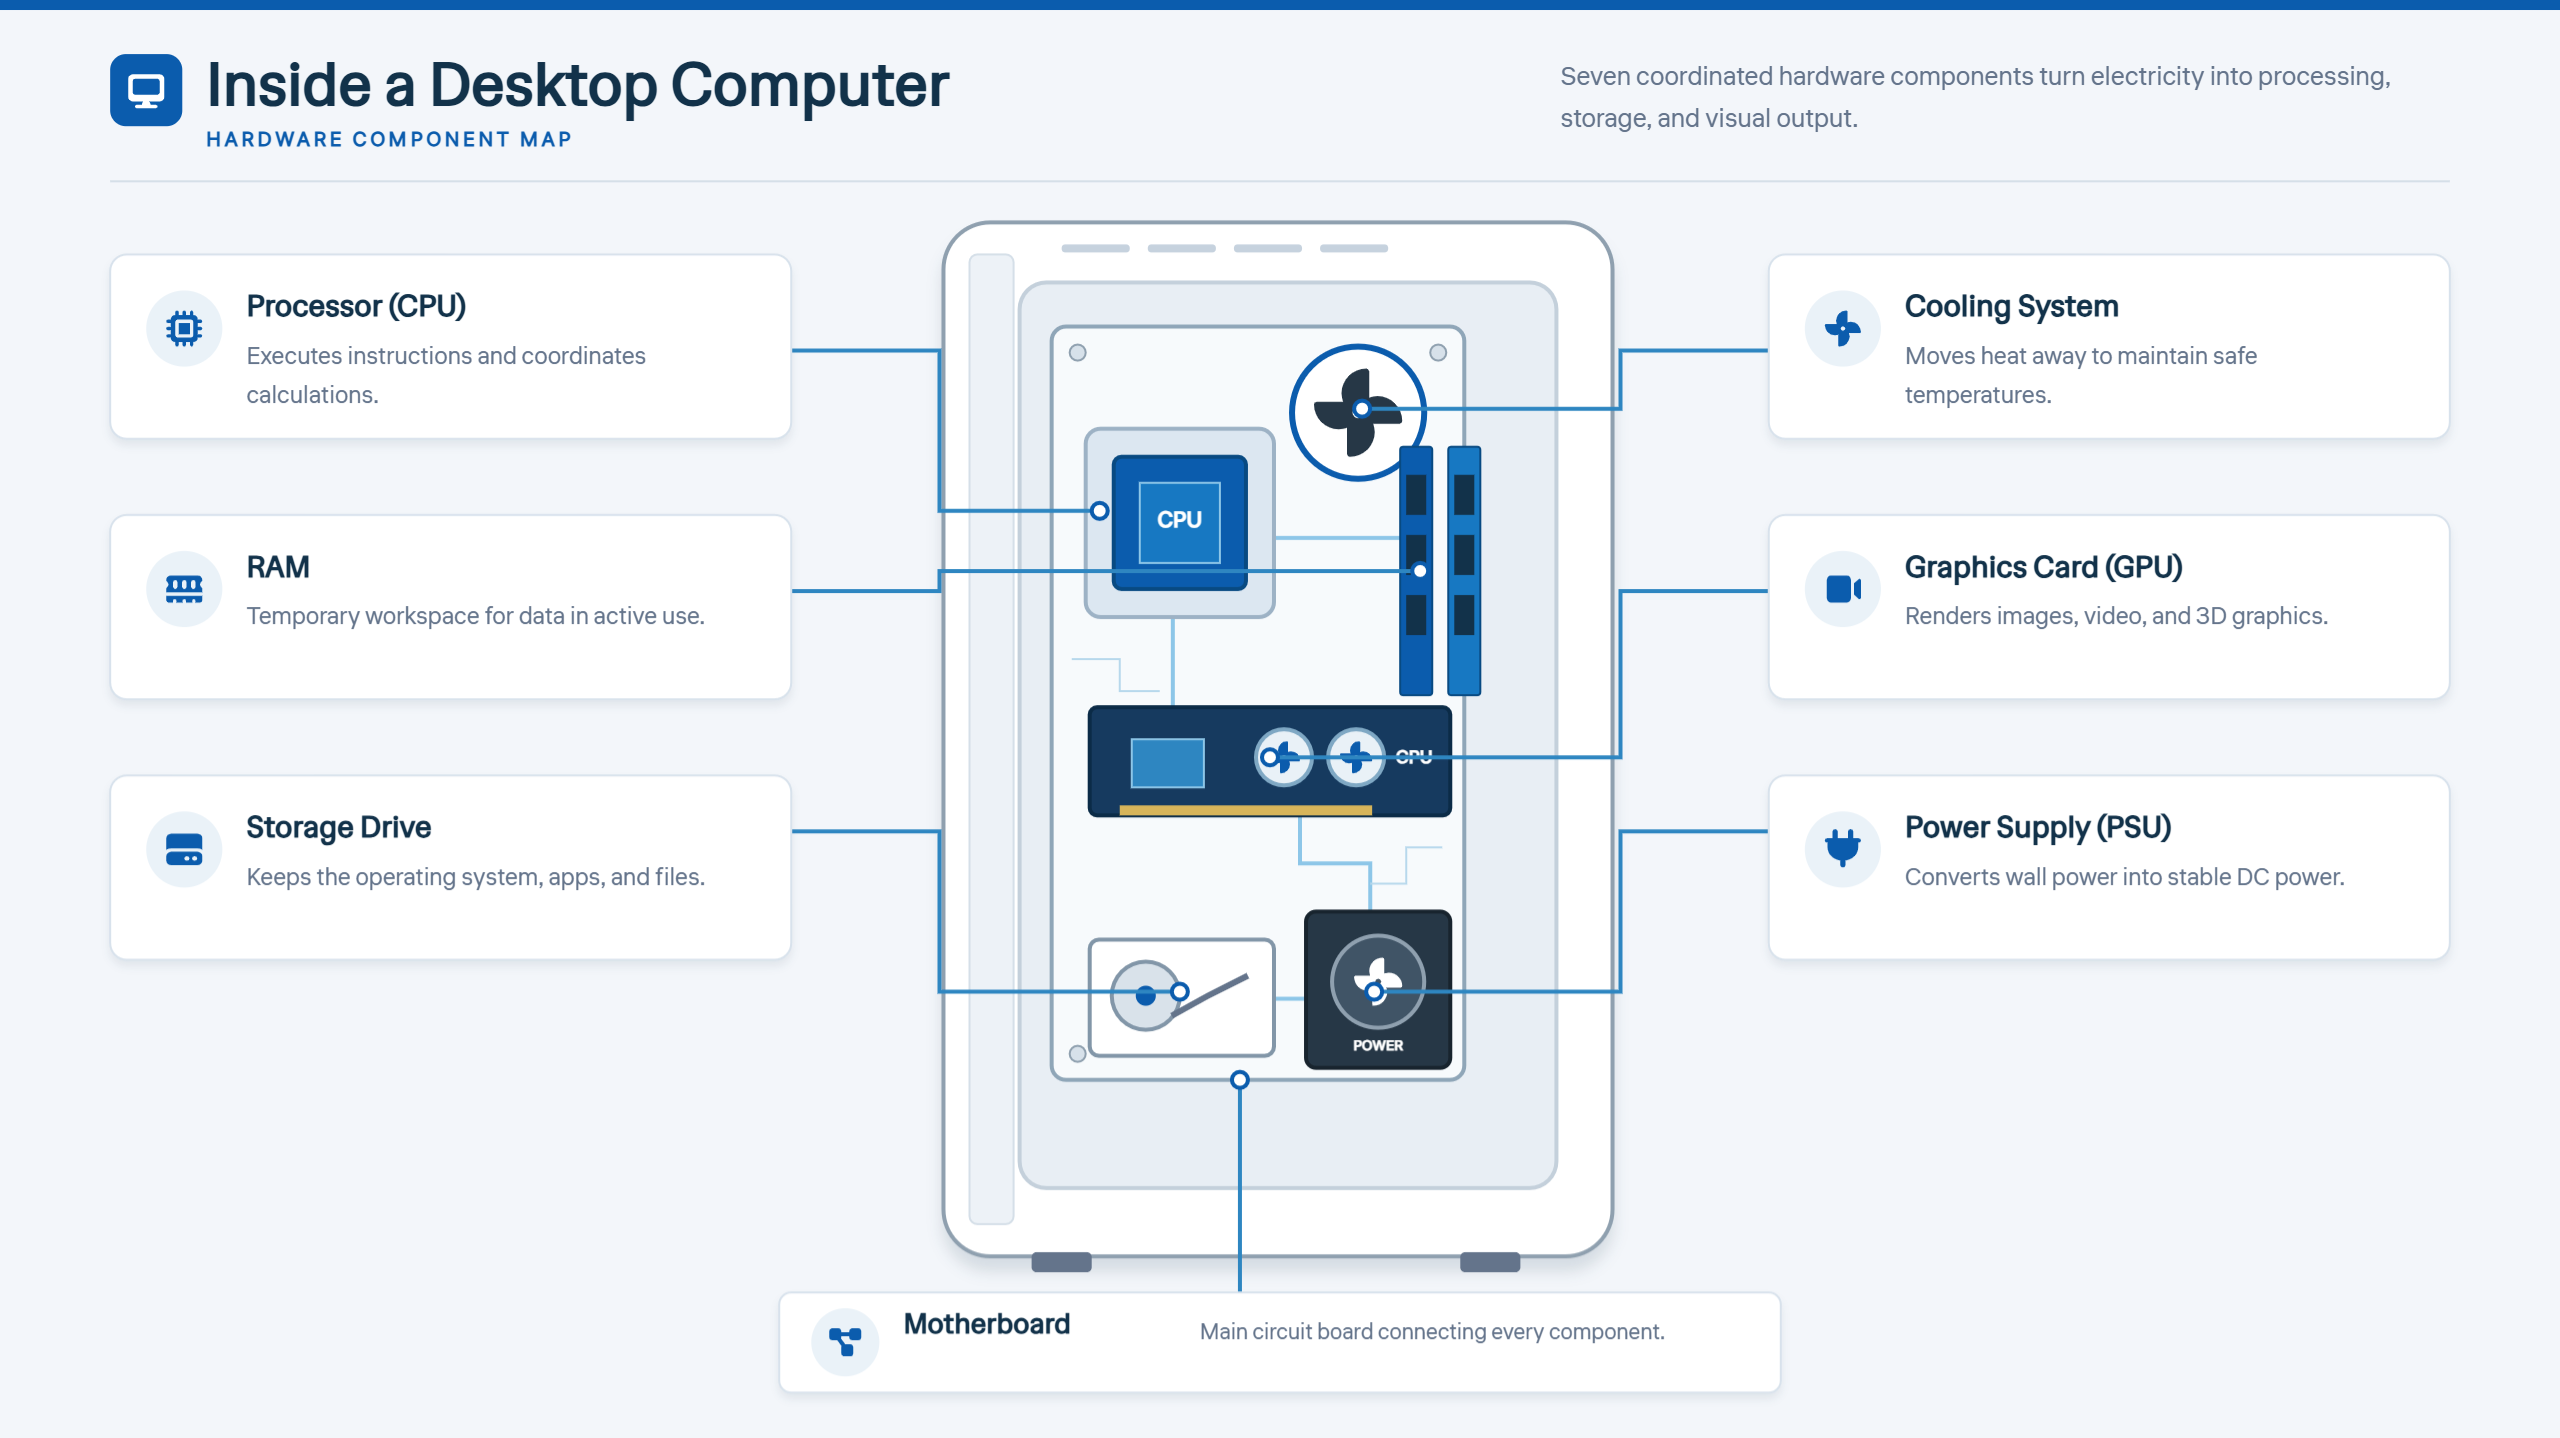
Some topics become difficult to understand because they involve multiple components or interconnected concepts. A breakdown infographic separates the subject into smaller sections, using labels, diagrams, and supporting visuals to explain each element. You could use this format to present computer hardware, the layers of Earth's atmosphere, or the components of a marketing strategy.
Example Prompt
Turn instructions into a visual guide
A visual instruction infographic presents a task as a series of manageable steps, allowing readers to follow along without navigating lengthy explanations. Number each stage and pair it with relevant illustrations, icons, or short descriptions to clarify what needs to be done. This approach works well for recipes, DIY projects, and software tutorials.
Example Prompt
Use maps to explain geographic information
A map-based infographic helps communicate information connected to particular places, regions, or countries. Add location markers, color-coded areas, labels, and concise descriptions to highlight geographic patterns or differences. For instance, you could compare regional food traditions, identify popular travel destinations, or display renewable energy production across countries. This infographic design idea gives readers a spatial perspective that ordinary text may struggle to convey.
Example Prompt
Tell a story through a timeline
A timeline infographic organizes important events, dates, and milestones in chronological order, helping readers understand how something develops over time. Use a horizontal or vertical sequence with clear markers, short explanations, and relevant images to distinguish each milestone. You could illustrate the evolution of technology, a company's growth, or a major scientific discovery. These timeline infographic ideas turn historical or developmental information into a connected visual narrative.
Example Prompt
Make percentages easier to understand
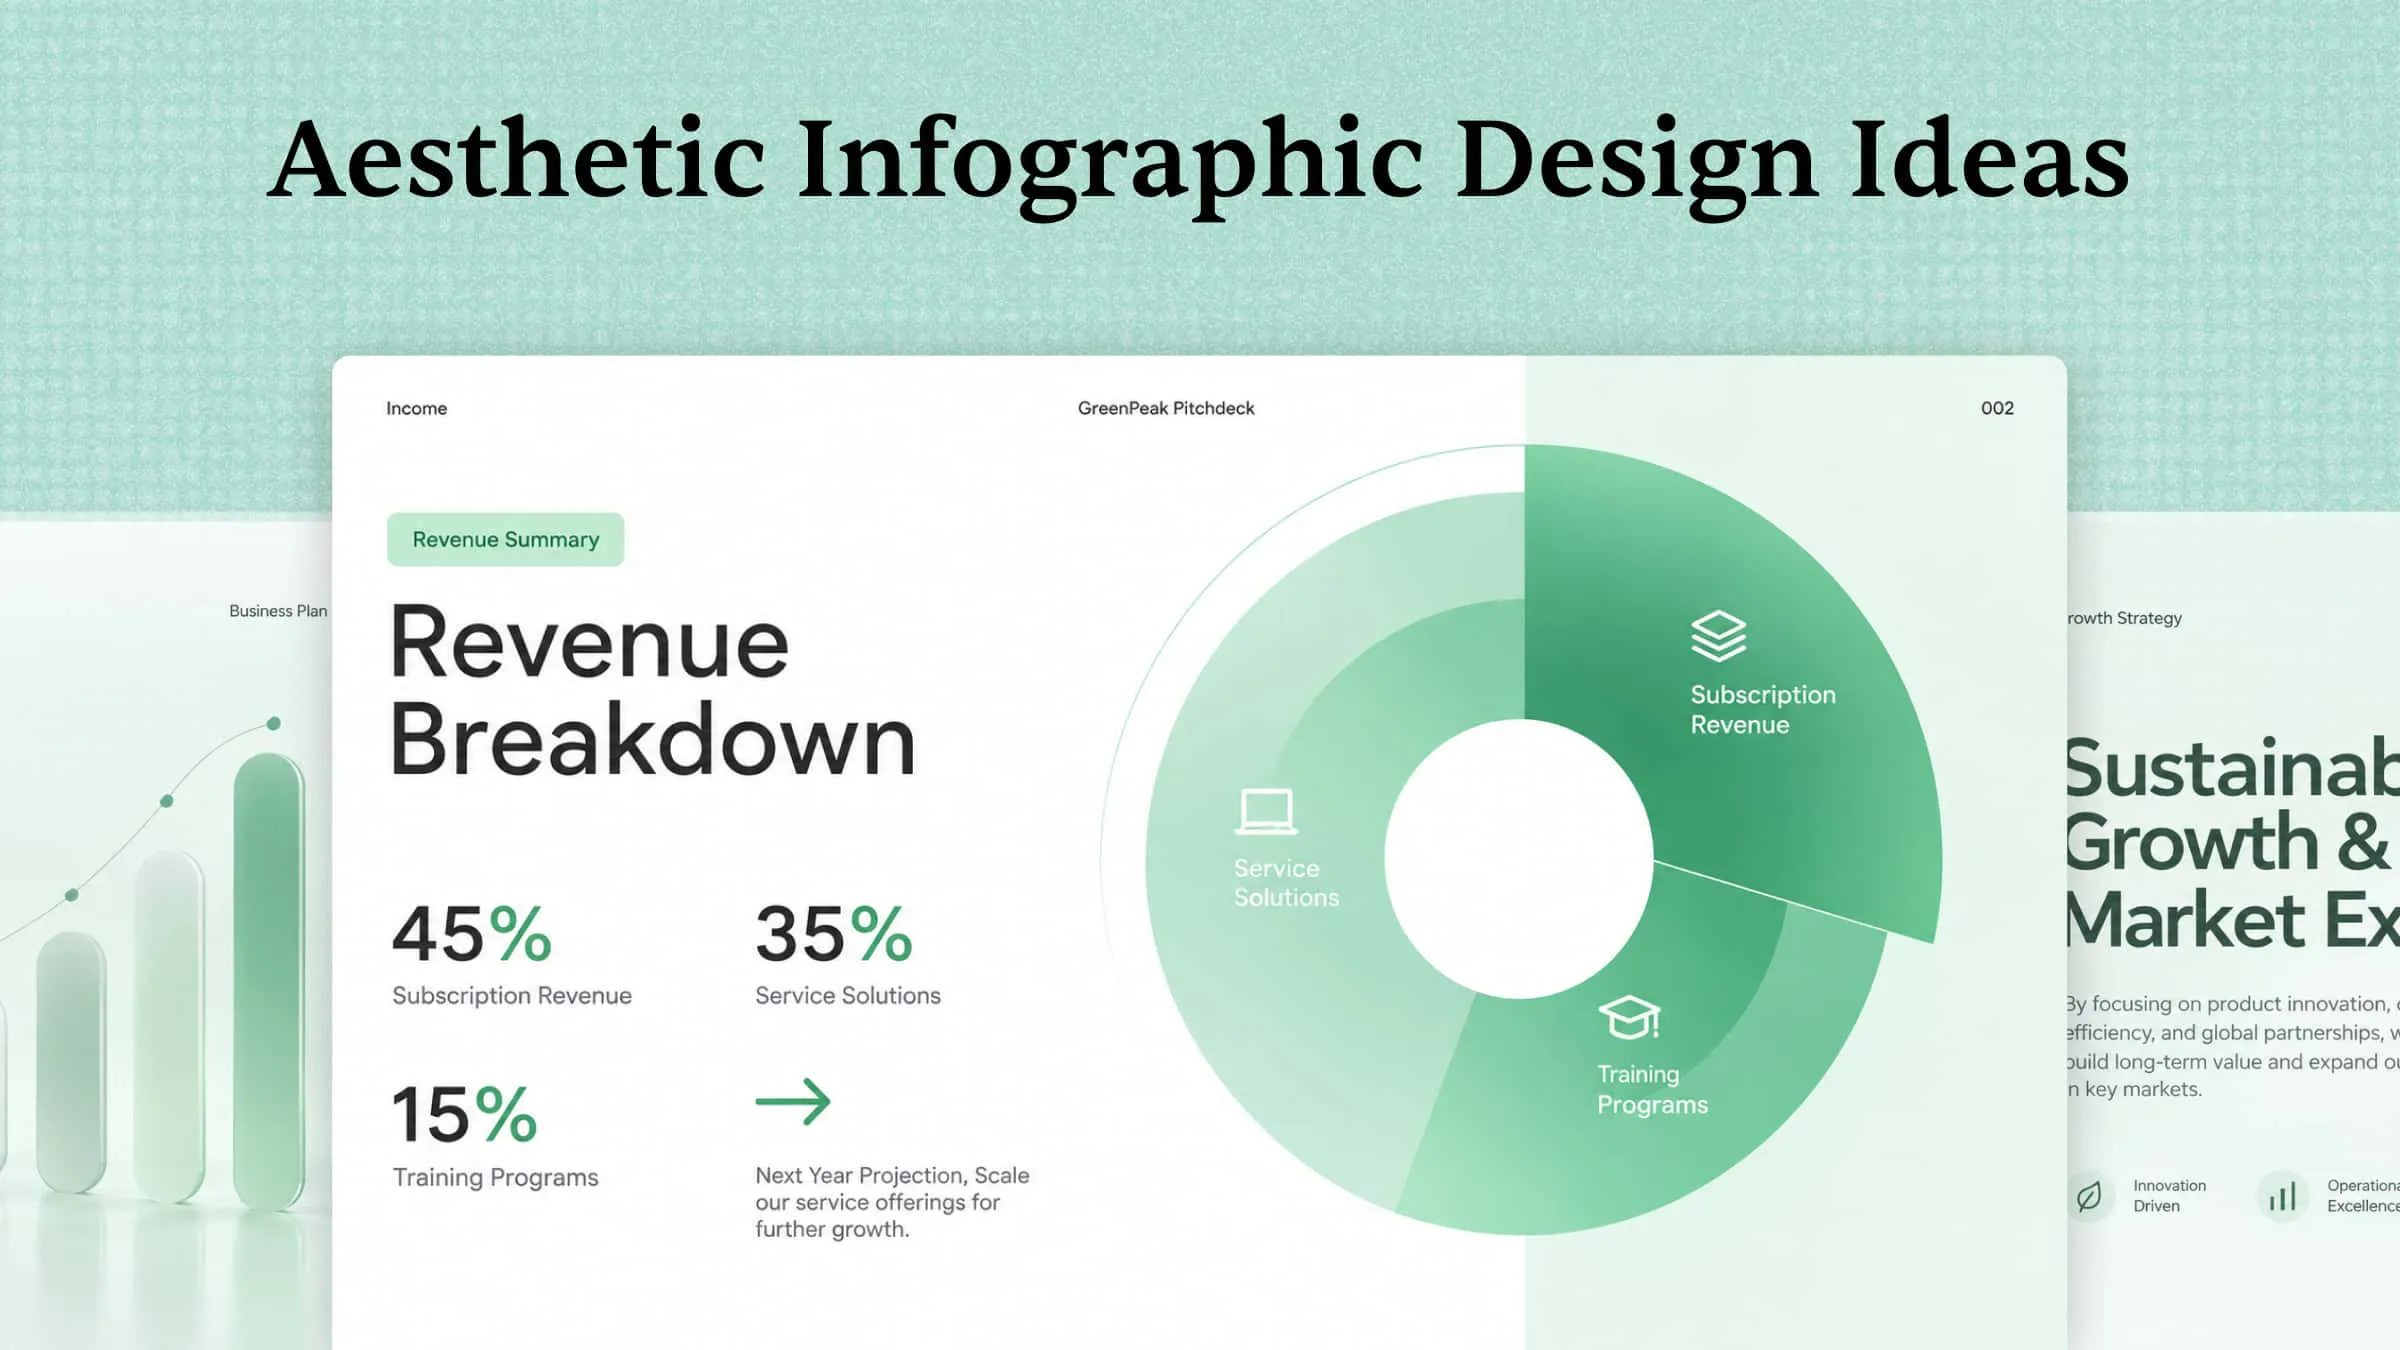
Percentages can feel abstract when presented as plain numbers, but visual representations make them easier to interpret. Use pie charts, progress bars, or pictograms to illustrate proportions and highlight important figures. For example, you could visualize household expenses, customer preferences, or energy consumption patterns. When presenting numerical information, these infographic formats help readers grasp proportions and relationships at a glance.
Example Prompt
Compare options side by side
When readers need to evaluate several choices, a side-by-side infographic makes the comparison more straightforward. Present each option using identical categories, such as price, features, benefits, or performance, so viewers can identify similarities and differences. You could compare products, learning methods, or travel packages. This format is especially useful for turning detailed comparisons into clear, easy-to-follow visuals.
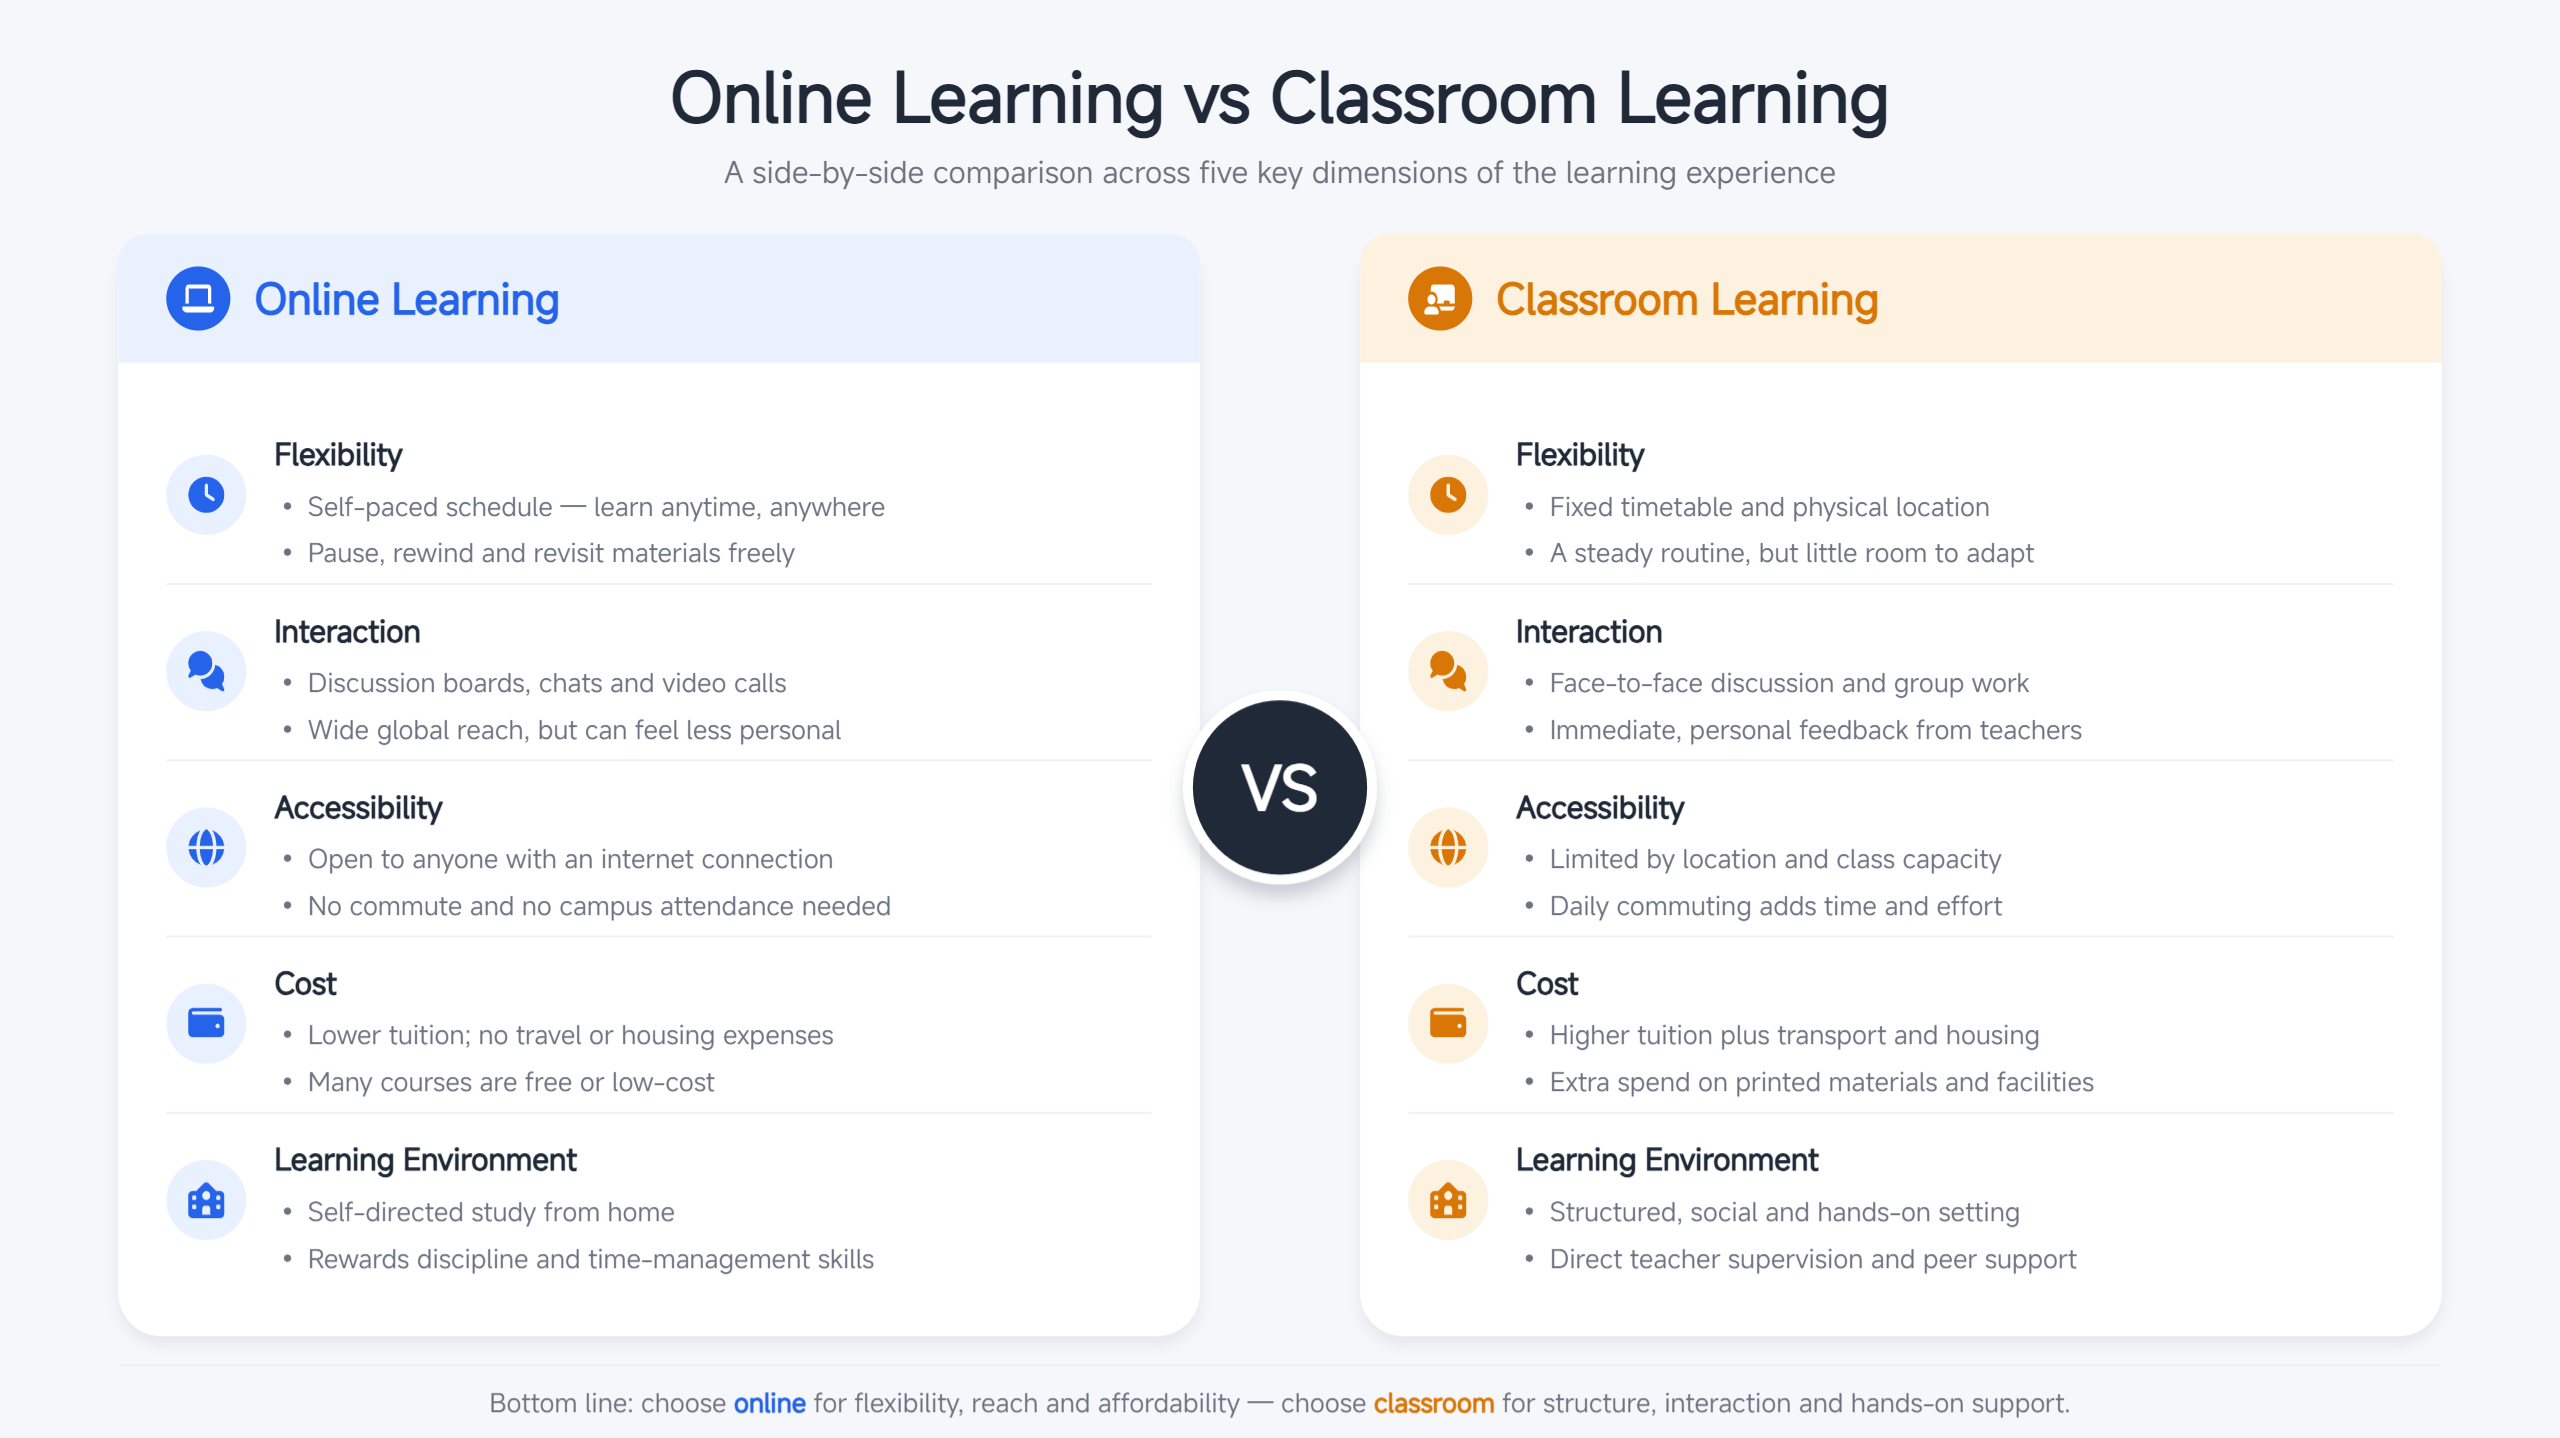
Example Prompt
Use contrasting colors to separate categories
Color can do more than make an infographic visually appealing; it can also establish a clear information hierarchy. Assign distinct, consistent shades to different categories so readers can distinguish between groups without examining every label. This technique works well for survey results, product features, and workflow stages.
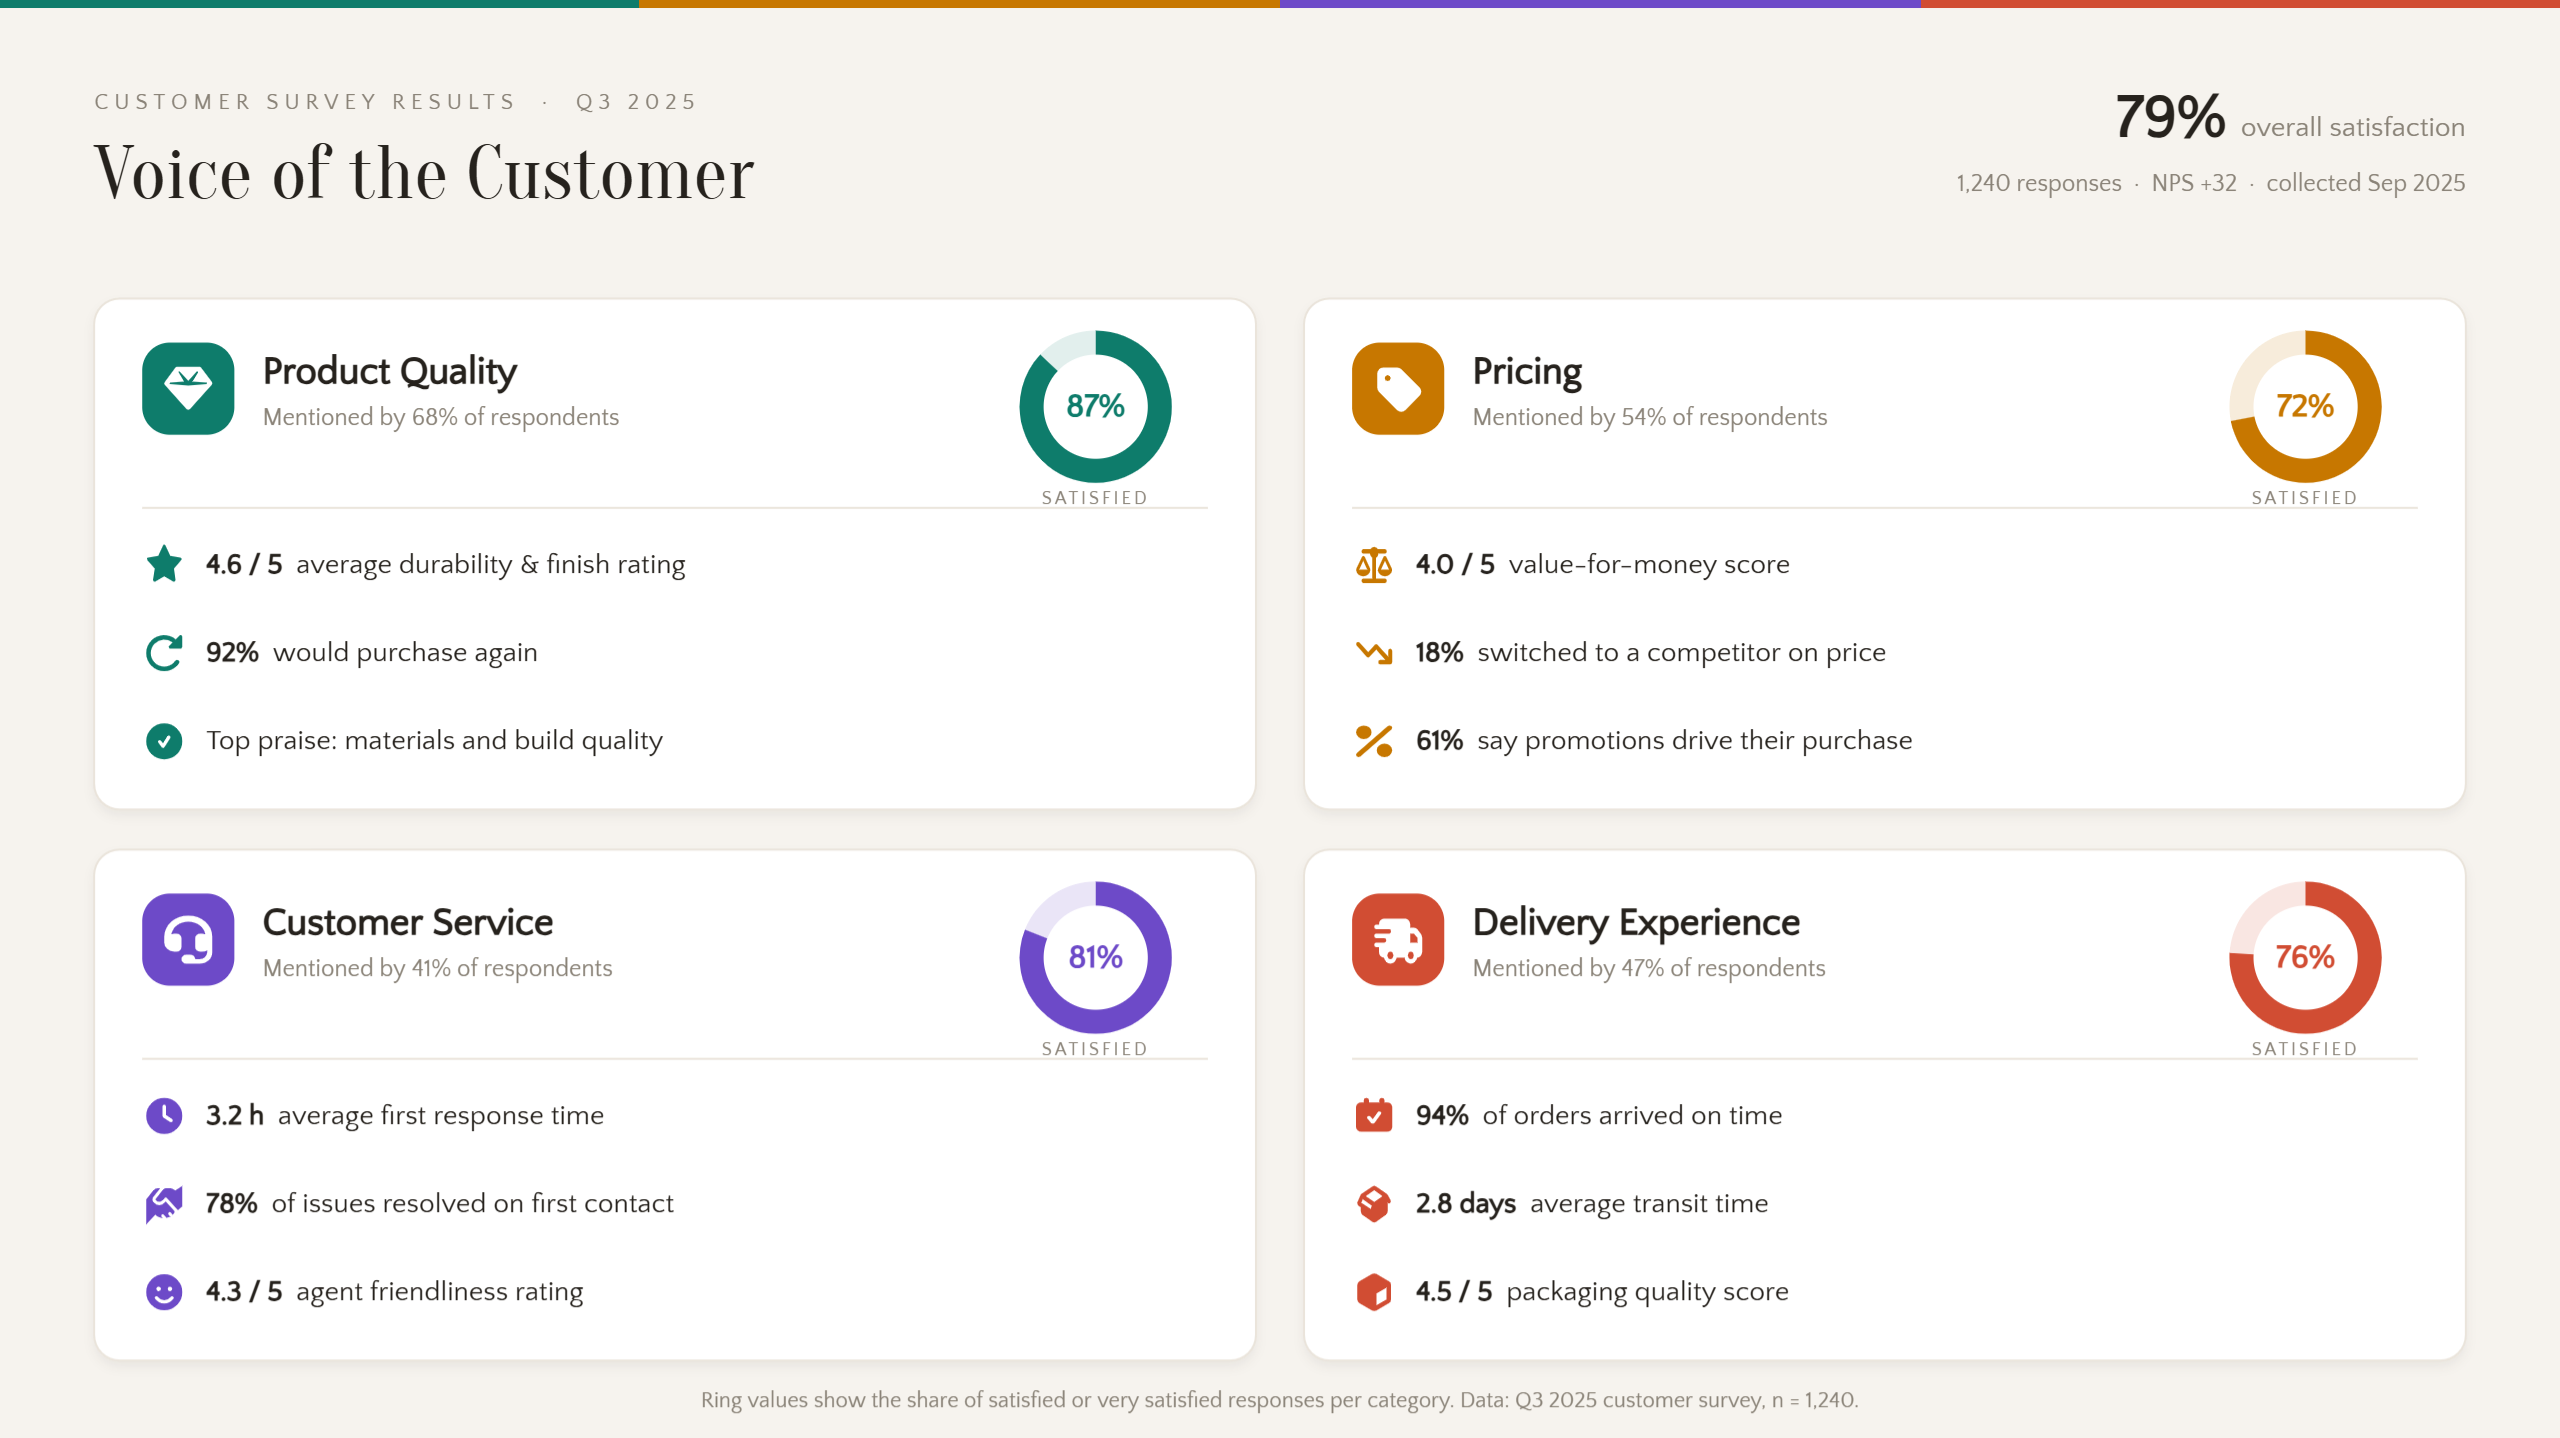
Example Prompt
Use icons to communicate key points
Icons provide a visual shorthand for communicating information without relying on lengthy explanations. Choose recognizable symbols that represent specific ideas, then pair them with concise labels to maintain clarity. For instance, safety guidelines, environmental statistics, and workplace instructions can all benefit from icon-based presentation. A balanced infographic aesthetic combines relevant illustrations, readable typography, and sufficient spacing rather than excessive decoration.
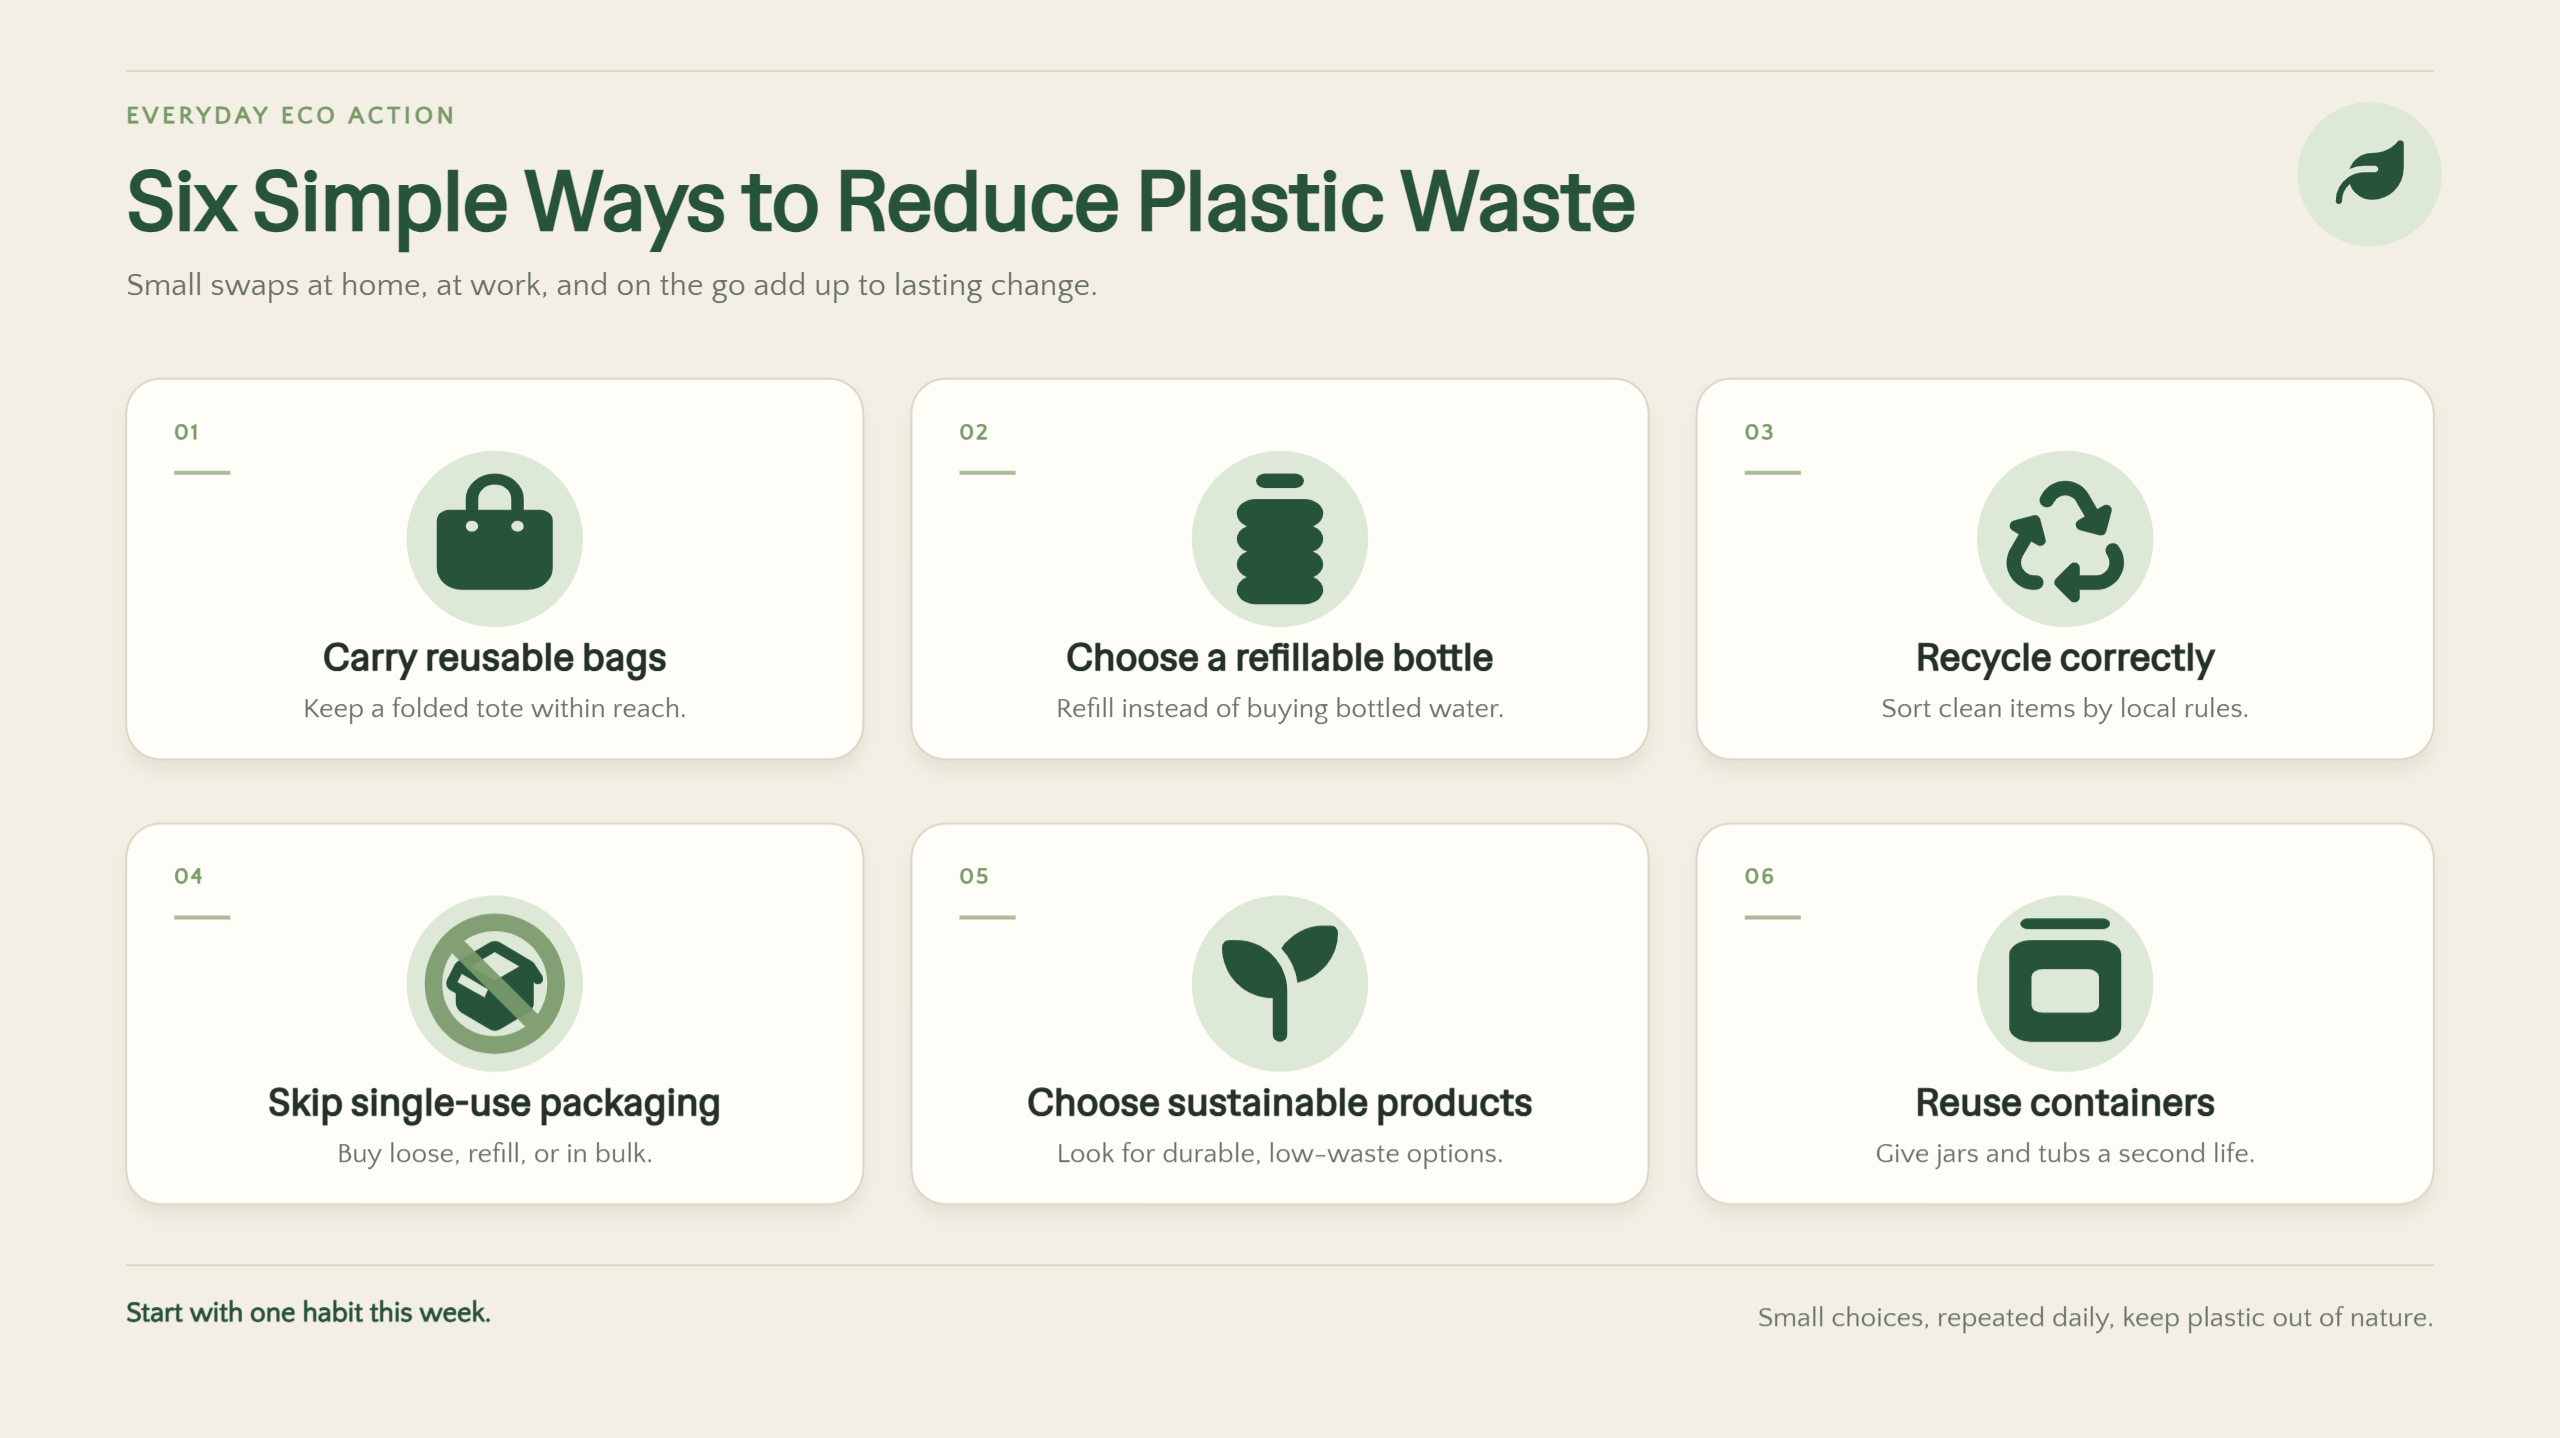
Example Prompt
Turn a résumé into a visual summary
A visual résumé presents professional experience and qualifications in a format that recruiters can scan quickly. Combine a career timeline, skill indicators, educational background, and selected achievements to create a clear overview of your professional journey. Keep the layout structured and prioritize relevant information over decorative elements.
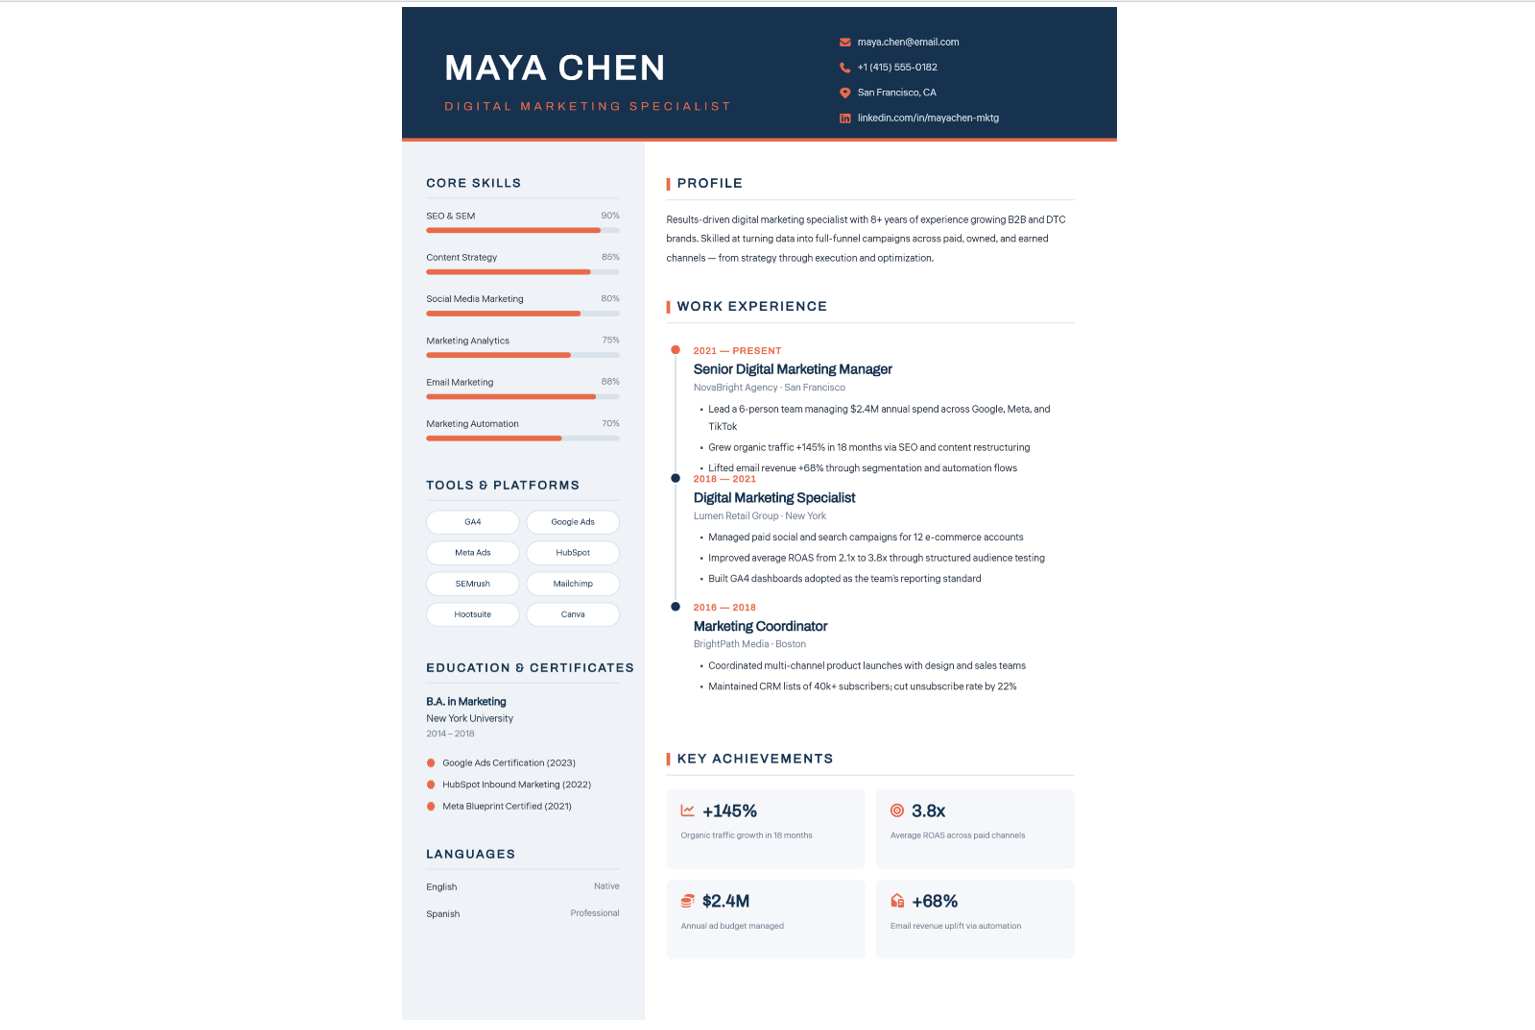
Example Prompt
Why use Kimi Design for infographic creation
Kimi Design streamlines infographic creation by turning your ideas into refined visual content. Here are some reasons for choosing Kimi Design for infographic creation.
Turn ideas and data into structured infographics
Describe your topic and key points in a prompt, or upload supporting documents and reference images to provide additional context. Kimi Design converts these inputs into cohesive infographics, combining well-organized text, purposeful visuals, and a clearly defined information hierarchy.
Create infographics for different scenarios and purposes
Whether you need educational infographics to explain concepts, business infographics to present reports and data, or marketing visuals to highlight product features and campaign messages, Kimi Design helps tailor infographic content and presentation to different needs. You can create visuals for classroom materials, business presentations, product introductions, social media posts, and more.
Refine layouts and content with direct control
Fine-tune typography, color schemes, graphic elements, and overall composition through natural-language instructions. You can also comment on specific components or edit them directly on the canvas, giving you greater precision over the design's details and final appearance.
Export your design in multiple formats for different needs
Export finished designs in PNG, JPG, PDF, PSD, or PPTX formats for convenient use across presentations, reports, digital publications, and social platforms. Editable elements also make future revisions easier, allowing you to update information or repurpose the design as your needs evolve.
Essential elements of an effective infographic
Aesthetic infographics need more than attractive graphics to communicate effectively. Below are the components that serve a clear purpose, guide the reader through the information, and make the central message easy to understand.
A clear headline
Start with a concise, descriptive headline that immediately establishes the infographic's subject. Choose wording that captures the reader's attention while setting accurate expectations about the information that follows. A well-defined title gives the entire composition a recognizable focus.
A focused main message
Build the infographic around one central idea rather than attempting to cover too many subjects at once. Select the most relevant details and remove information that distracts from your primary objective. This keeps the content purposeful and makes its key takeaway easier to remember.
A logical information hierarchy
Arrange content according to its importance, using headings, subheadings, spacing, and visual cues to establish a natural reading sequence. Place essential insights where readers can identify them quickly, then introduce supporting details in a coherent order. A deliberate structure prevents the design from feeling cluttered or difficult to follow.
Relevant visuals and graphics
Incorporate illustrations, icons, diagrams, and charts that clarify the subject rather than simply decorate the page. Each visual should reinforce the accompanying information and help readers interpret ideas more quickly. Select graphics that are meaningful to your topic and consistent with the infographic's overall purpose.
Readable typography and consistent colors
Choose legible typefaces and establish clear distinctions between titles, section headings, and body text. Use a cohesive color palette to group related information, highlight important details, and maintain visual balance. Consistency across these elements makes the infographic easier to navigate and more polished.
Accurate data and credible sources
Verify statistics, dates, figures, and factual claims before incorporating them into the design. Reference trustworthy sources and provide clear citations wherever necessary, so readers can assess the information's reliability. Accurate content strengthens the infographic's credibility and prevents misleading conclusions.
Conclusion
In conclusion, infographics turn complex information into clear, engaging visuals that help readers understand and remember key messages. Exploring different infographic ideas can help you present statistics, compare options, explain processes, and share important information effectively. Kimi Design makes infographic creation easier by transforming prompts, documents, and reference images into editable designs.