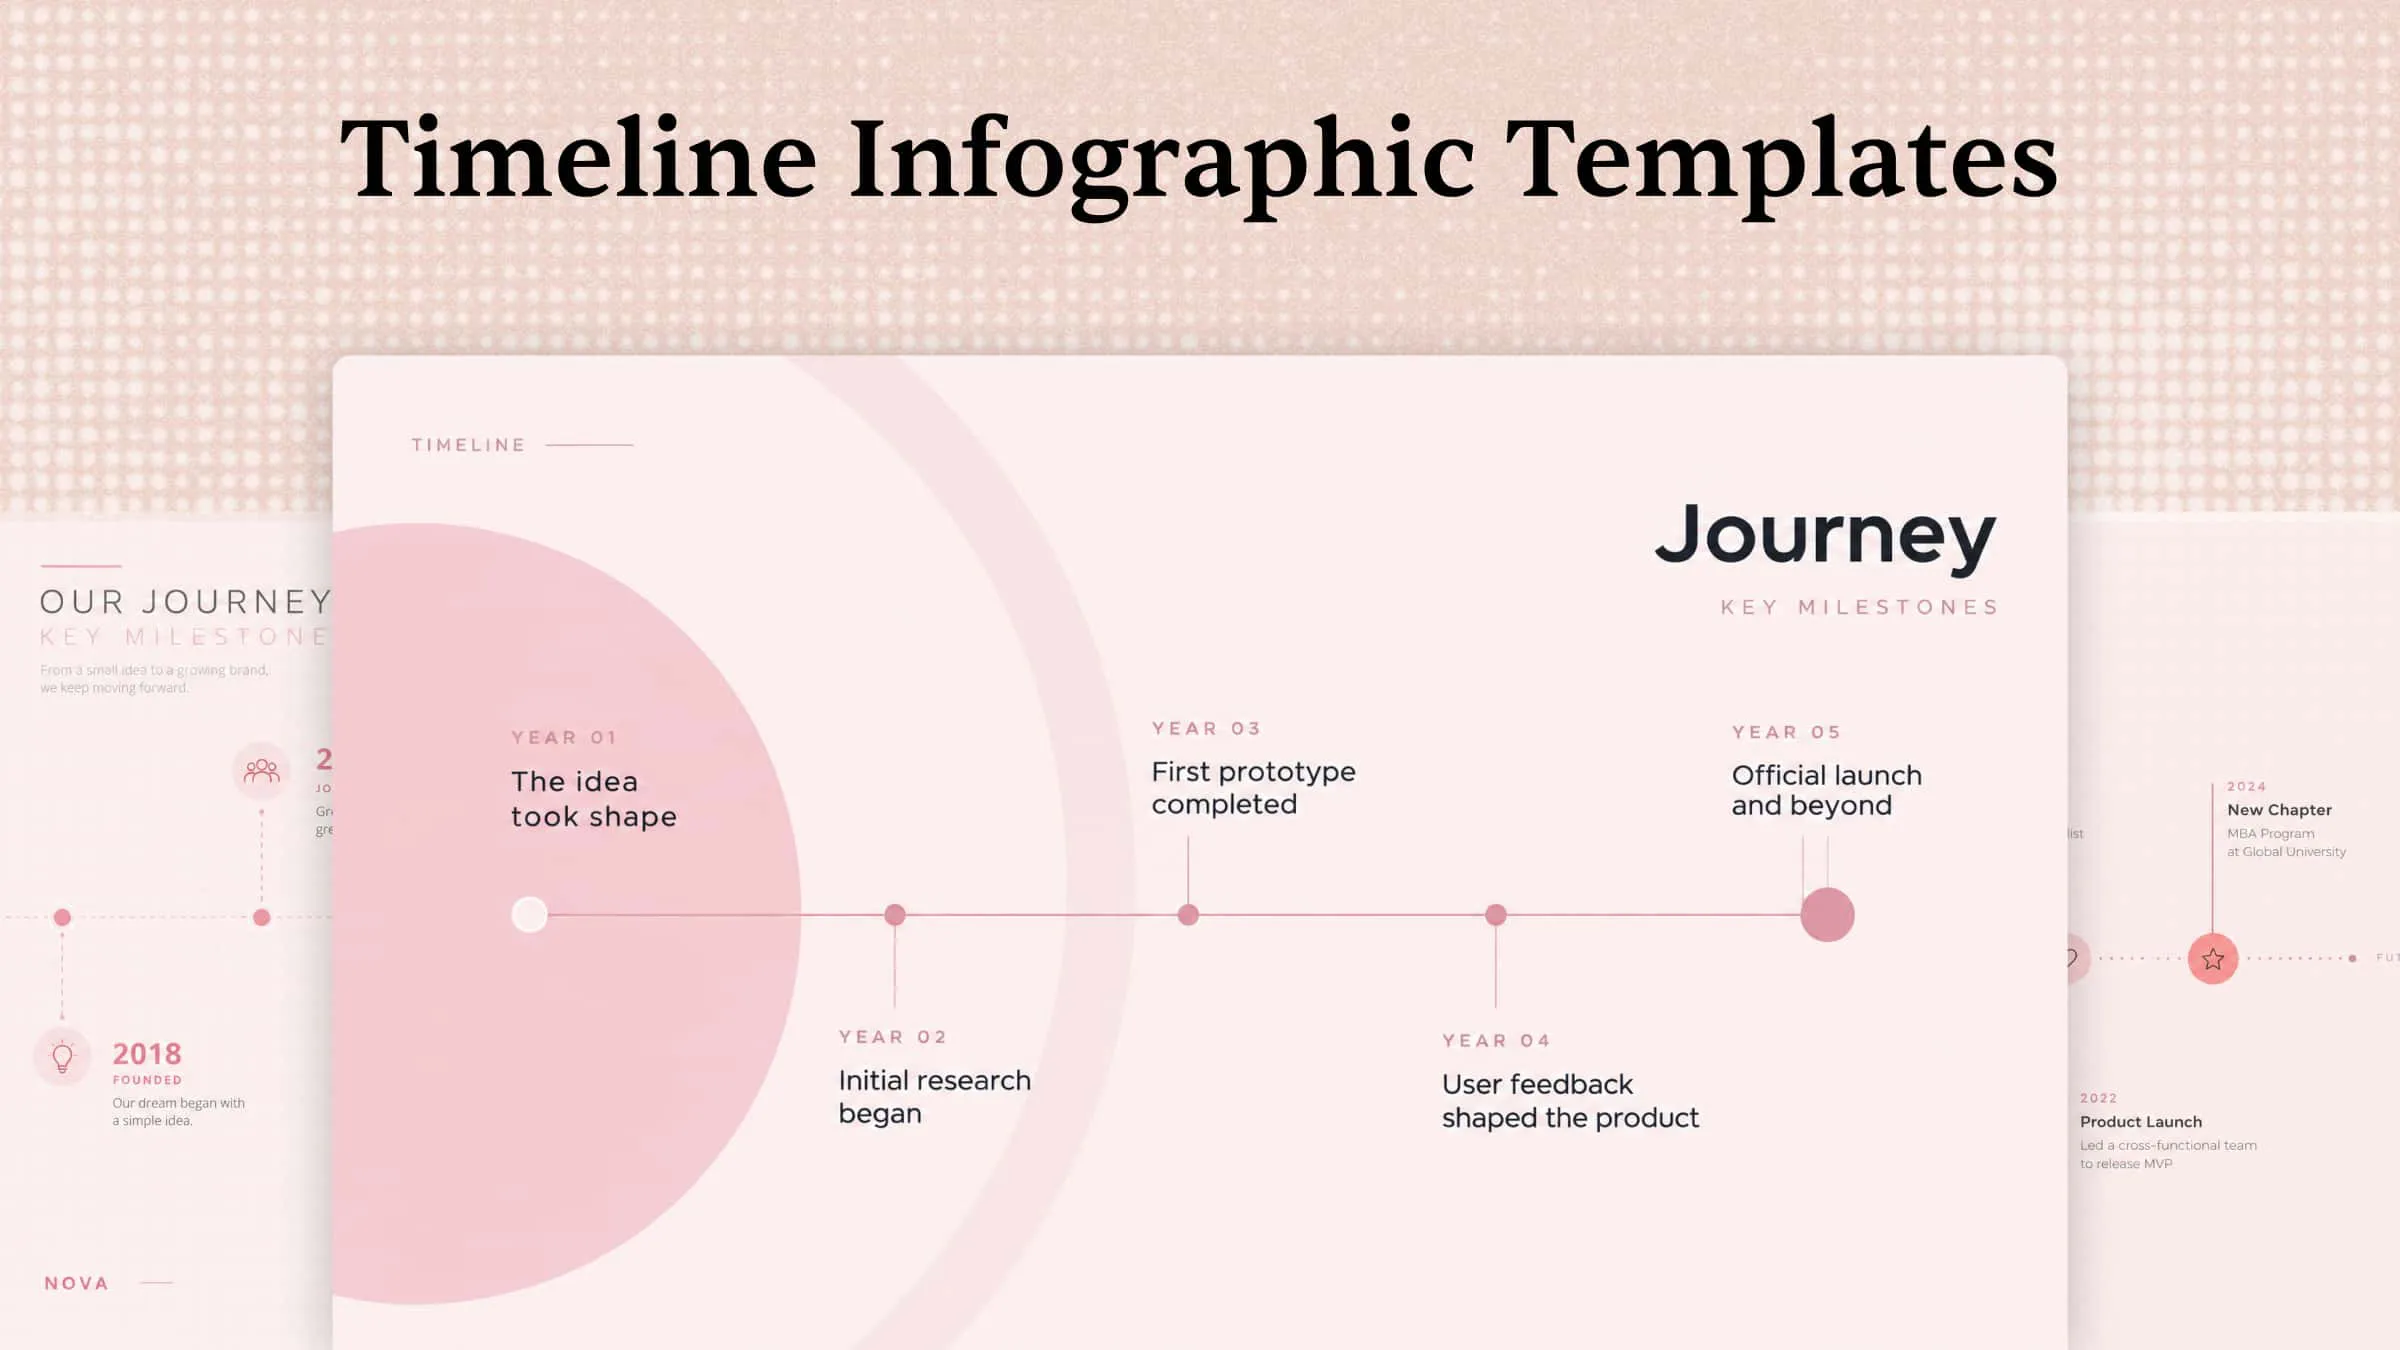
Timelines bring dates, key events, and milestones together in a clear visual sequence, making complex information easier to understand and follow. Whether you're presenting historical events, outlining project stages, or mapping out future plans, the right timeline infographic templates can help organize information and highlight important connections. This article explores 10 timeline infographic templates, featuring different layouts and practical design ideas.
Overview of 10 timeline infographic templates
Timeline infographic templates come in different styles, from simple chronological designs to creative visuals that highlight key events and milestones. The following templates will be introduced based on their layout, features, and uses to help you present information clearly and tell stories with confidence.
| Timeline infographic templates | Key content | Visual direction | Suitable for |
|---|---|---|---|
| Historical timeline infographics | Historical events, important dates, key figures, major milestones | Chronological order, date labels, historical images | History lessons, educational projects |
| Project timeline infographics | Project phases, tasks, deadlines, key milestones | Connected steps, clear date markers, organized layout | Project planning, team presentations |
| Business growth timeline infographics | Company beginnings, growth stages, achievements, business milestones | Professional colors, growth indicators, milestone markers | Business reports, company profiles |
| Career timeline infographics | Education, work experience, promotions, professional achievements | Date-based sections, simple icons, clean layout | Resumes, portfolios, professional profiles |
| Product development timeline infographics | Research, design, testing, launch, product updates | Step-by-step stages, progress markers, product visuals | Product planning, development reports |
| Education timeline infographics | Academic milestones, qualifications, courses, learning progress | Clear dates, educational icons, structured sections | Student portfolios, academic presentations |
| Event timeline infographics | Event schedules, activities, session times, important dates | Time labels, connected markers, clear sections | Conferences, workshops, event planning |
| Marketing campaign timeline infographics | Campaign stages, content planning, launch dates, promotional activities | Color-coded phases, calendar markers, visual flow | Marketing plans, campaign presentations |
| Scientific discovery timeline infographics | Research milestones, experiments, discoveries, scientific breakthroughs | Data points, date labels, scientific icons | Research presentations, science education |
| Future roadmap timeline infographics | Future goals, upcoming tasks, target dates, planned milestones | Forward-moving steps, goal markers, progress indicators | Strategic planning, business roadmaps |
10 examples of timeline infographics to try in 2026
Different purposes call for distinct timeline styles, from historical events and career milestones to business growth and future plans. These 10 timeline infographic examples showcase a range of layouts, each suited to different types of information and presentation needs. With Kimi Design, an AI design generator, you can turn an idea into a timeline using a short prompt. It can generate layouts, date markers, text, colors, and visual elements based on your instructions. You can review the results, refine the design to match your needs, and export the infographic.
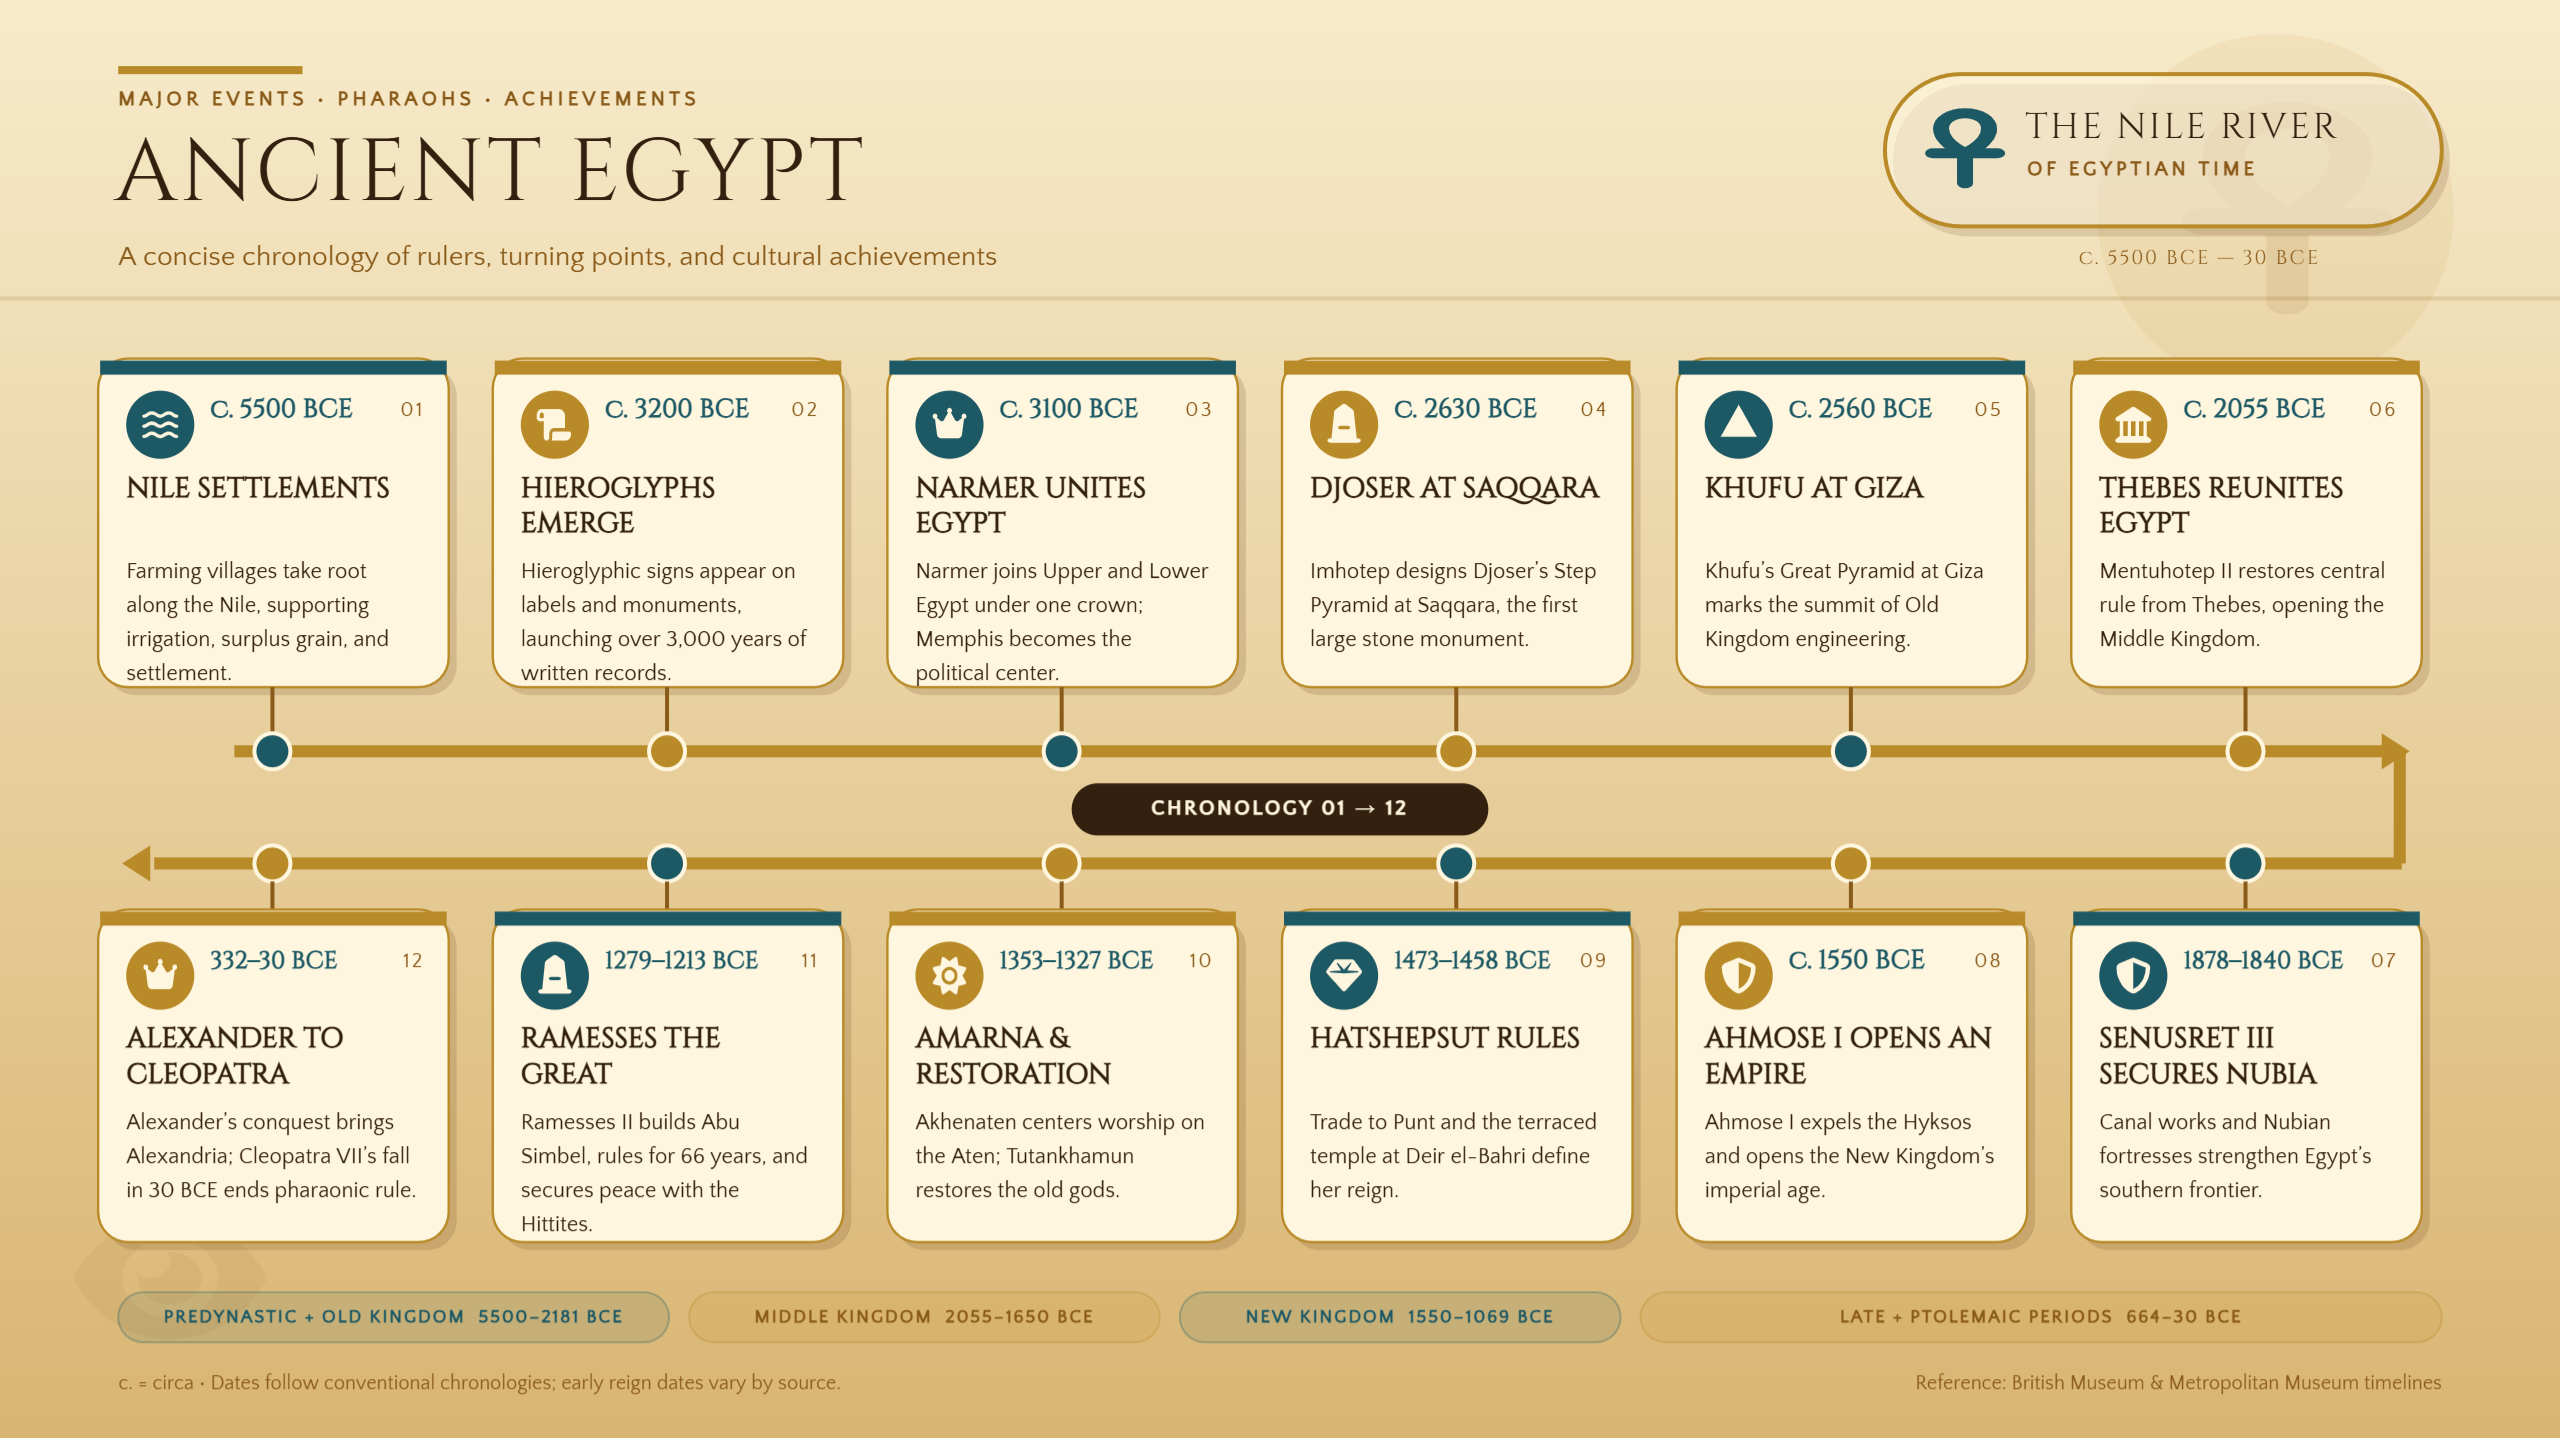
Historical timeline infographic
A historical timeline presents important events and dates in the order they happened. It helps readers understand how events connect and how history changes over time. Use clear labels, simple visuals, and key milestones to make historical information easy to follow. A well-organized design can turn complex historical details into a clear and engaging story.
Prompt:
Project timeline infographic
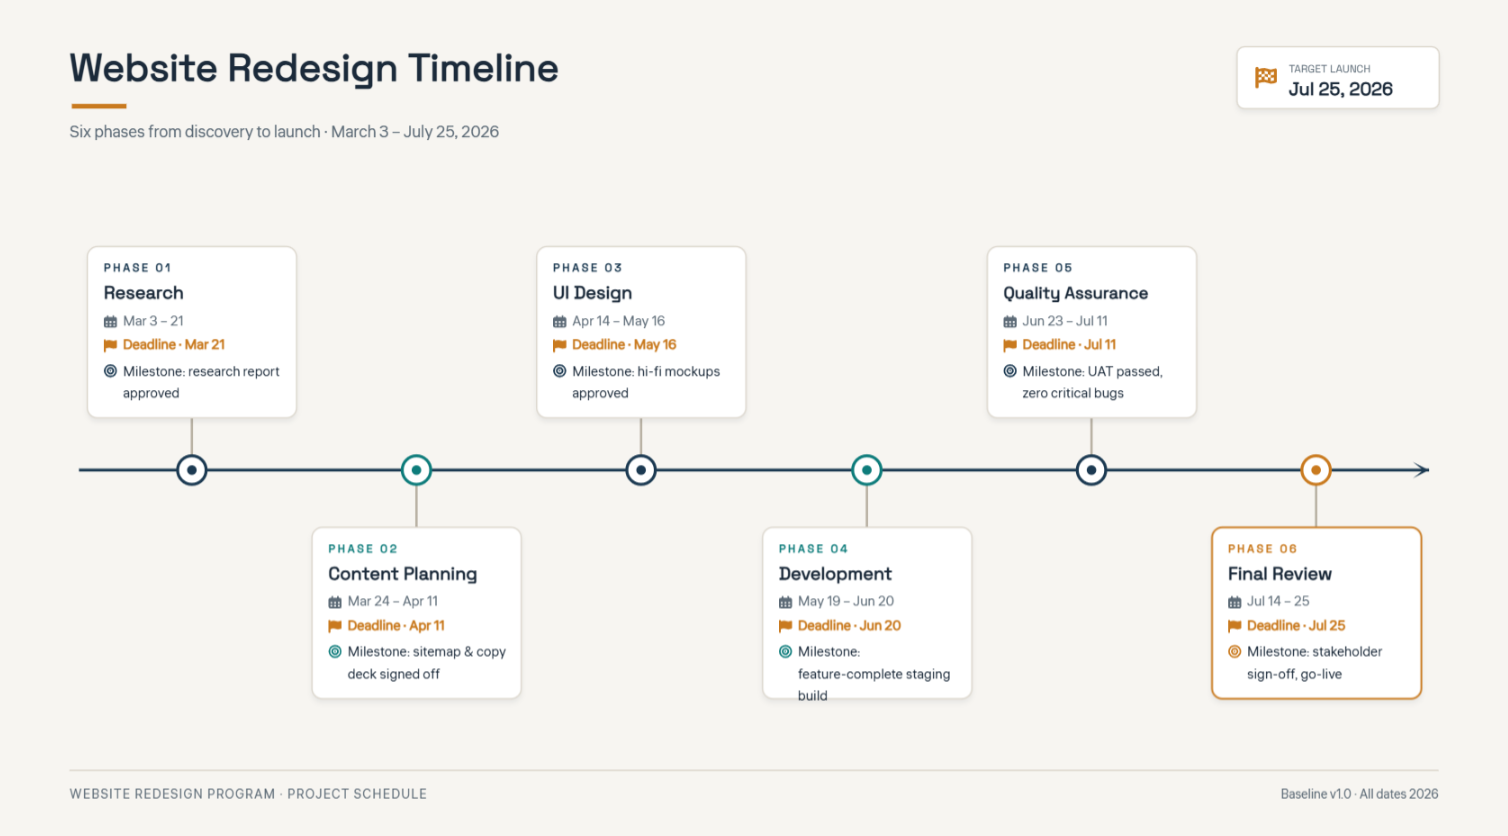
A project timeline infographic breaks a project into manageable steps, showing when each task should begin and finish. Teams can use this visual guide to plan work, monitor progress, and meet targets on time. Dates, milestone markers, and short descriptions make the schedule easier to understand. This format keeps everyone aware of their responsibilities throughout the project.
Prompt:
Business growth timeline infographic
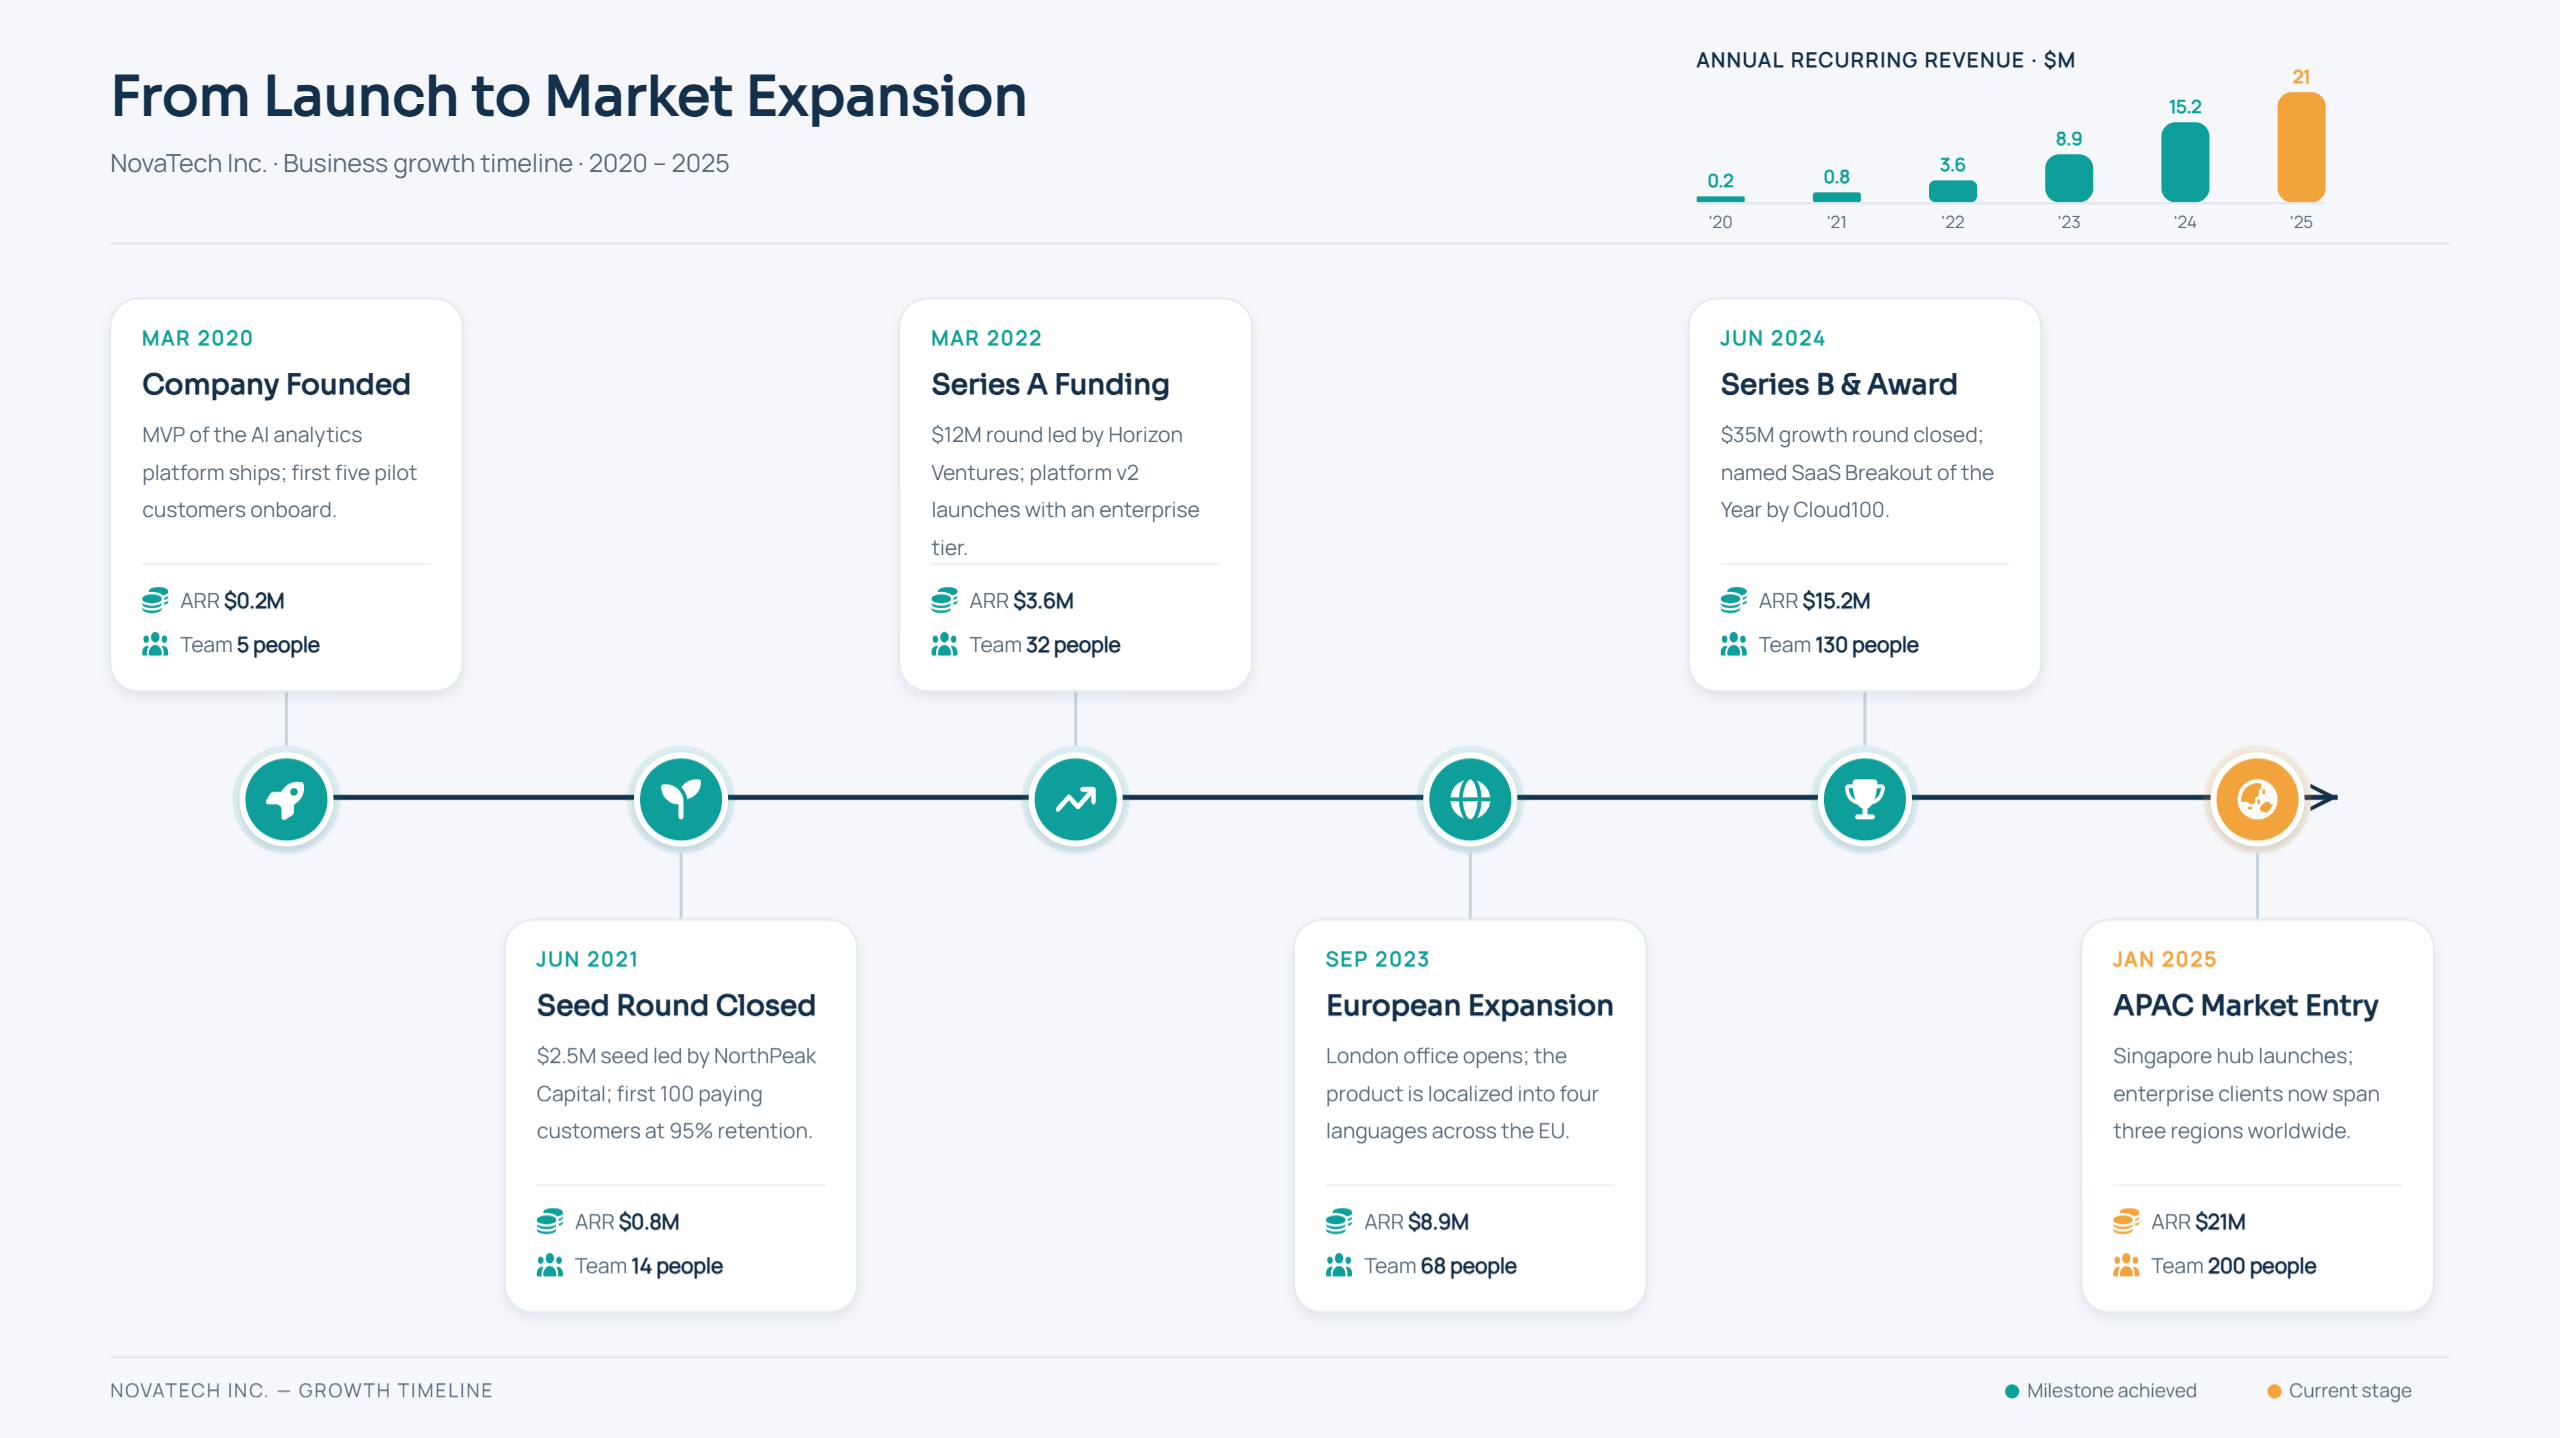
From its launch to market expansion, a business growth timeline highlights the key stages of a company's development. Major achievements, new product launches, and important dates show how the company has progressed. Brief notes explain each milestone and its role in business growth. Together, these details give readers a clear picture of the company's journey and success.
Prompt:
Career timeline infographic
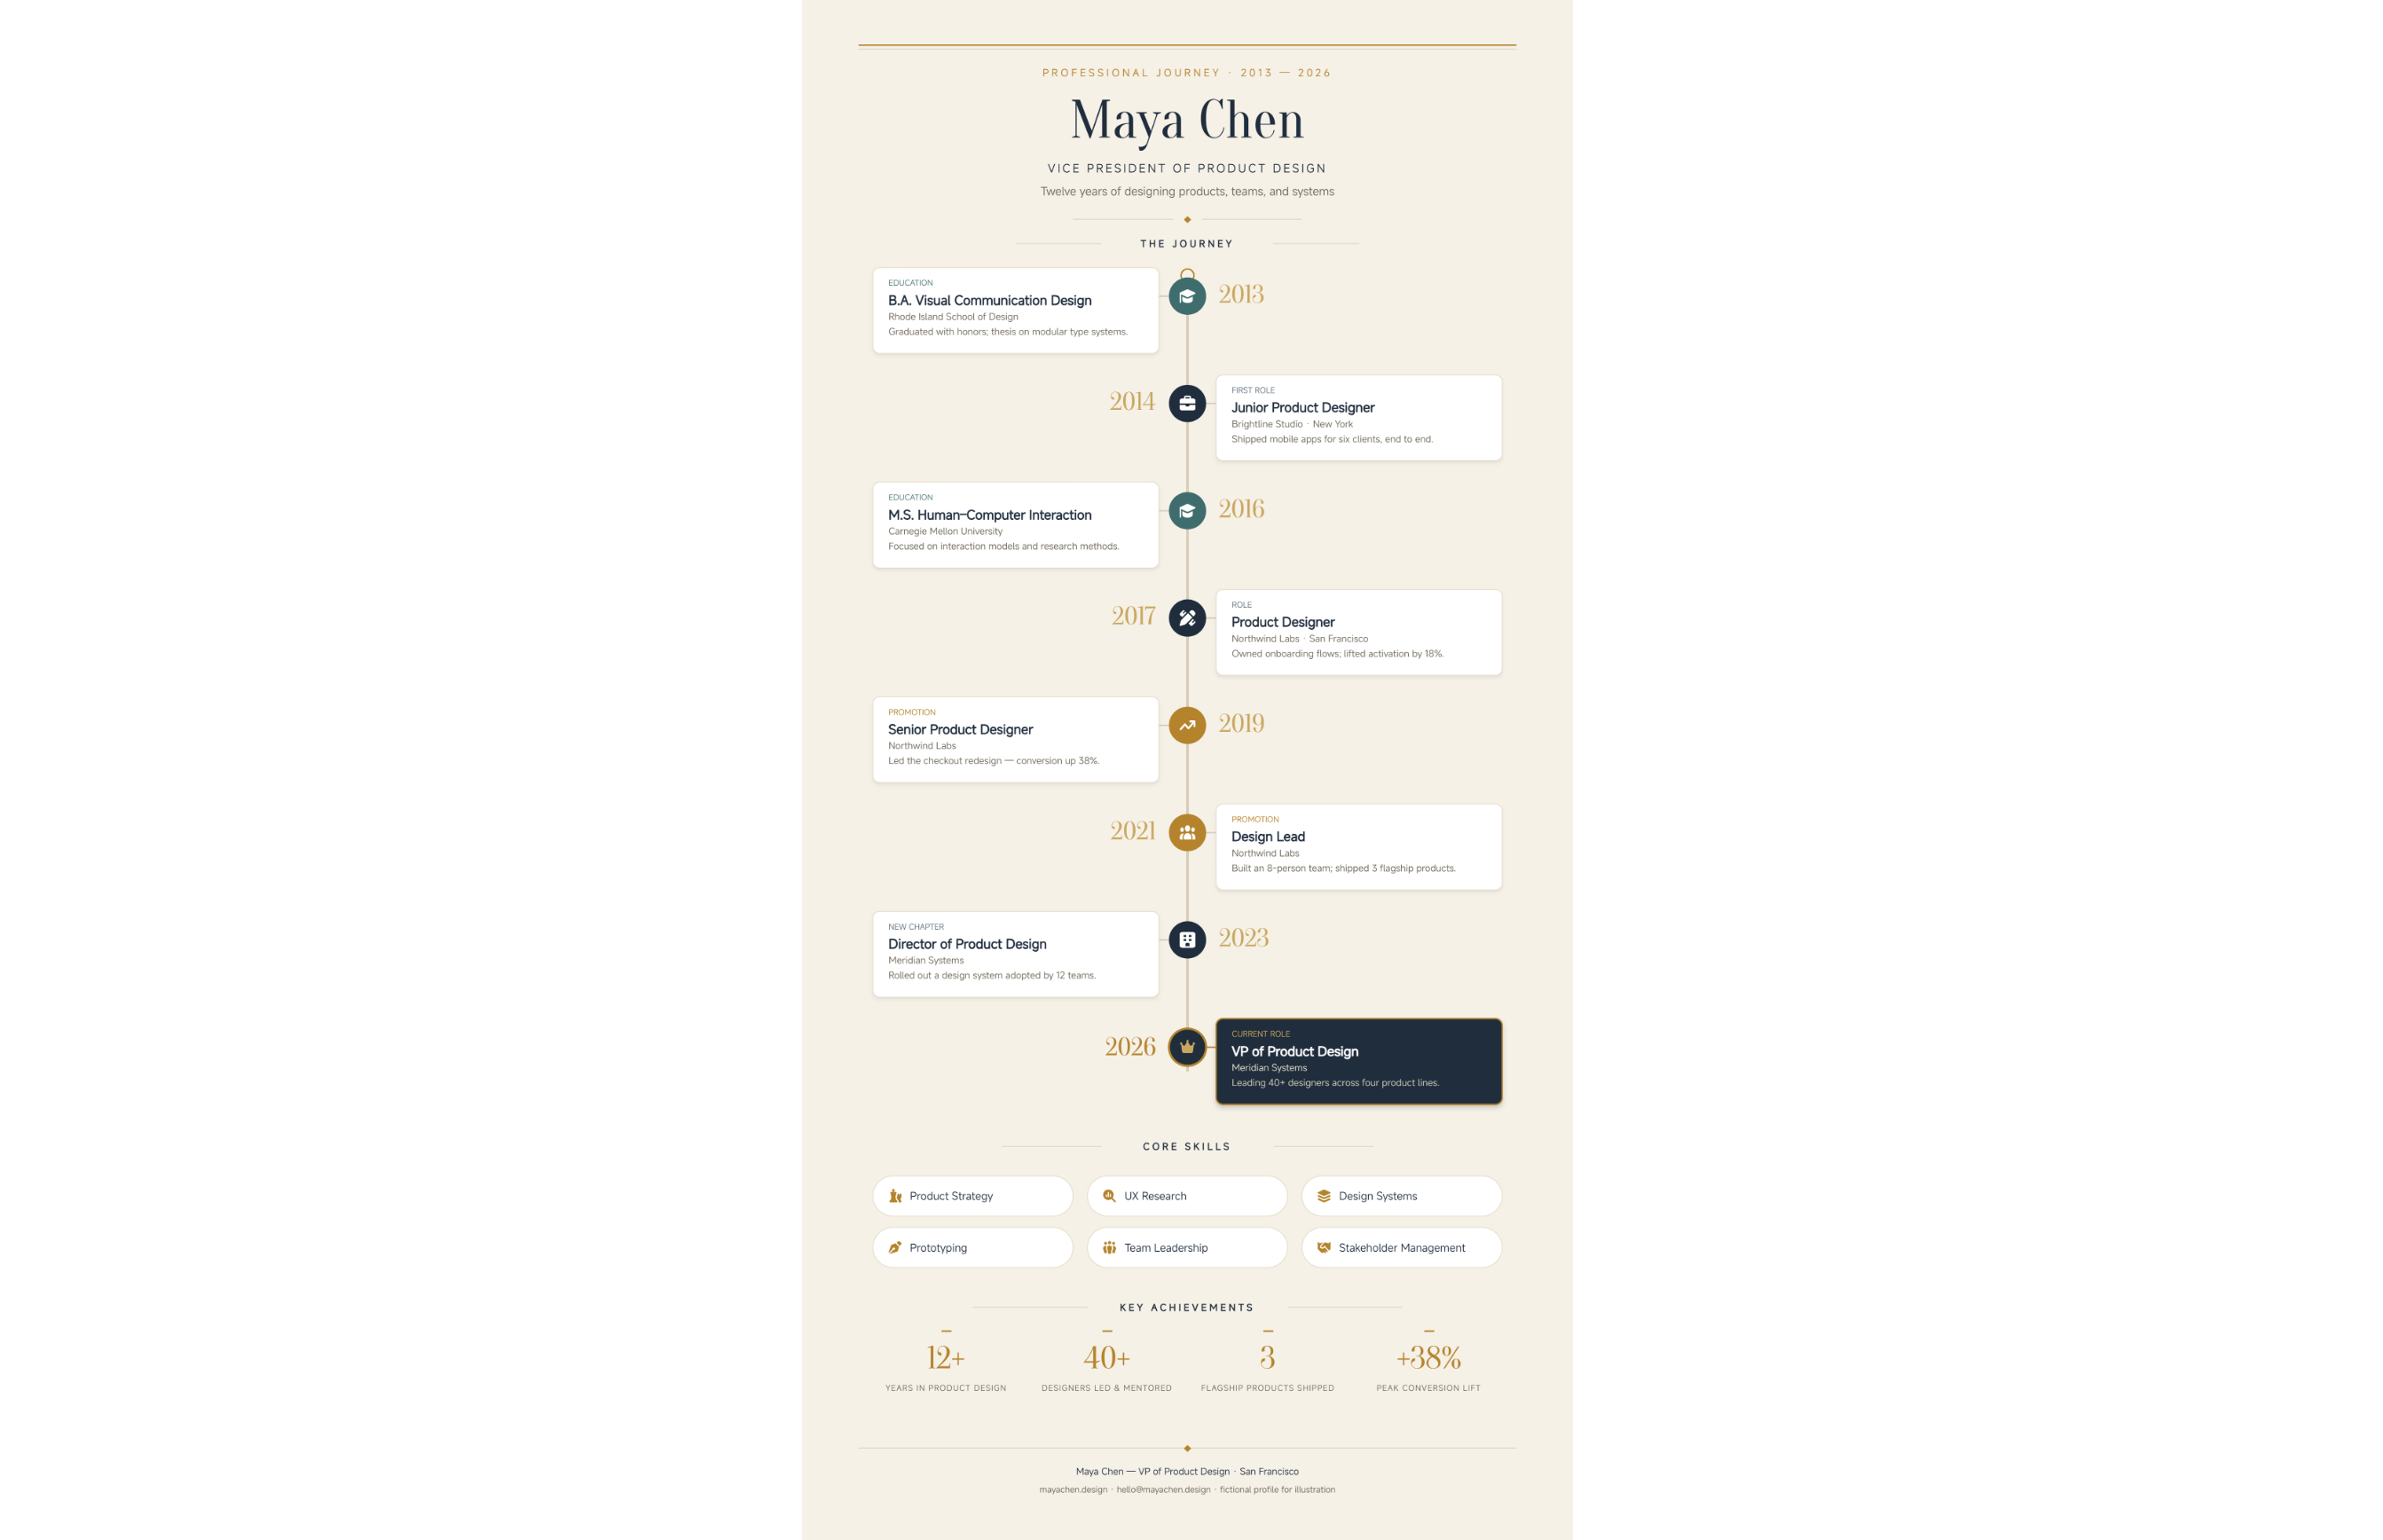
A career timeline shows a person's journey through education, work experience, and professional achievements. It presents important career steps in the order they happened, making progress easy to see. Job roles, promotions, and key dates help highlight skills and experience. This format turns a traditional resume into an attractive visual summary.
Prompt:
Product development timeline infographic
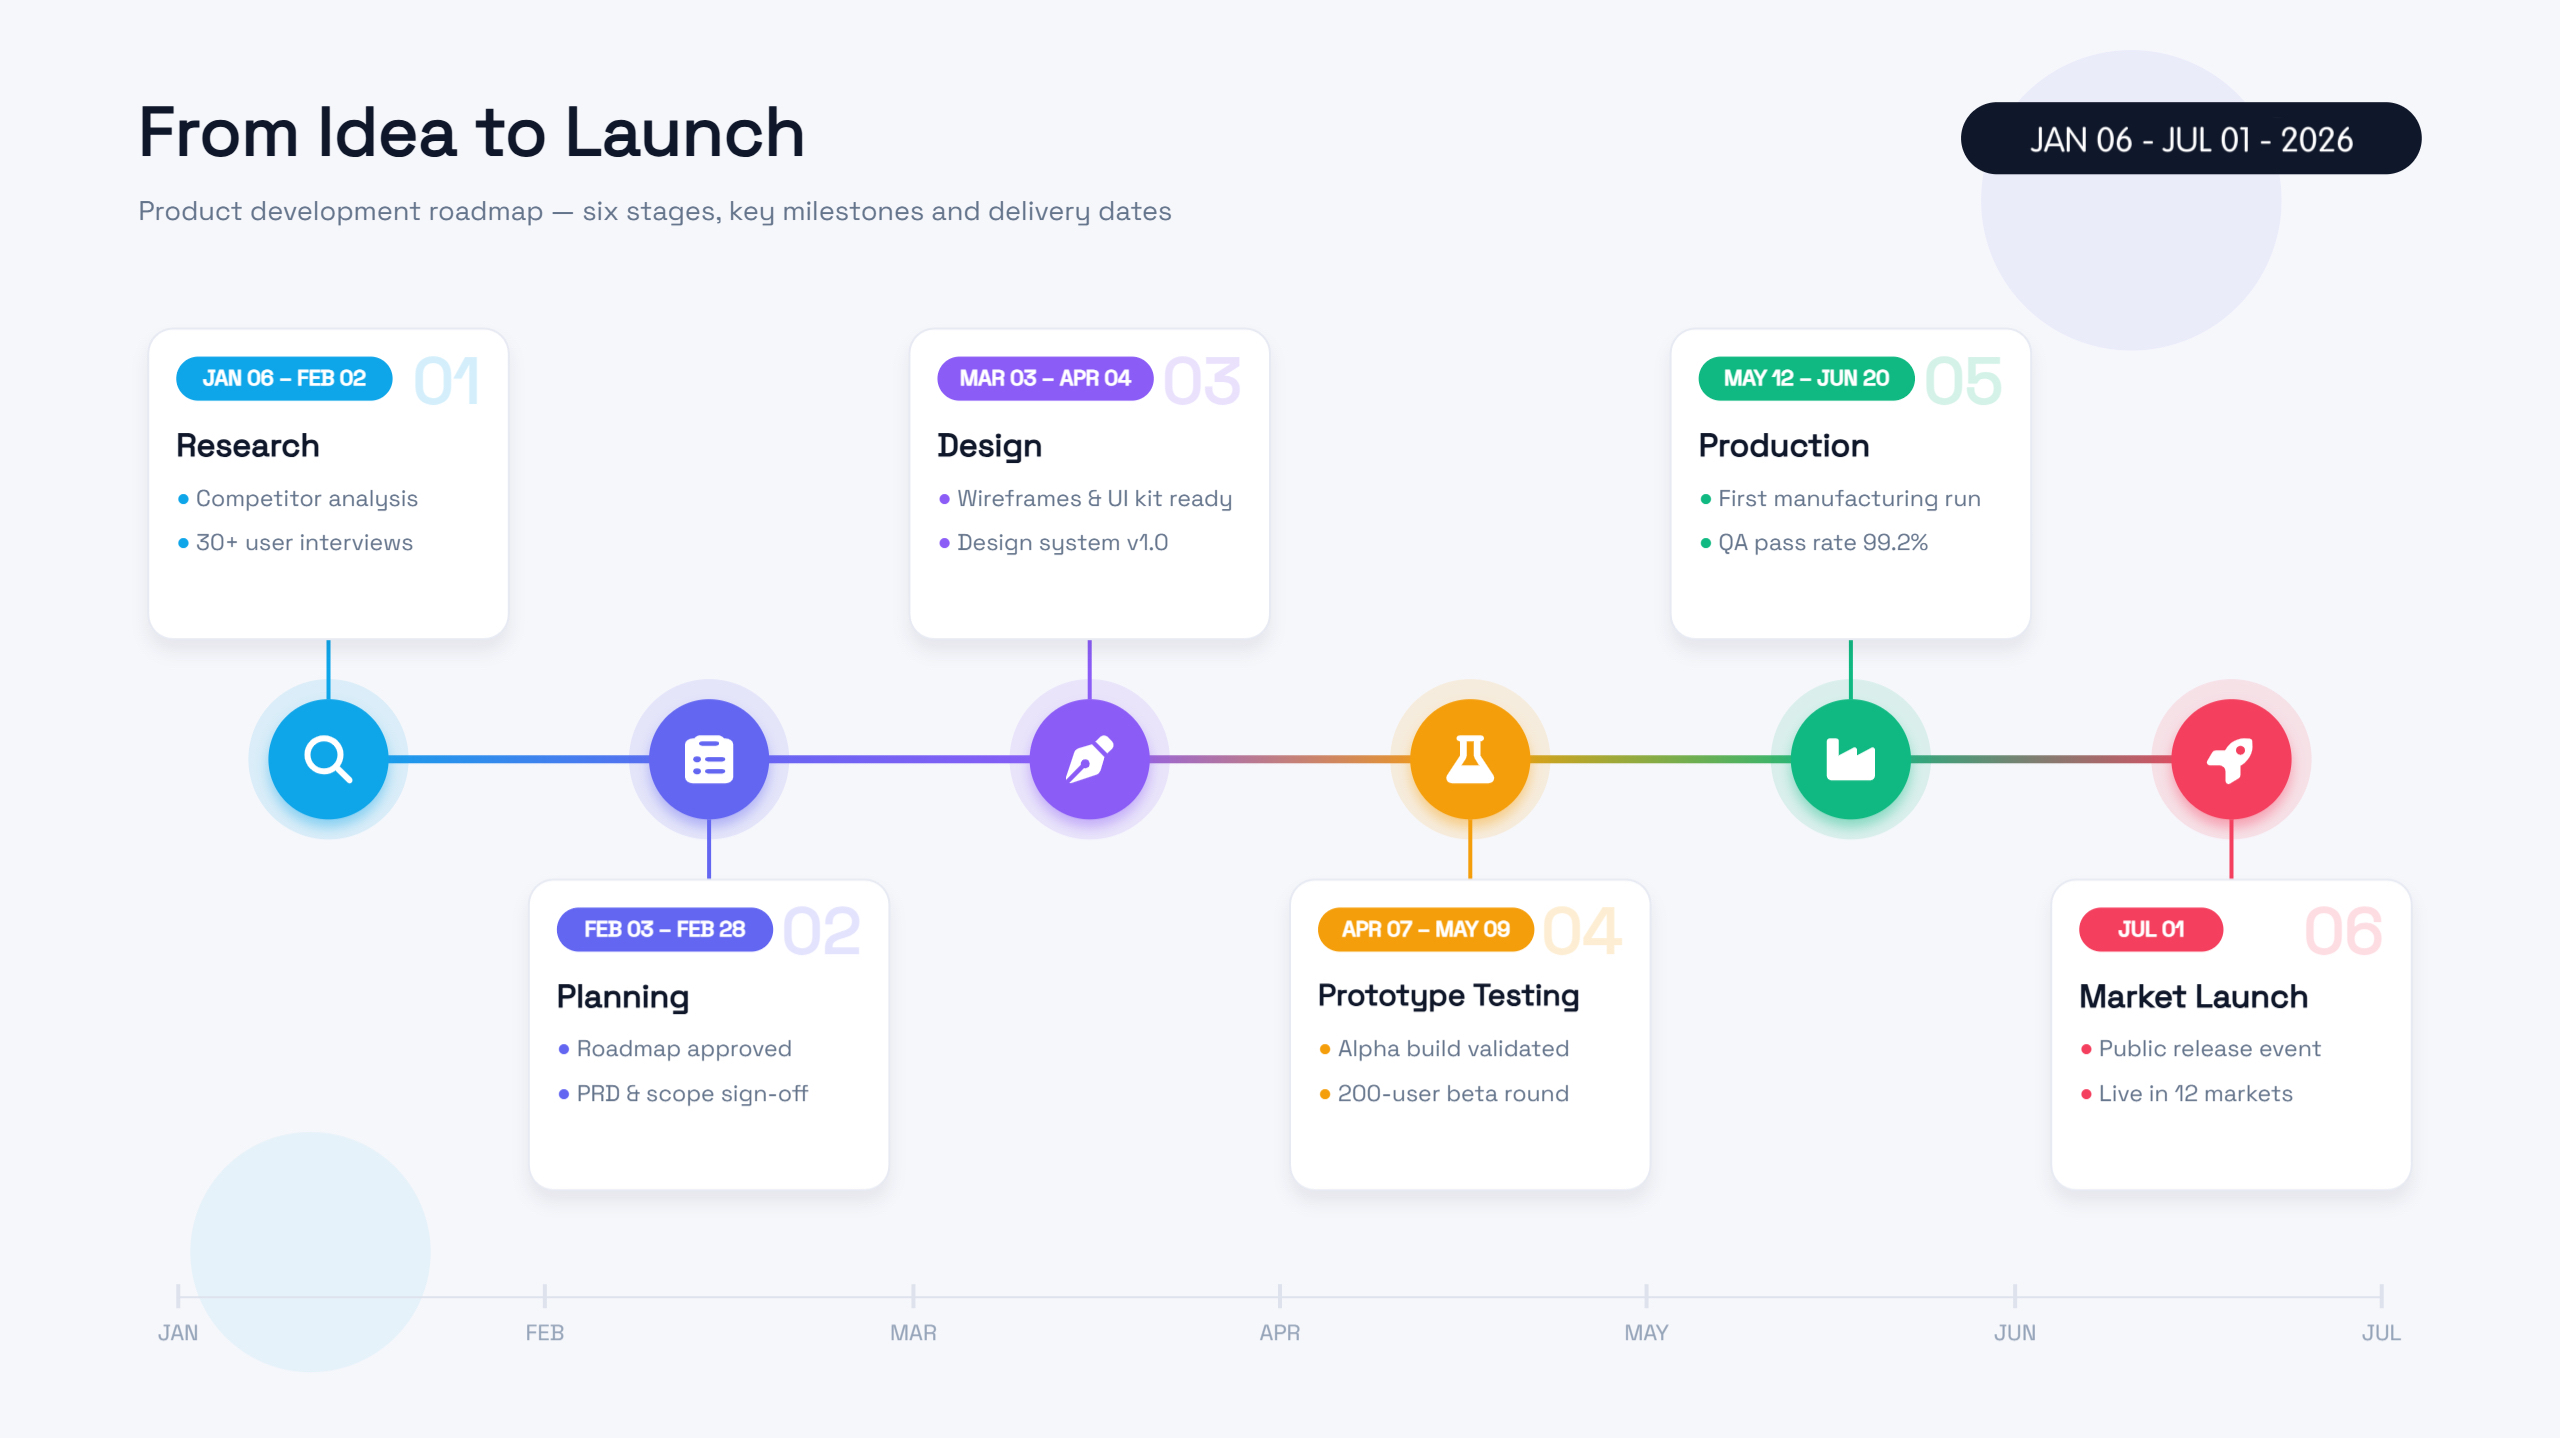
From the first idea to the final launch, a product passes through several important stages. A product development timeline arranges these steps in chronological order, covering research, design, and testing. Key dates, milestones, and brief notes show what happens at each point. Teams can use this format to follow progress and prepare for upcoming tasks.
Prompt:
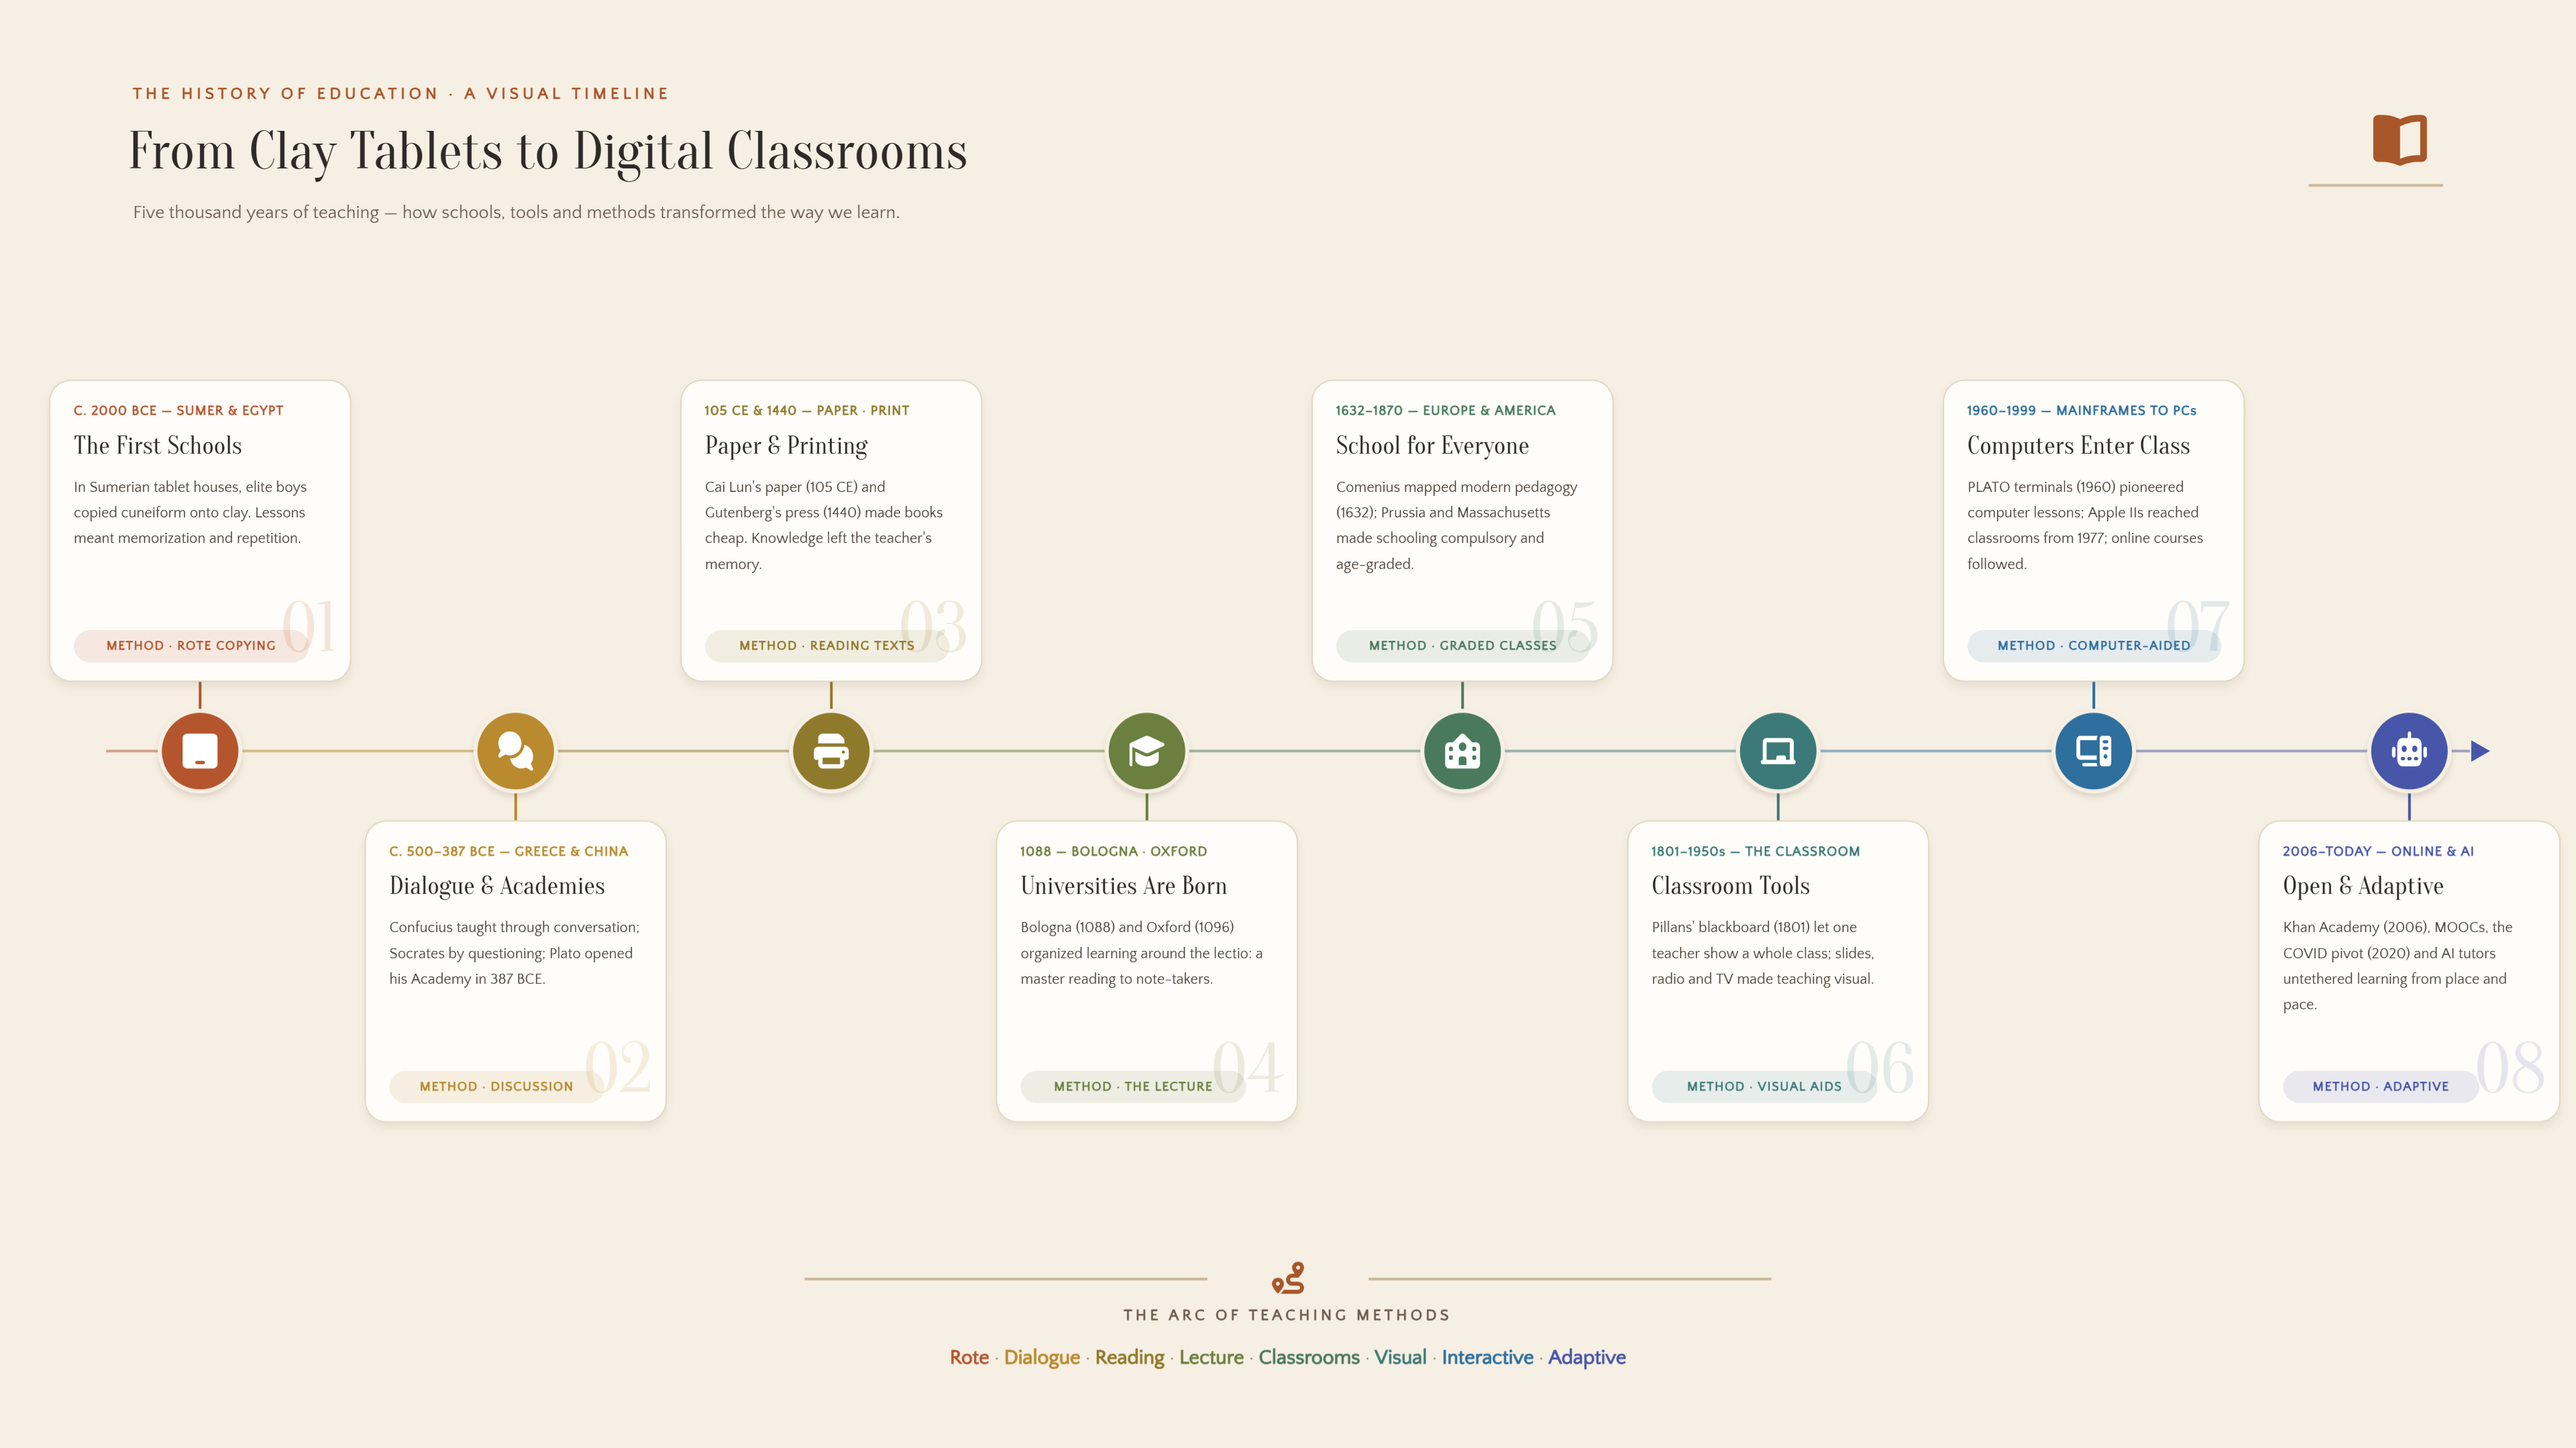
Education timeline infographic
From traditional classrooms to digital learning, education has gone through many changes. An education timeline traces this journey by placing major developments in chronological order. Key dates and learning milestones highlight how teaching methods have evolved across different periods. Readers can use this visual guide to explore important stages in the history of education.
Prompt:
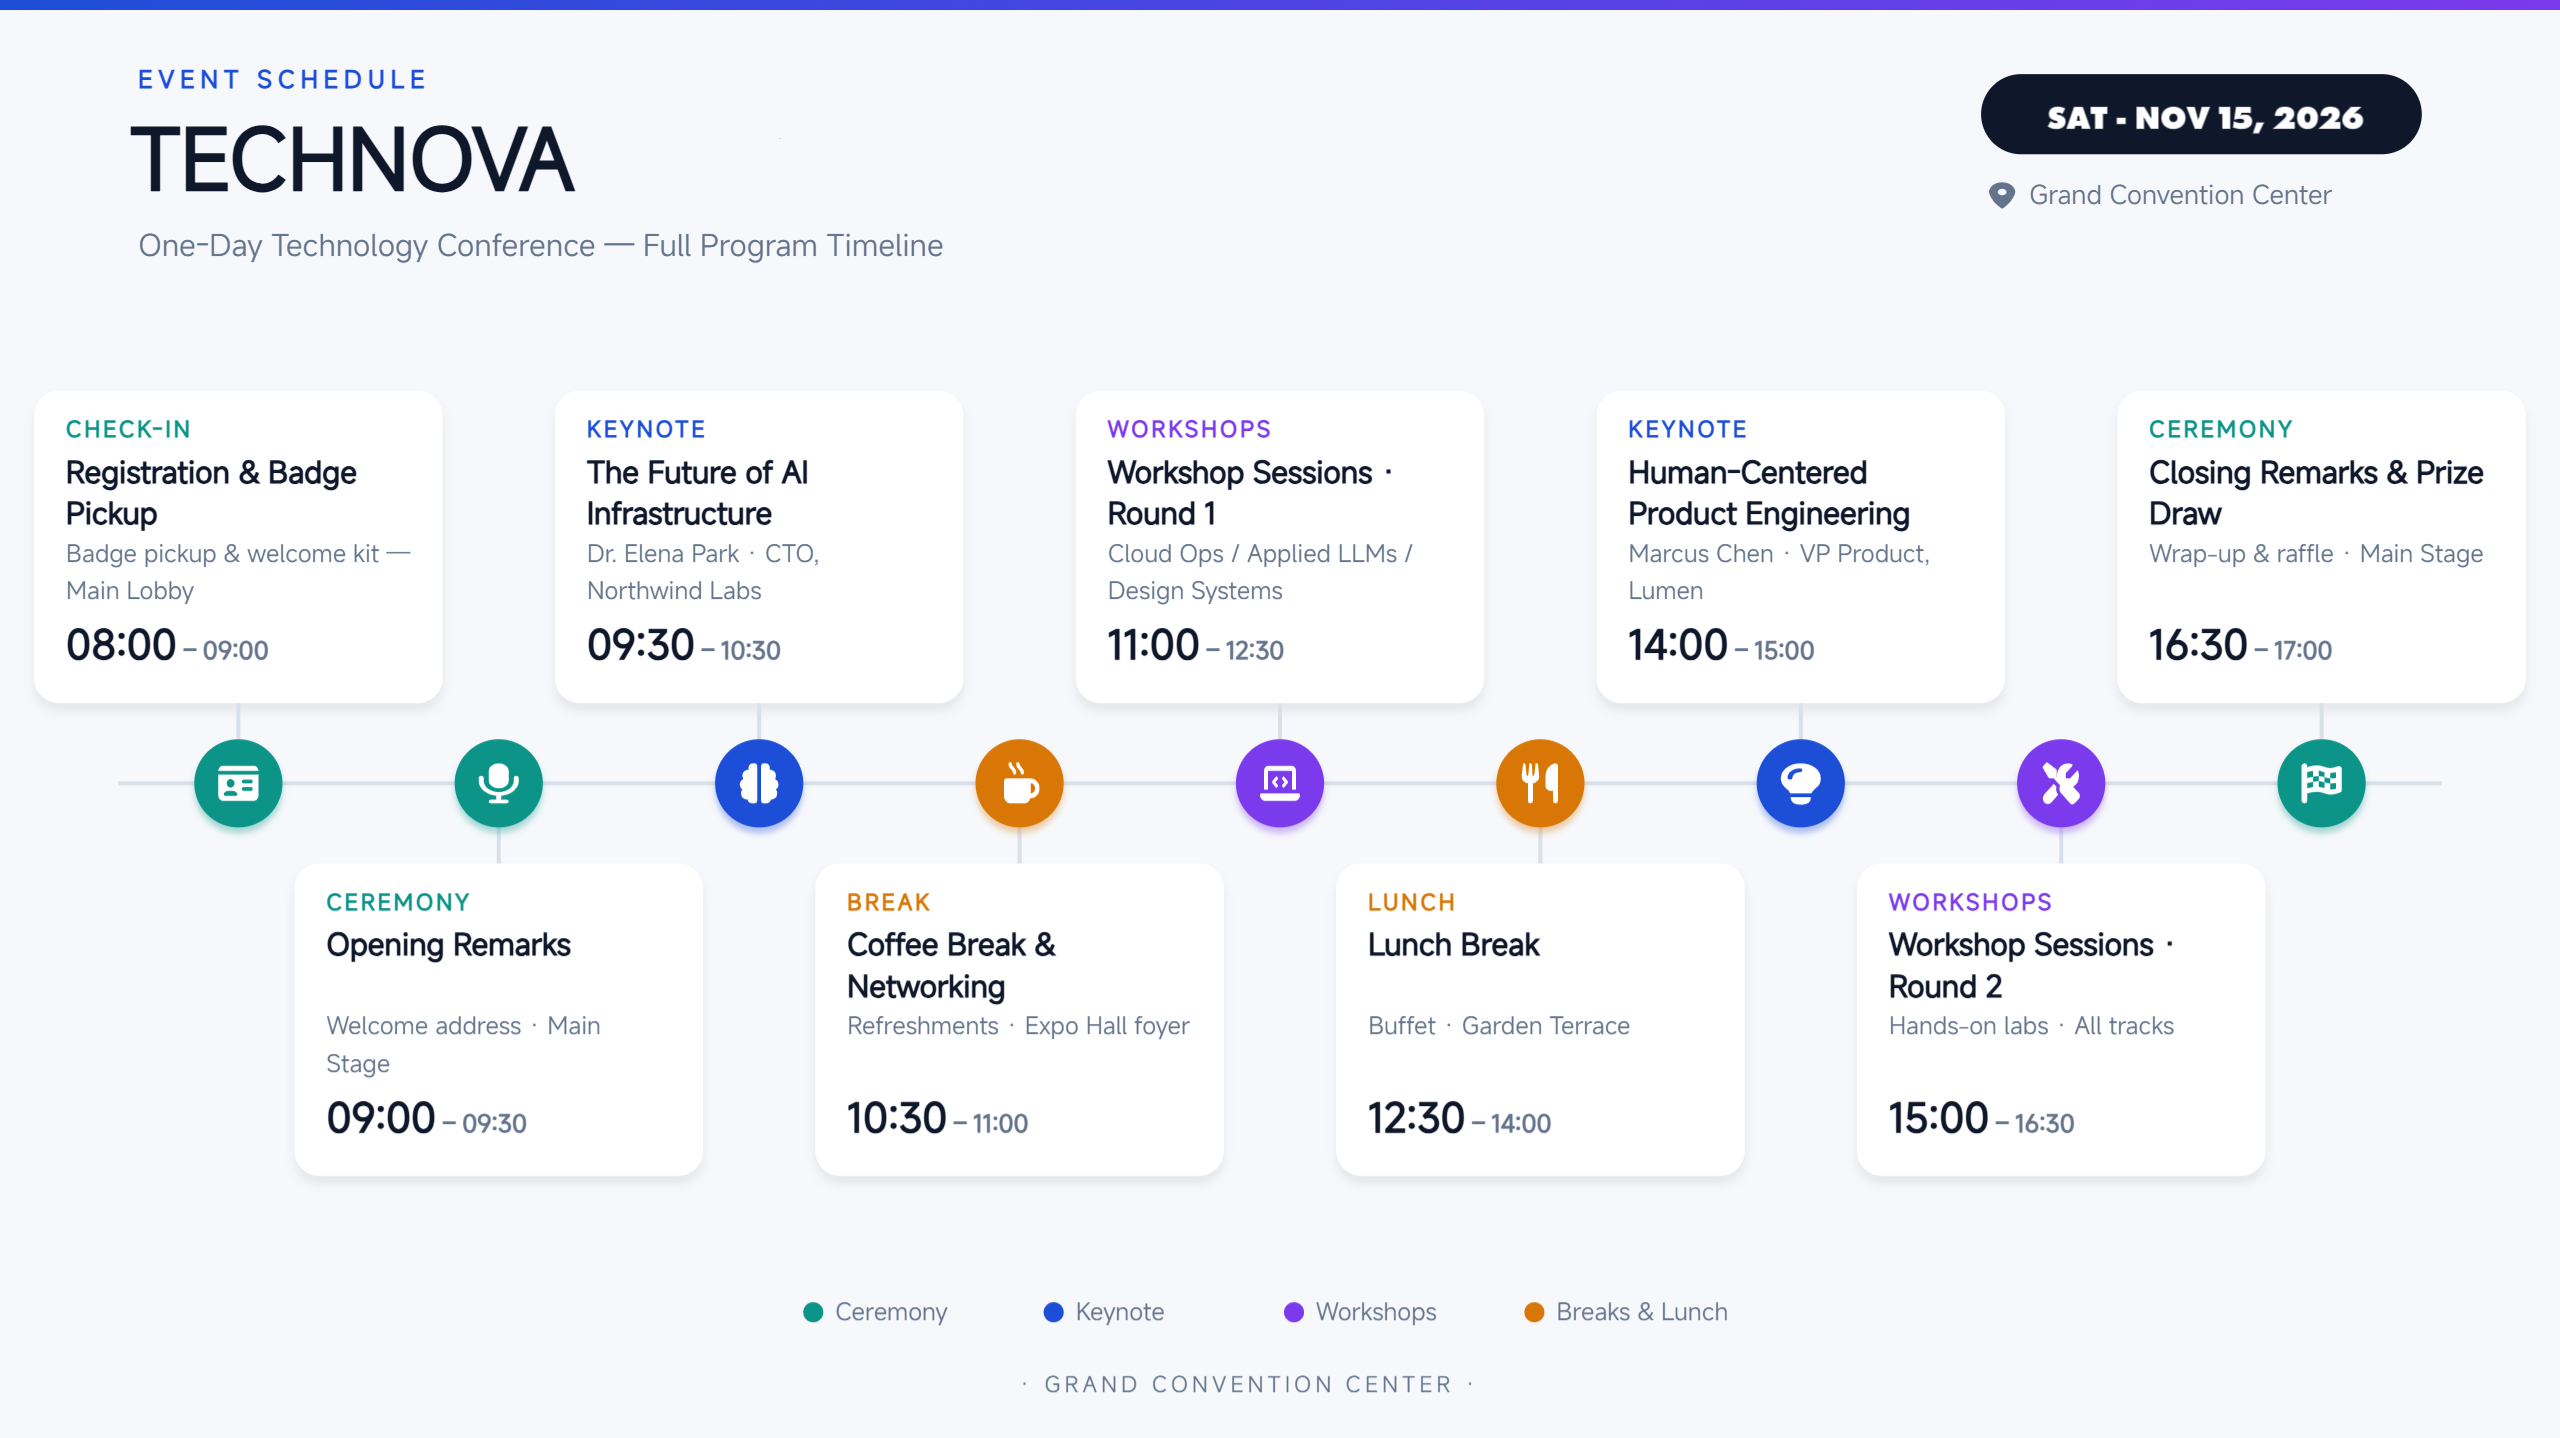
Event timeline infographic
Planning an event involves many activities that need to happen at the right time. An event timeline arranges schedules, tasks, and key milestones in chronological order. Time labels, short notes, and visual markers show what happens at each stage. Organizers can use this format to keep activities on schedule and ensure everyone knows what comes next.
Prompt:
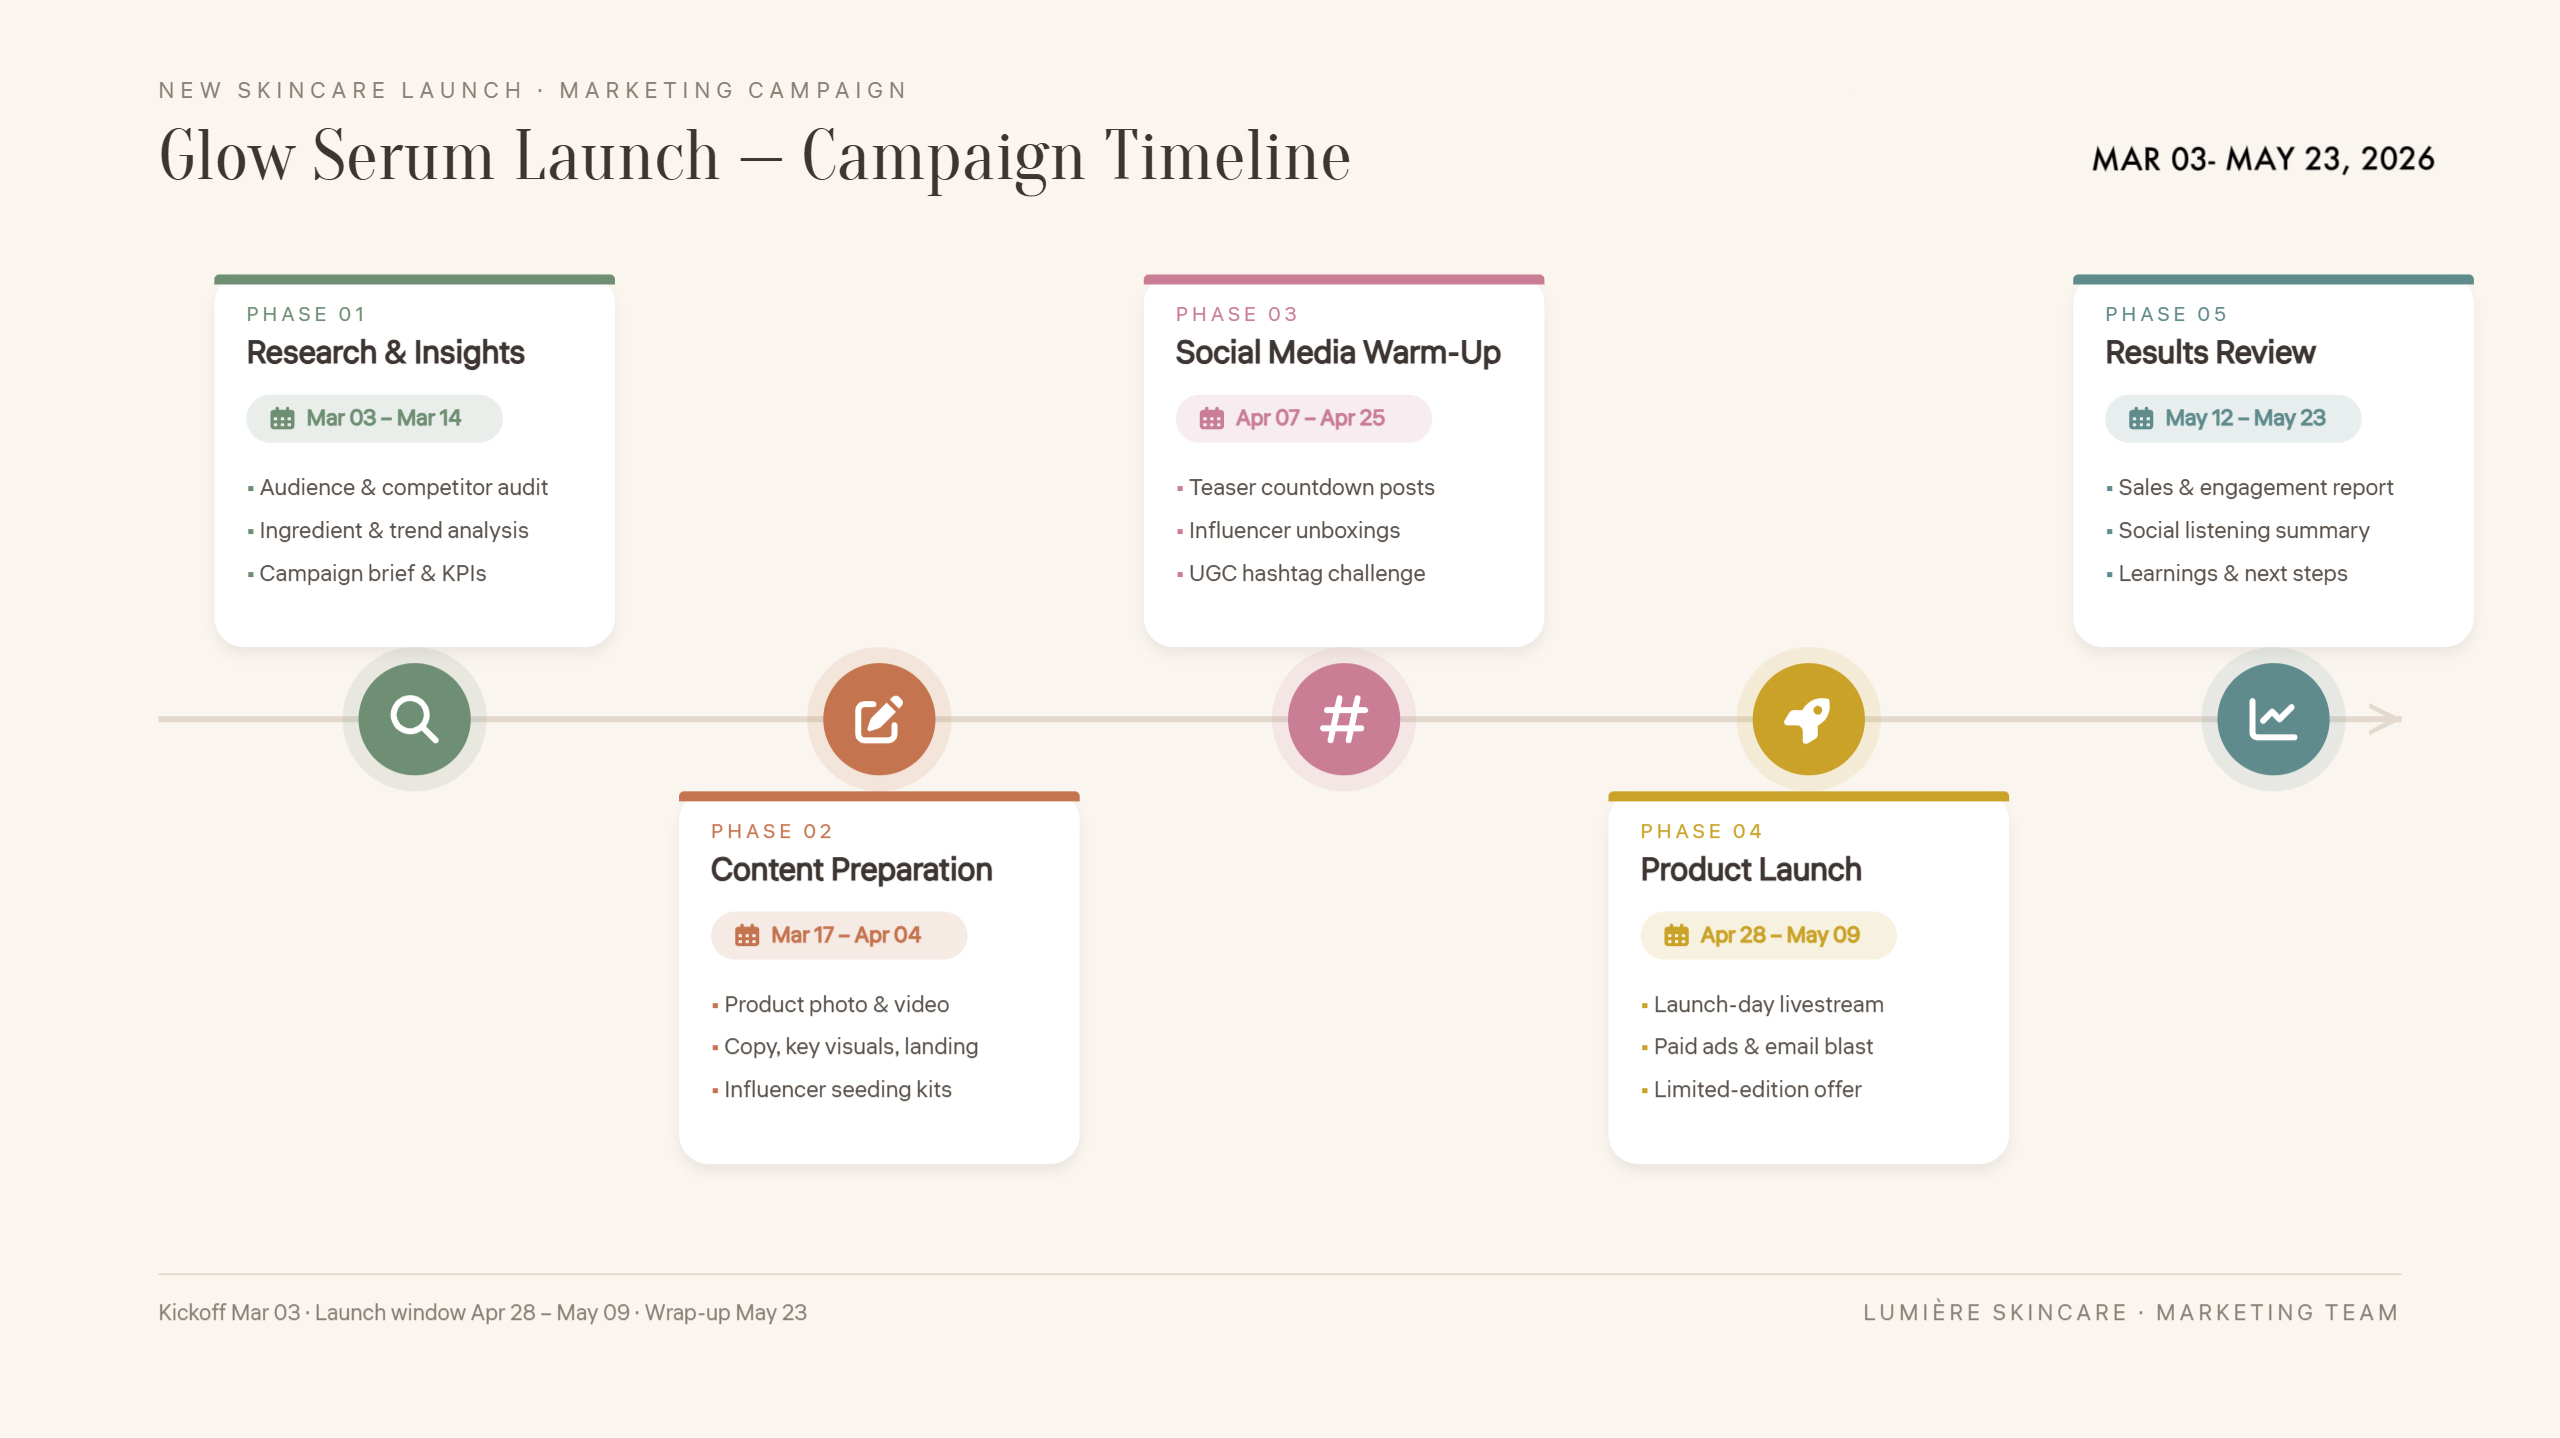
Marketing campaign timeline infographic
A marketing campaign involves several steps, from planning content to promoting a product or service. A marketing campaign timeline puts each task in order and shows when it should happen. Launch dates, content deadlines, and key milestones help teams manage their work. With all stages shown in one place, marketers can coordinate tasks and keep the campaign moving forward.
Prompt:
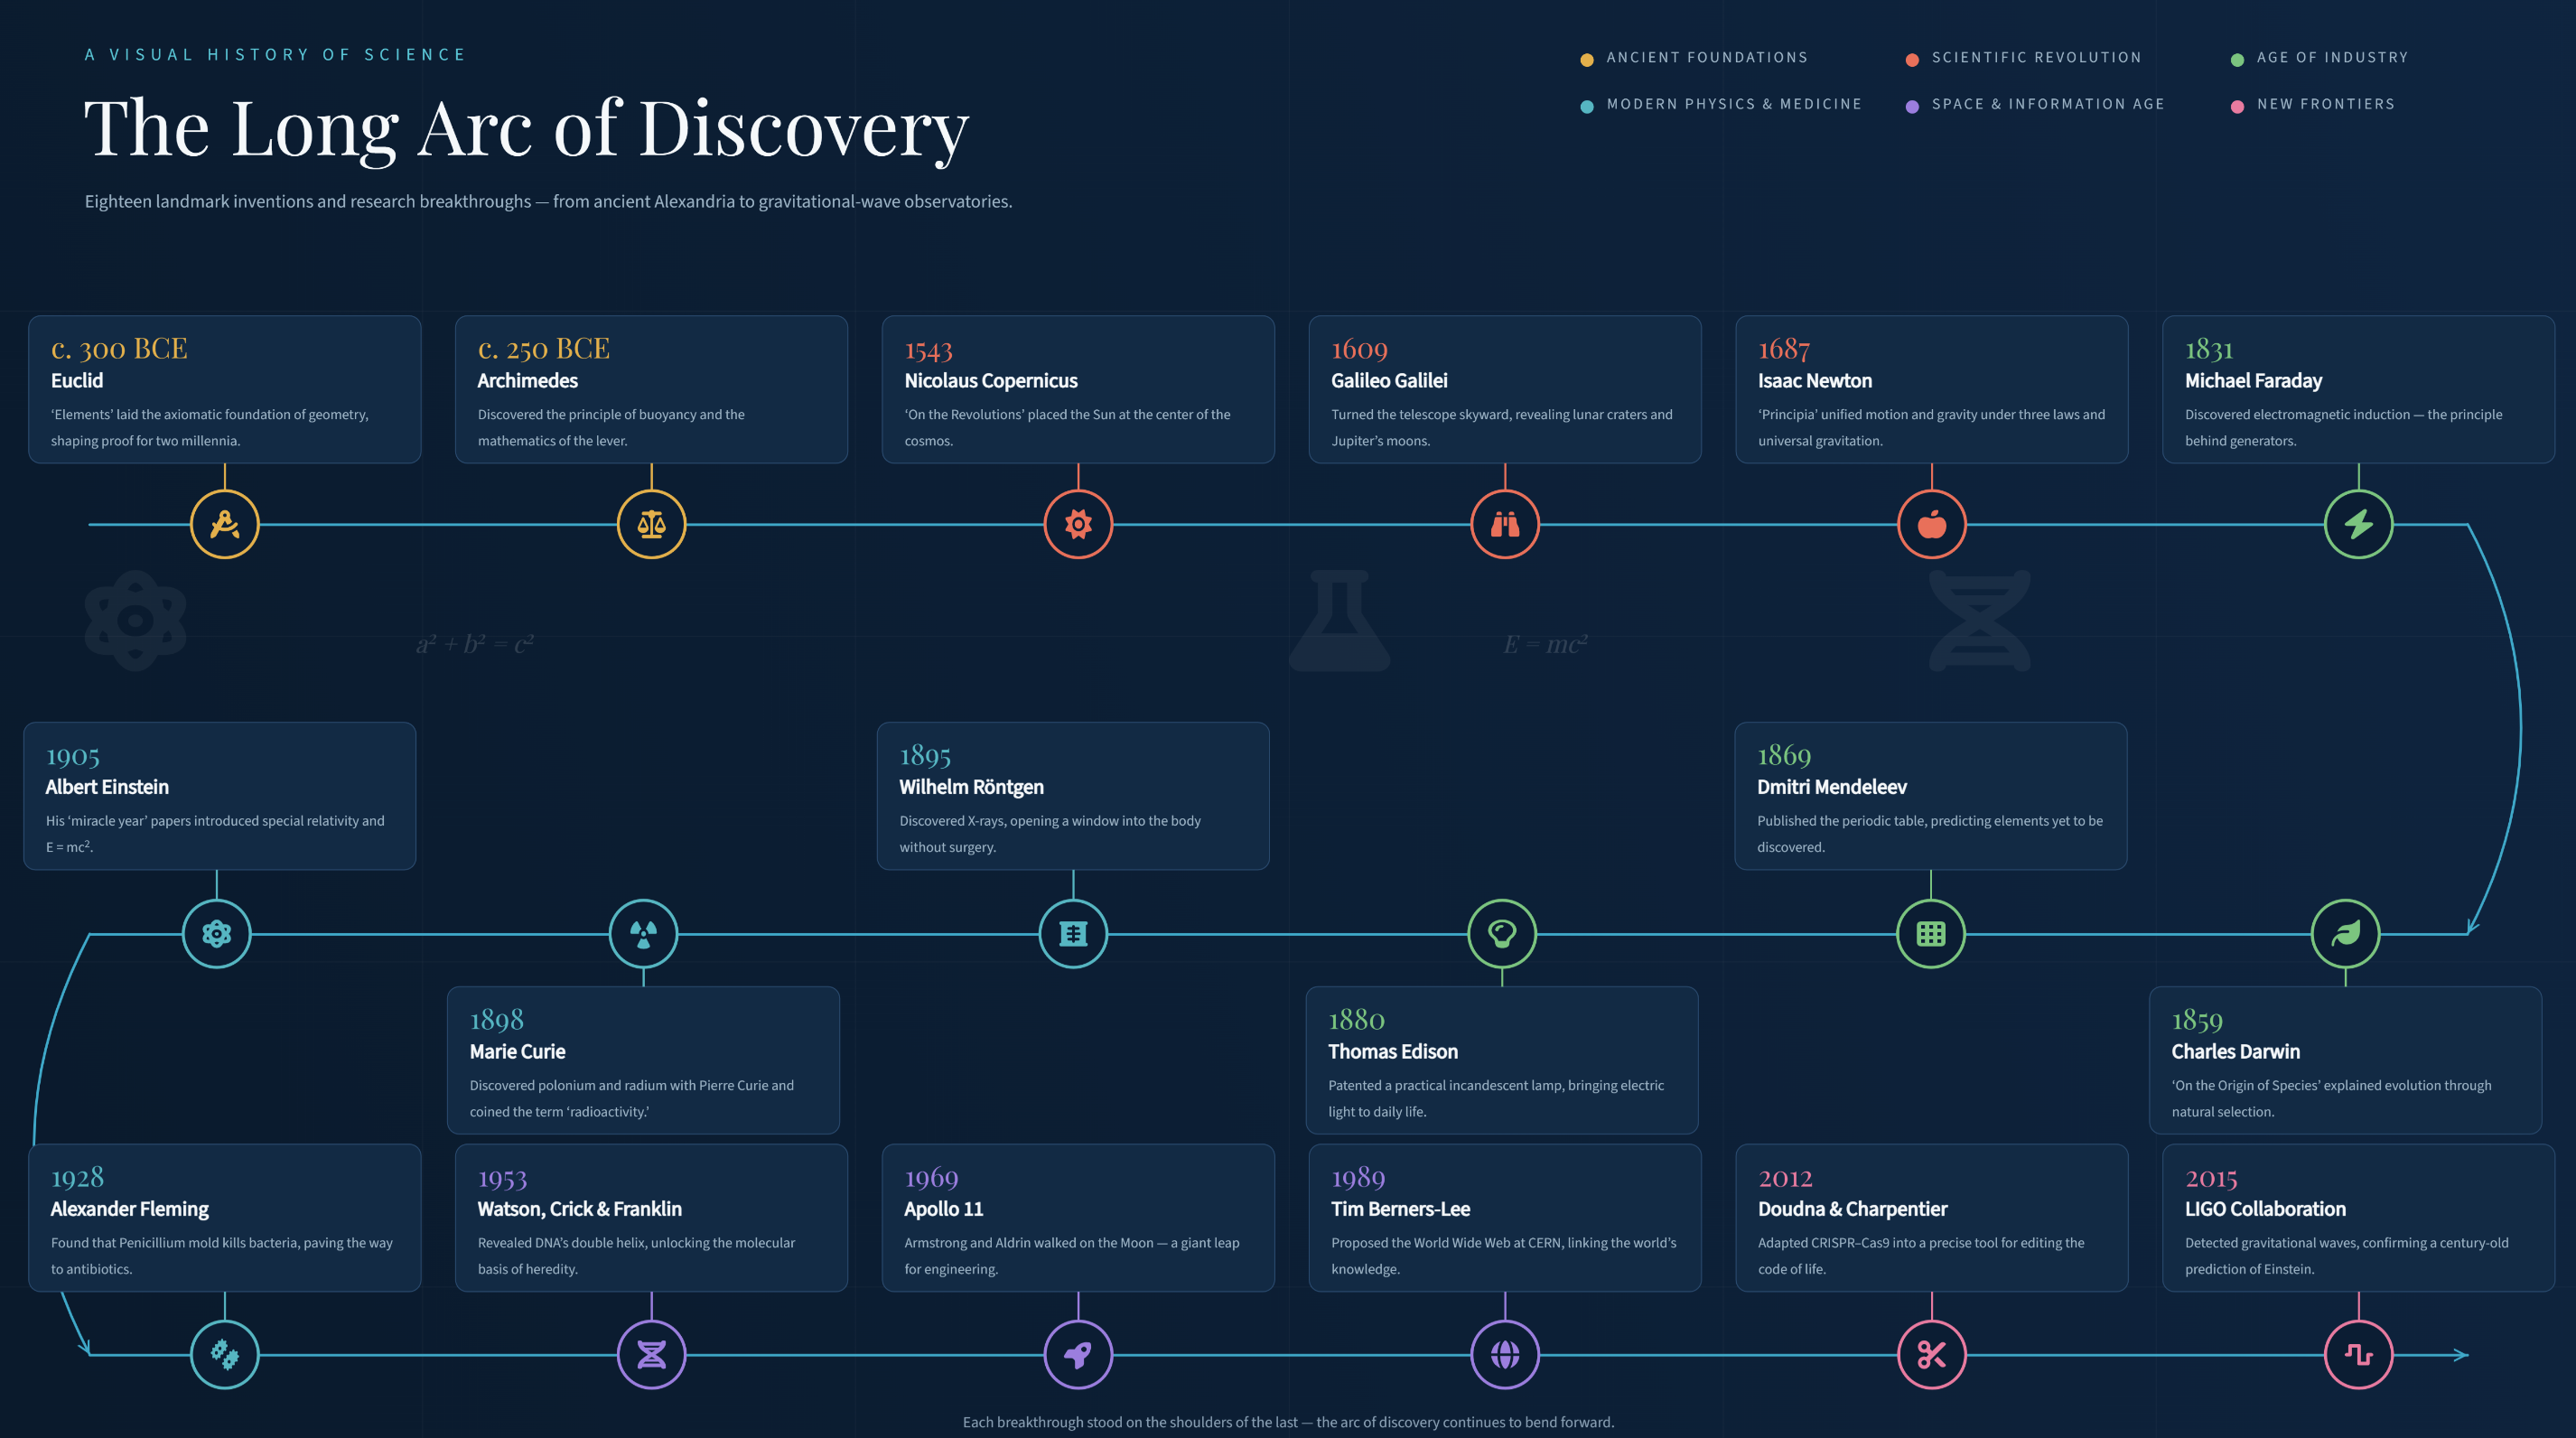
Scientific discovery timeline infographic
Scientific discoveries have shaped our understanding of the world and changed how people live. A scientific discovery timeline brings together major breakthroughs in fields such as biology, physics, chemistry, and astronomy. Dates, scientists' names, and brief descriptions show when important findings were made. This approach makes the history of science easier to explore and understand.
Prompt:
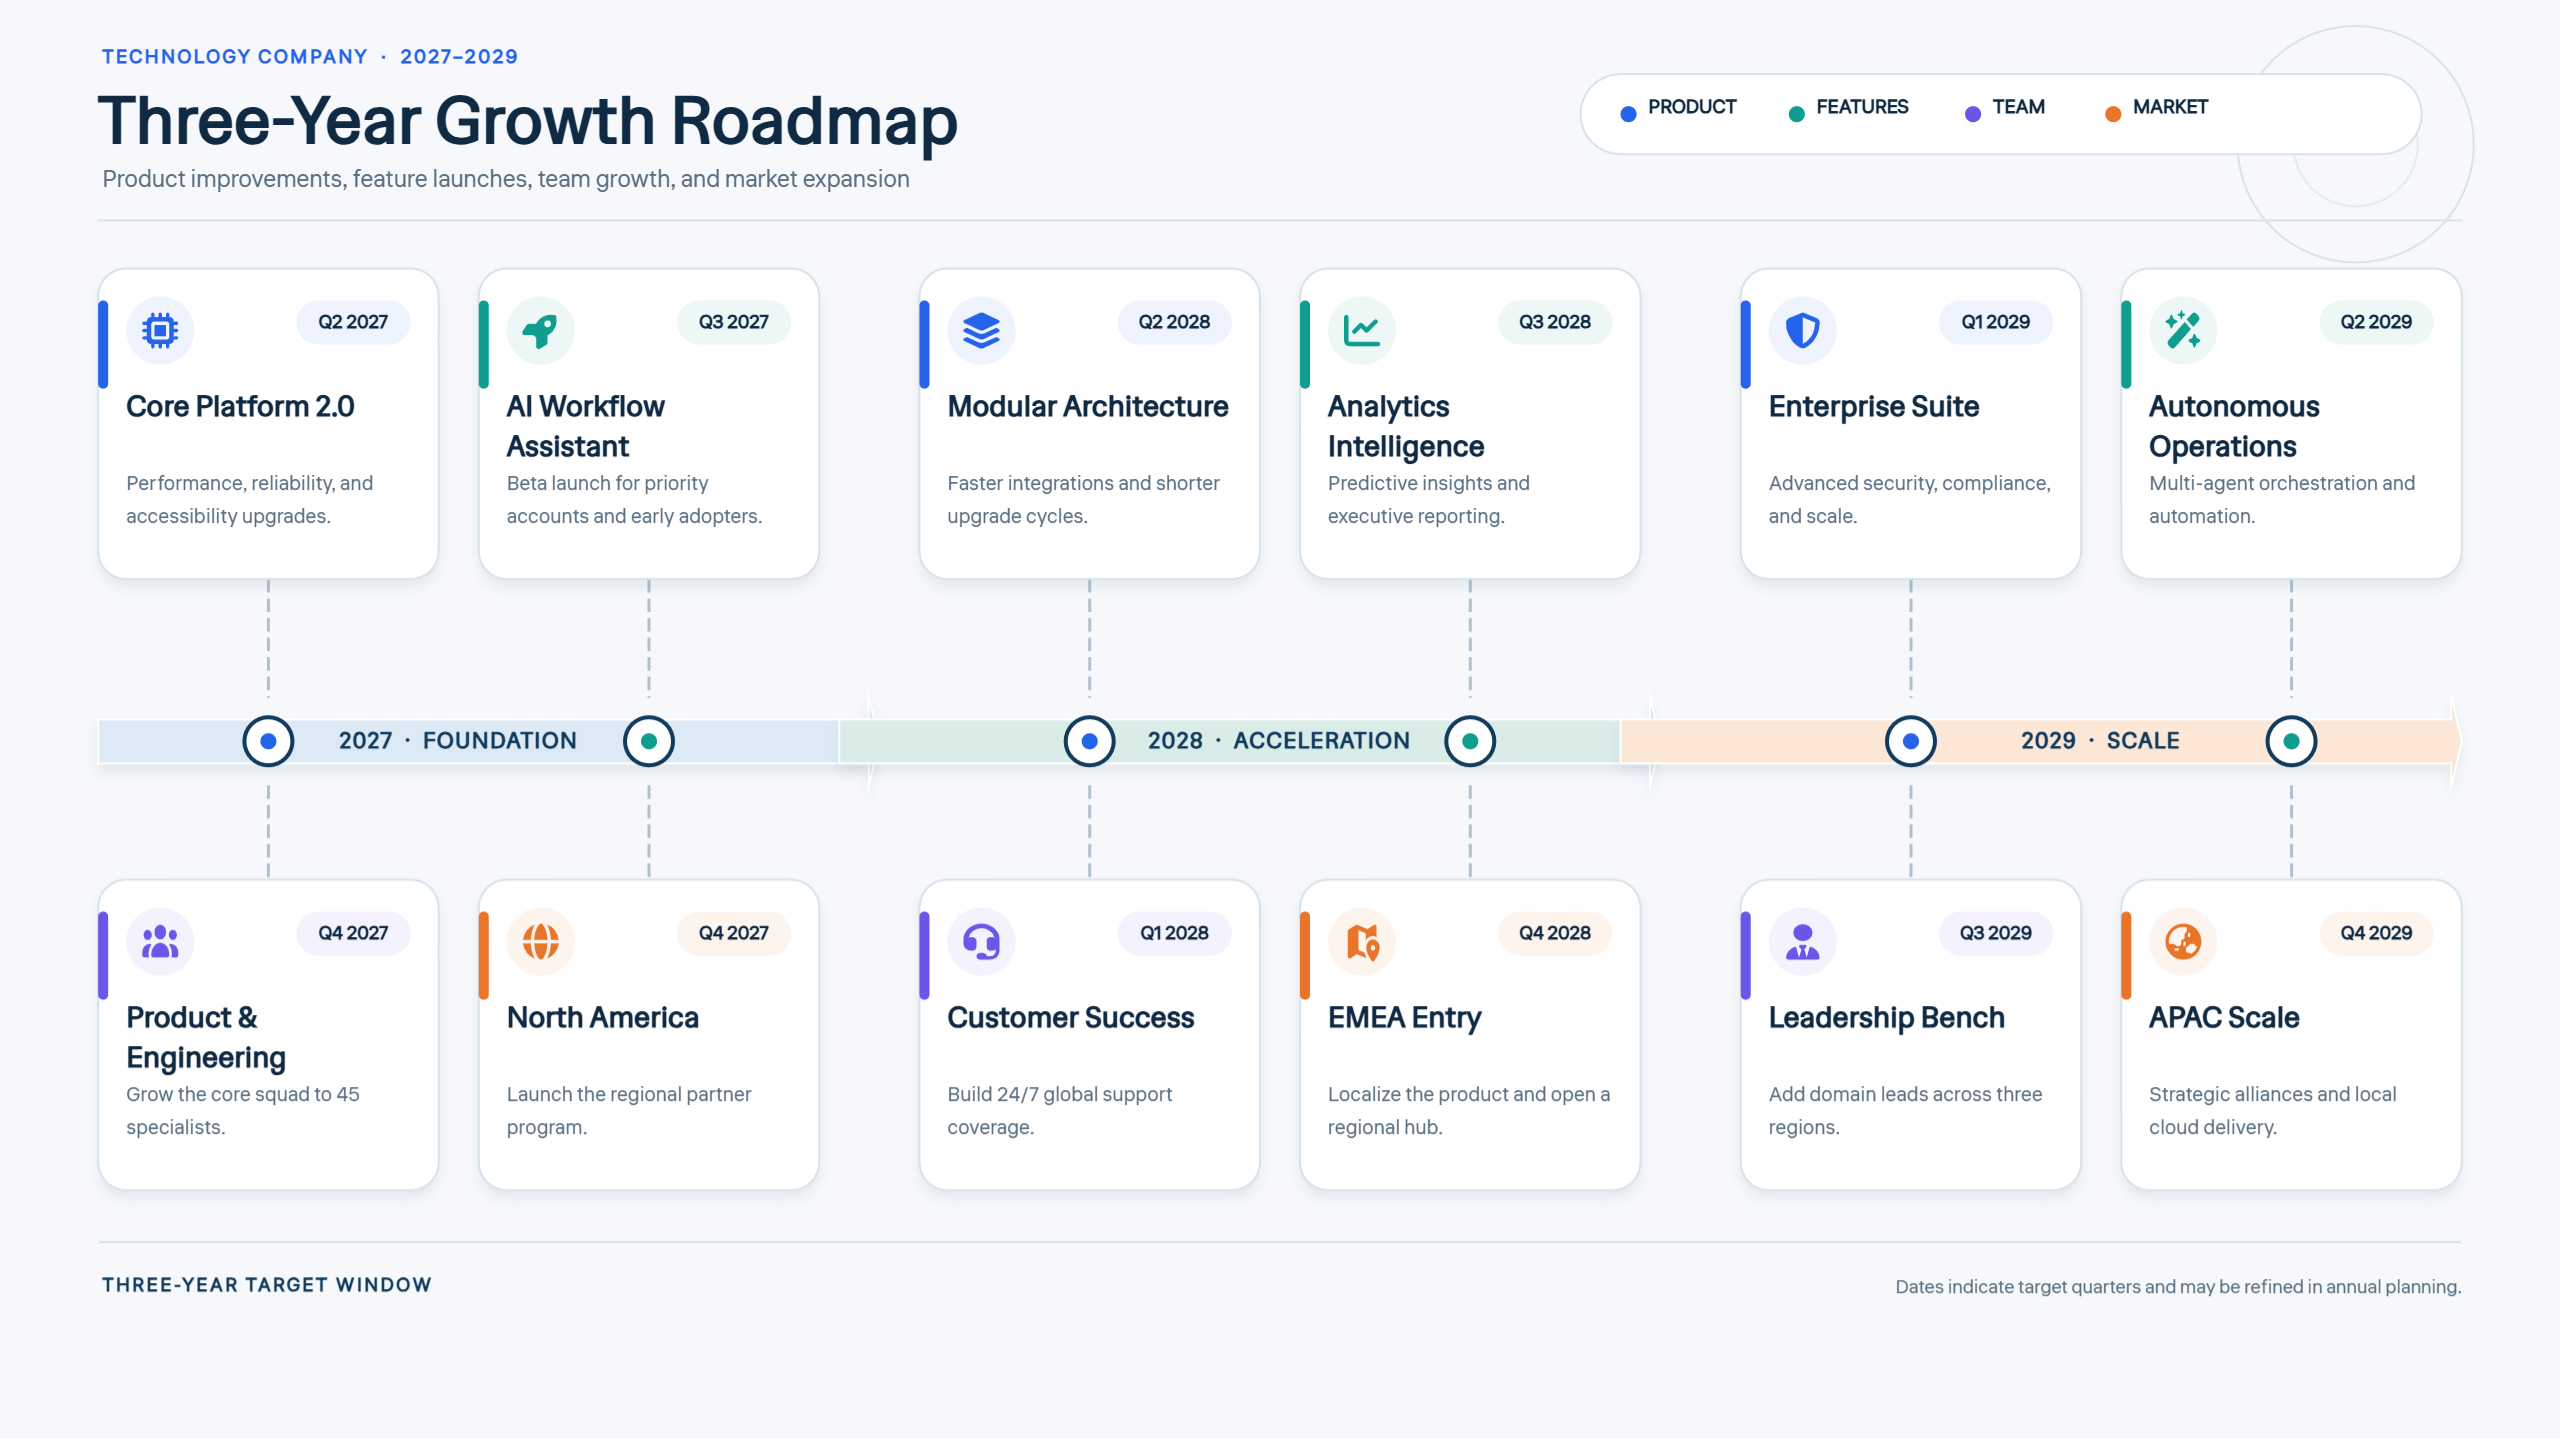
Future roadmap timeline infographic
Organizations can use a future roadmap timeline to turn long-term plans into practical steps. Target dates, key milestones, and progress markers highlight what needs to happen at each stage. From upcoming product launches to future business goals, the graphic presents priorities in a clear sequence. By showing the path ahead, it makes planning and decision-making easier.
Prompt:
What makes Kimi Design useful for timeline infographics
Whether presenting historical events, project stages, or business goals, Kimi Design can turn information into a timeline without hours of manual work. It makes it easier to create designs with dates, milestones, and visual elements. Here are the key benefits of using Kimi Design for timelines.
Create timeline infographics from prompts and references
Describe your timeline idea, key dates, milestones, and events in a text prompt, or upload reference images and source materials. Kimi Design turns your input into an organized visual timeline, helping present chronological information in a clear, easy-to-follow format.
Explore timeline styles for different stories
Design timelines for project roadmaps, company histories, product launches, historical events, and personal milestones. Adjust layouts, colors, typography, and visual elements to fit your topic, from professional business timelines to educational visuals.
Edit timeline elements with natural-language prompts
Use chat prompts to revise text, change colors, or adjust the layout. Kimi Design also supports comments on specific design elements and manual editing, giving you flexible ways to refine dates, milestones, and visual details.
Export timelines for multiple uses
Export your finished timeline as PNG, JPG, PDF, or PPTX. Add it to presentations, reports, educational materials, websites, or social media posts, with editable elements that make future updates easier.
Tips for designing effective timeline infographics
Designing an effective timeline infographic starts with arranging information in a clear and logical order. A good design highlights key dates and milestones while making each stage easy to follow. Below are some useful tips for creating an informative and visually appealing timeline.
Choose a clear chronological structure
Arrange events in the order they happened or are planned to happen. A timeline infographic can move from left to right, top to bottom, or follow a curved path. Choose a direction that fits the number of events and the sequence you want to communicate.
Highlight key milestones
Give important events more attention so readers can spot them quickly. Use bold labels, distinct icons, or larger markers to show major changes and achievements. Keep less important details smaller to avoid distractions from the main points.
Keep text concise and establish a clear hierarchy
Use short phrases to describe each event, with readable text sizes and a clear distinction between headings, dates, and supporting details. Make the main title prominent and keep descriptions brief. Leave enough space between milestones to prevent text and visual elements from overlapping, especially when some events require longer explanations.
Use consistent, relevant visuals
Choose colors, fonts, icons, and images that match the topic and maintain a consistent style throughout the timeline. Select visuals that relate directly to each event, such as a graduation cap for an academic milestone or a chart for business growth. Relevant imagery reinforces meaning, while a unified visual style keeps the design cohesive and easy to follow.
Connect visuals to each event
Choose images and icons that match the events they represent. For example, a graduation cap can mark academic achievement, while a chart can show business growth. Relevant visuals add meaning and help readers understand each milestone more quickly.
Match the layout to the content
Choose a timeline layout that suits the type and amount of information you want to present. A horizontal timeline may work well for a short company history, while a vertical format can accommodate a longer series of events. Adjust the spacing between milestones according to the length of each description, ensuring dates, markers, and text remain clearly separated and easy to read.
Check accuracy and readability before sharing
Review every date, name, label, and description to make sure the information is correct. Check the design on different screen sizes or print a copy to spot text that is too small or unclear. Fix any mistakes before sharing the final timeline infographic with your audience.
Conclusion
From project schedules to historical events, timeline infographics can take many forms depending on your goals and the information you want to present. With Kimi Design, you can create any of these timeline styles by describing your requirements promptly. Include the key dates, milestones, preferred layout, color scheme, and visual elements you need, and let Kimi Design turn your ideas into a tailored timeline infographic.