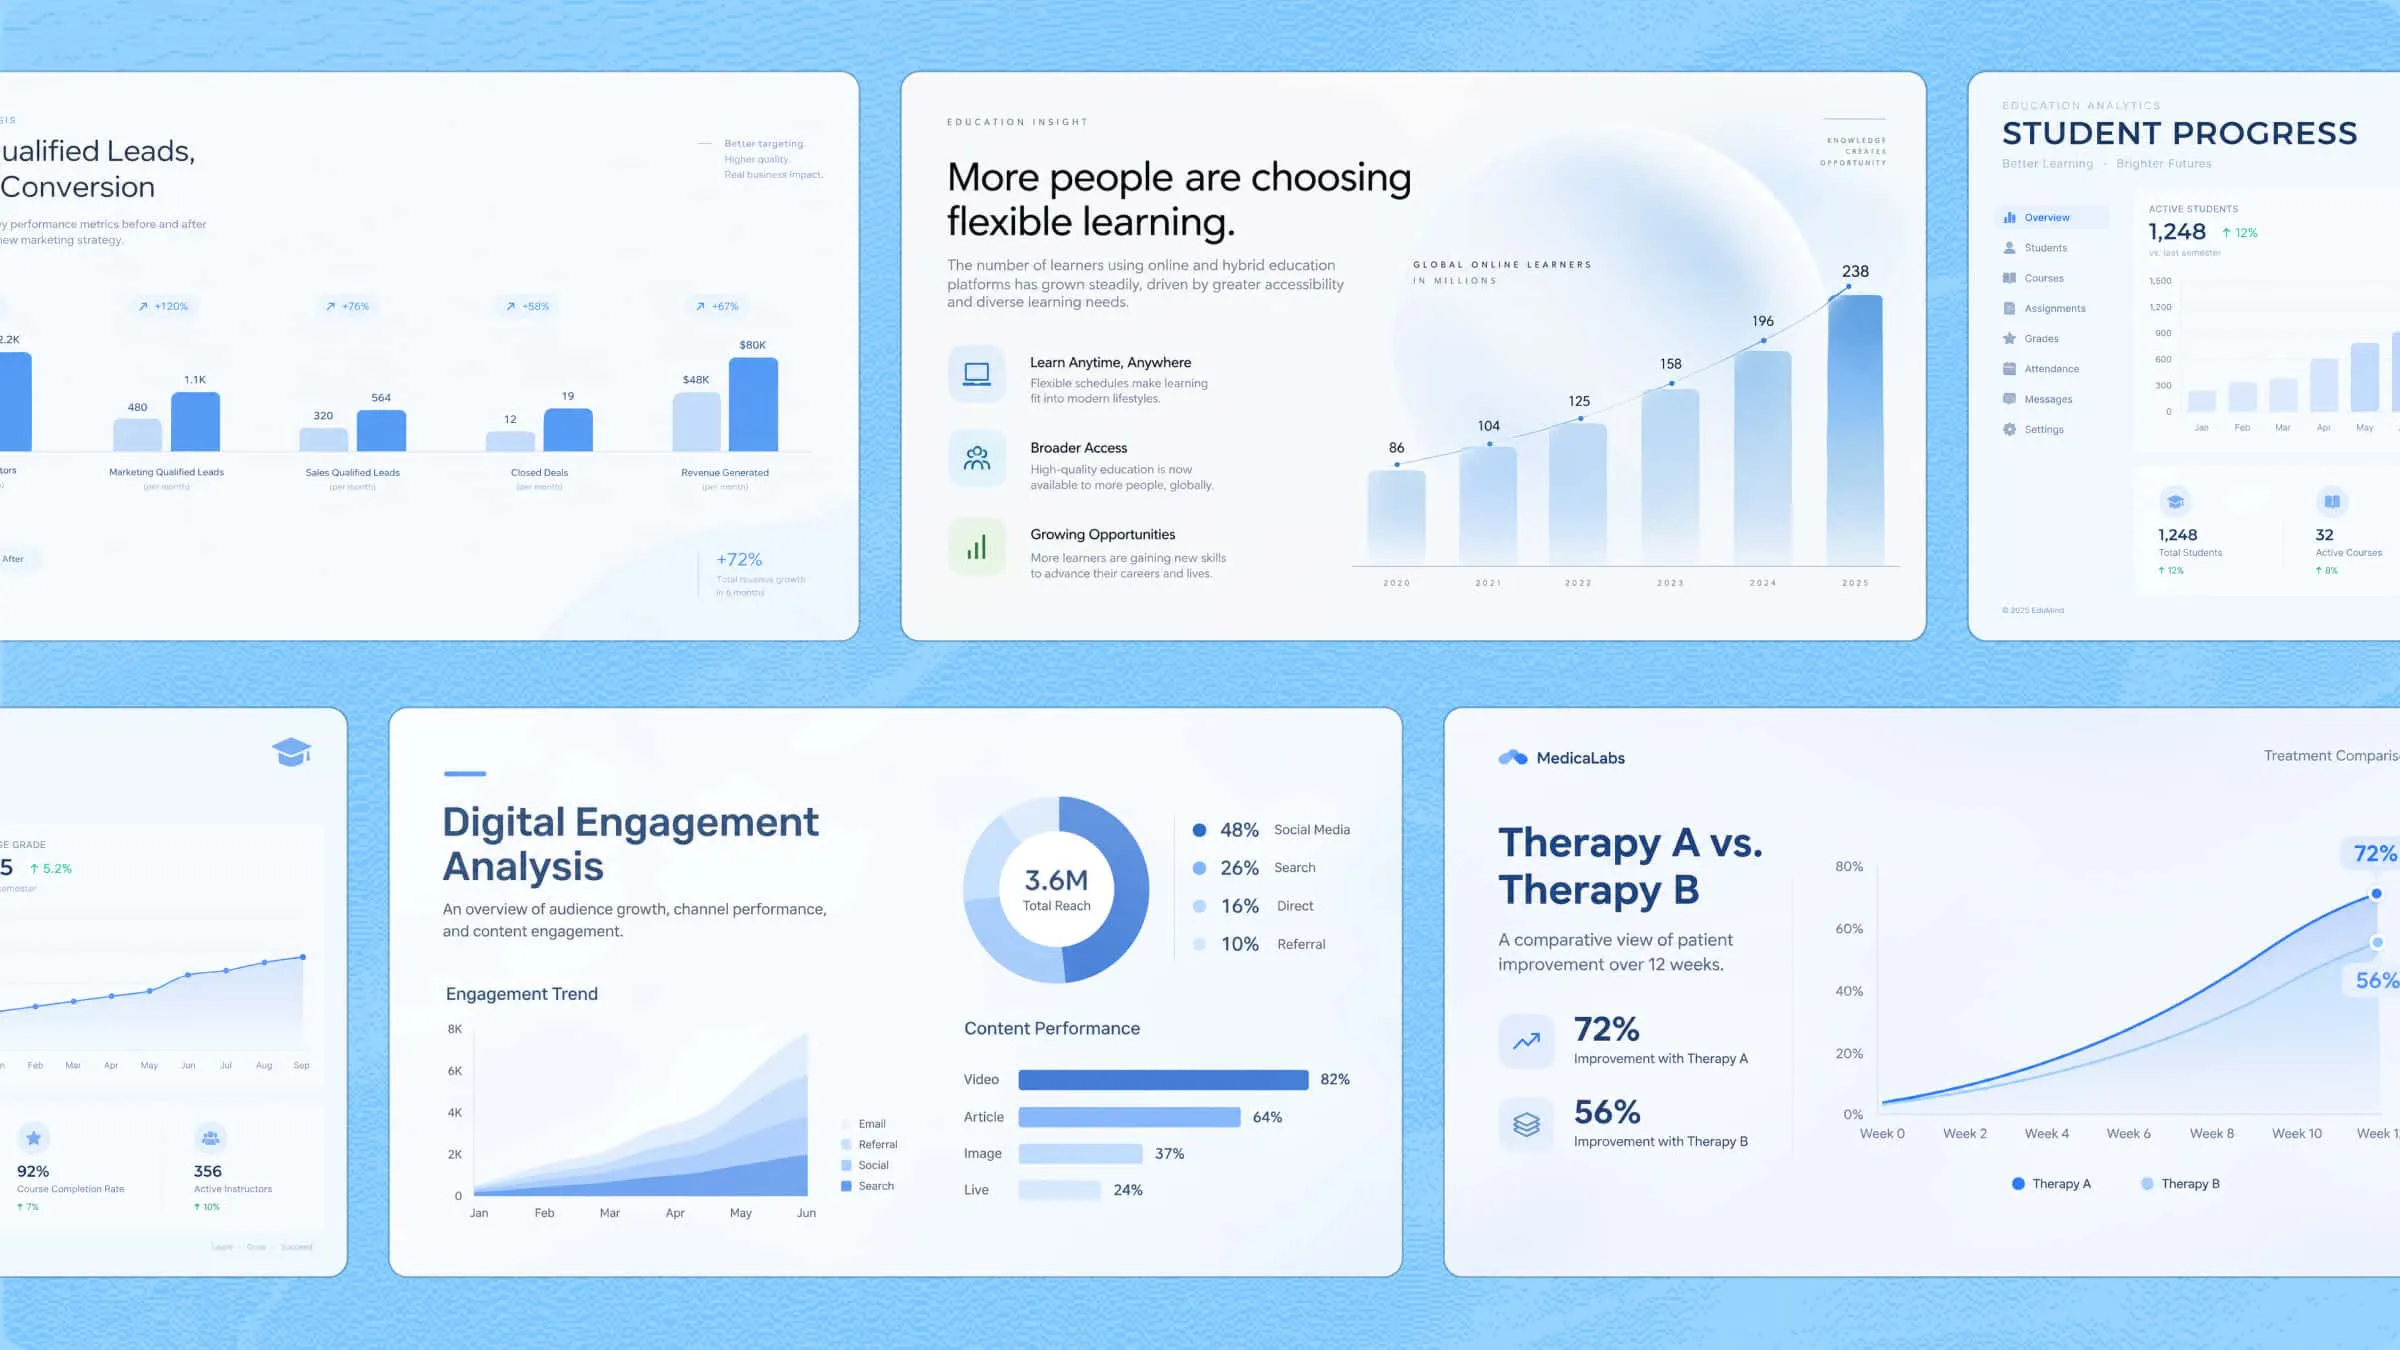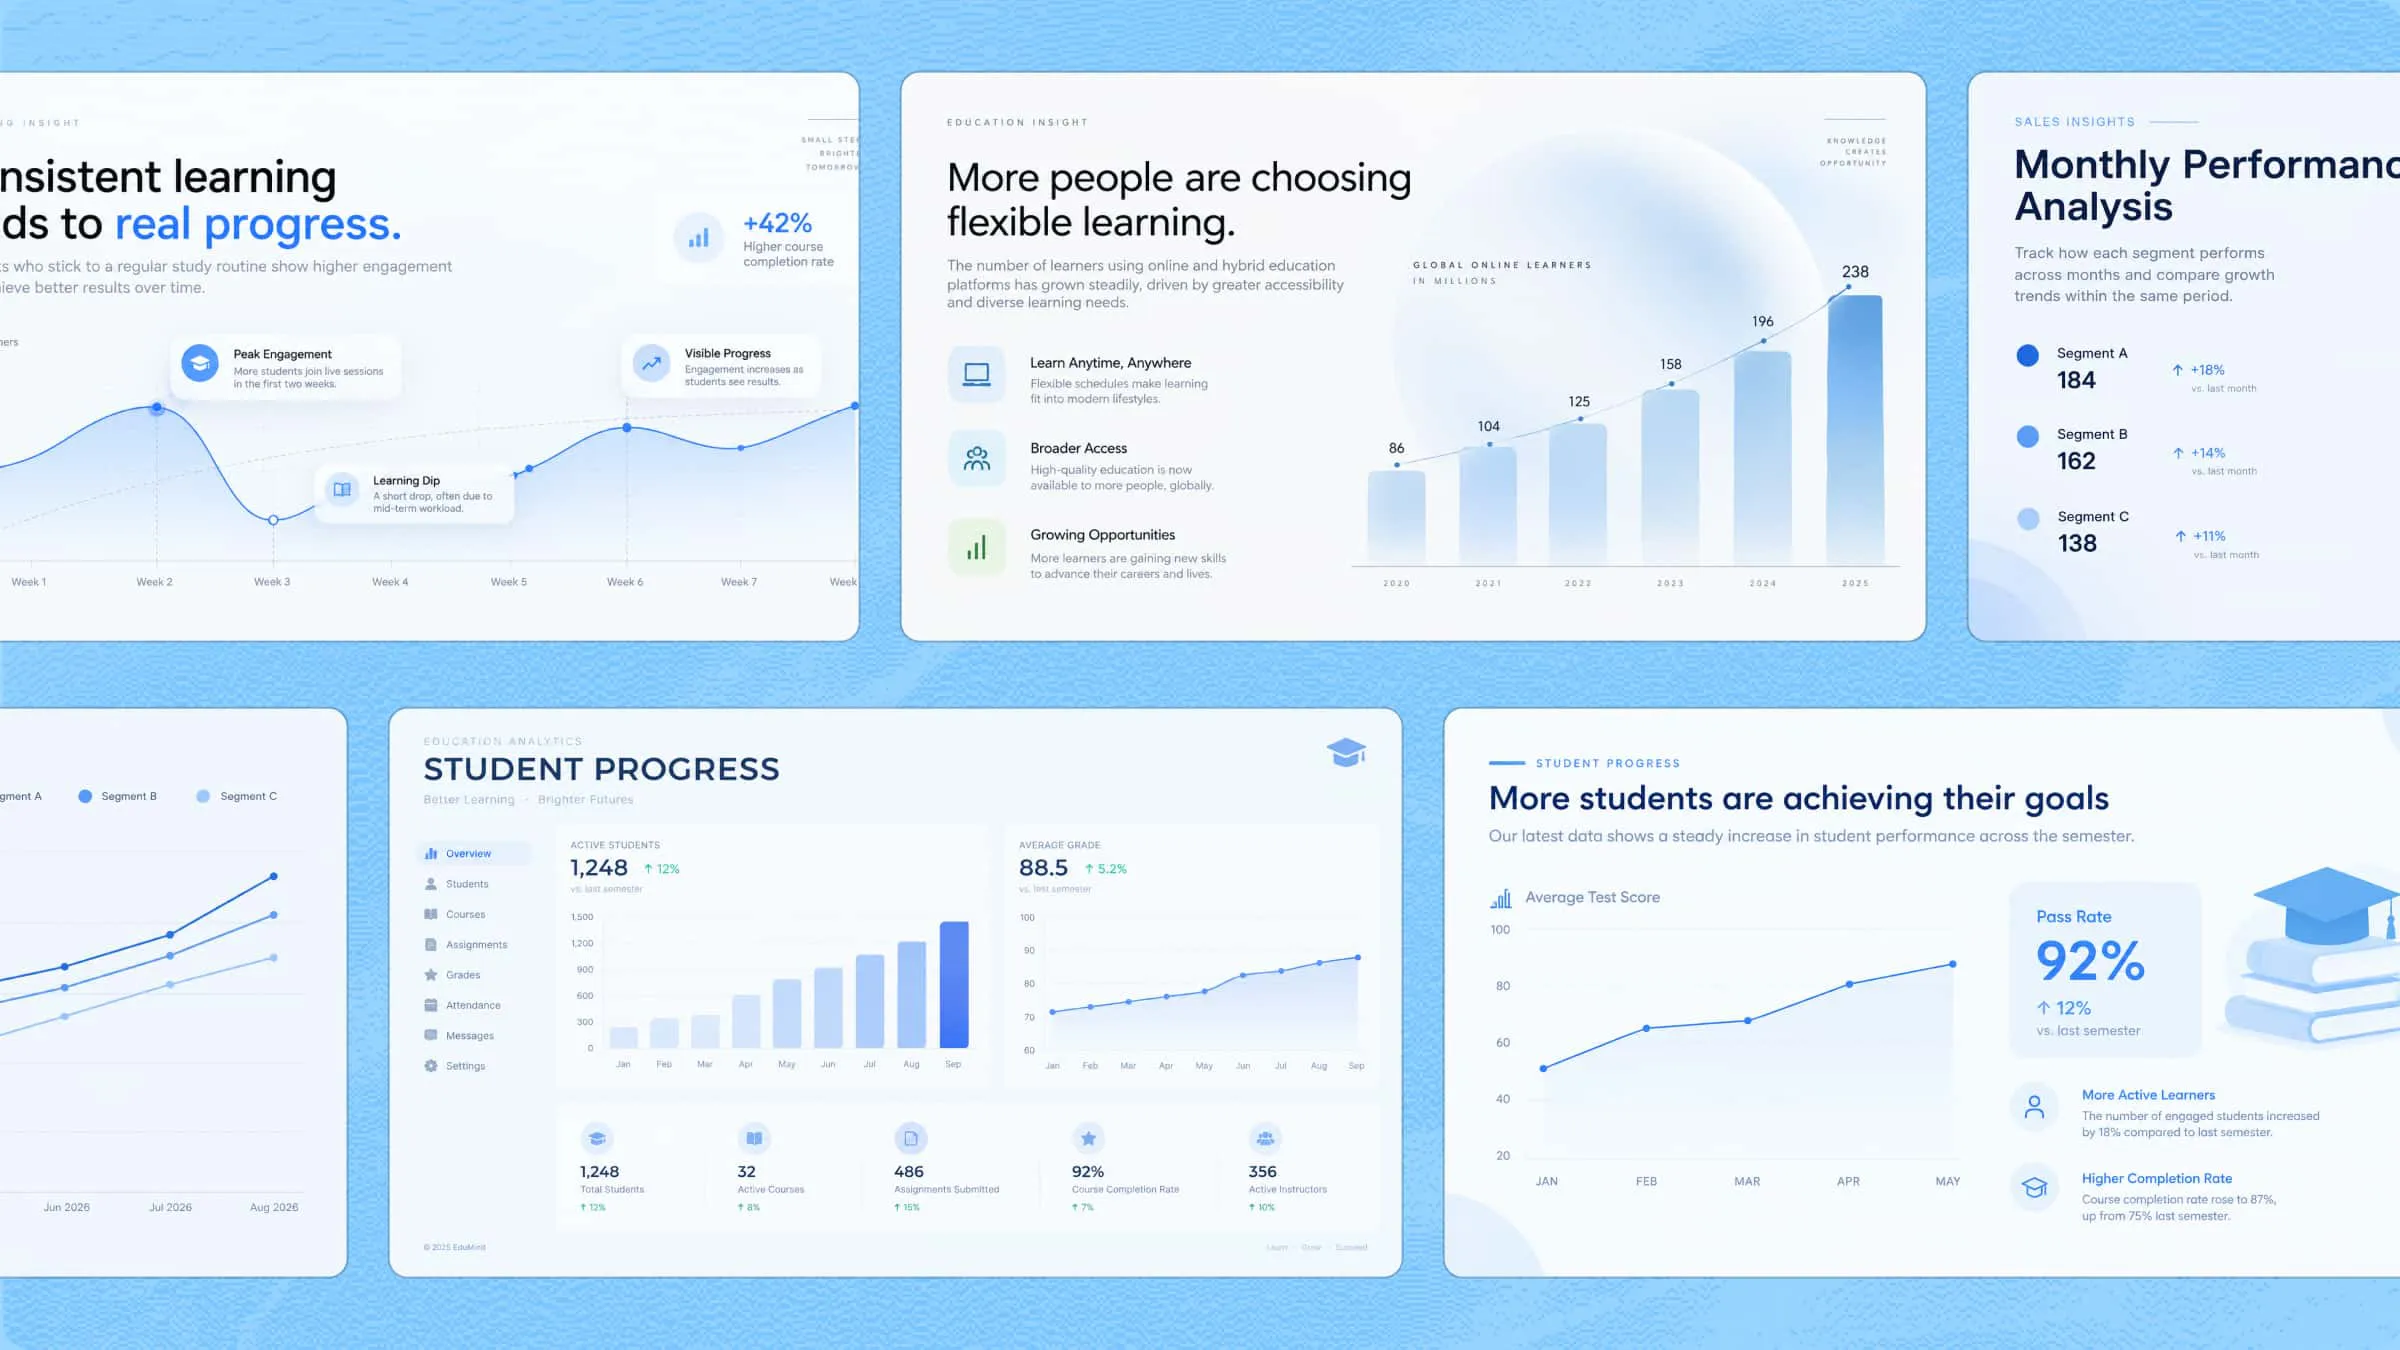
Complex ideas, detailed facts, and lengthy explanations can be hard to work with. A well-designed infographic helps solve this problem by combining concise text, relevant visuals, and a clear layout. This guide explores 10 educational infographic examples to inspire your next design and help you create learning materials suited to different subjects and classroom needs.
Overview of 10 educational infographics
Before exploring the examples, review the table below for an overview of 10 educational infographic types, their main purposes, and intended audiences. Use it to find examples that align with your lesson topics and teaching needs.
| Infographic type | What it explains | Suitable for | Target audience |
|---|---|---|---|
| Learning Process Infographic | Steps for learning a new skill or topic | Breaking down complex lessons | Students and teachers |
| Science Infographic | Scientific facts, experiments, and natural events | Making science topics easier to understand | Science students and teachers |
| History Infographic | Key events, dates, and timelines | Teaching past events in order | History students and educators |
| Math Infographic | Formulas, rules, and problem-solving steps | Explaining calculations clearly | Math students and teachers |
| Language Learning Infographic | Grammar, vocabulary, and sentence structure | Building language skills | Language learners and instructors |
| Study Tips Infographic | Study methods and exam preparation advice | Developing better study habits | Students and exam candidates |
| Classroom Rules Infographic | Class expectations and daily routines | Encouraging good behavior | Teachers and school students |
| Anatomy Infographic | Body parts, organs, and their functions | Teaching basic human biology | Biology students and health educators |
| Environmental Education Infographic | Nature, pollution, and ways to protect the planet | Raising awareness of environmental issues | Students, teachers, and environmental groups |
| College Application Infographic | Admission steps, deadlines, and required documents | Making the application process easier to follow | High school students and college applicants |
Explore 10 educational infographic examples for inspiration
The right education infographic can turn a complex lesson into clear, easy-to-follow information. The 10 examples below cover different subjects and teaching needs, each with a ready-to-use prompt to help you get started. To create your own infographic with Kimi Design, an AI design generator, describe the topic, key information, and preferred visual style promptly. Review the generated design and refine it by updating your prompt, adding comments to specific elements, or making manual adjustments on the canvas. You can then export the infographic for classroom presentations, printed learning materials, or online sharing.
Learning process infographic
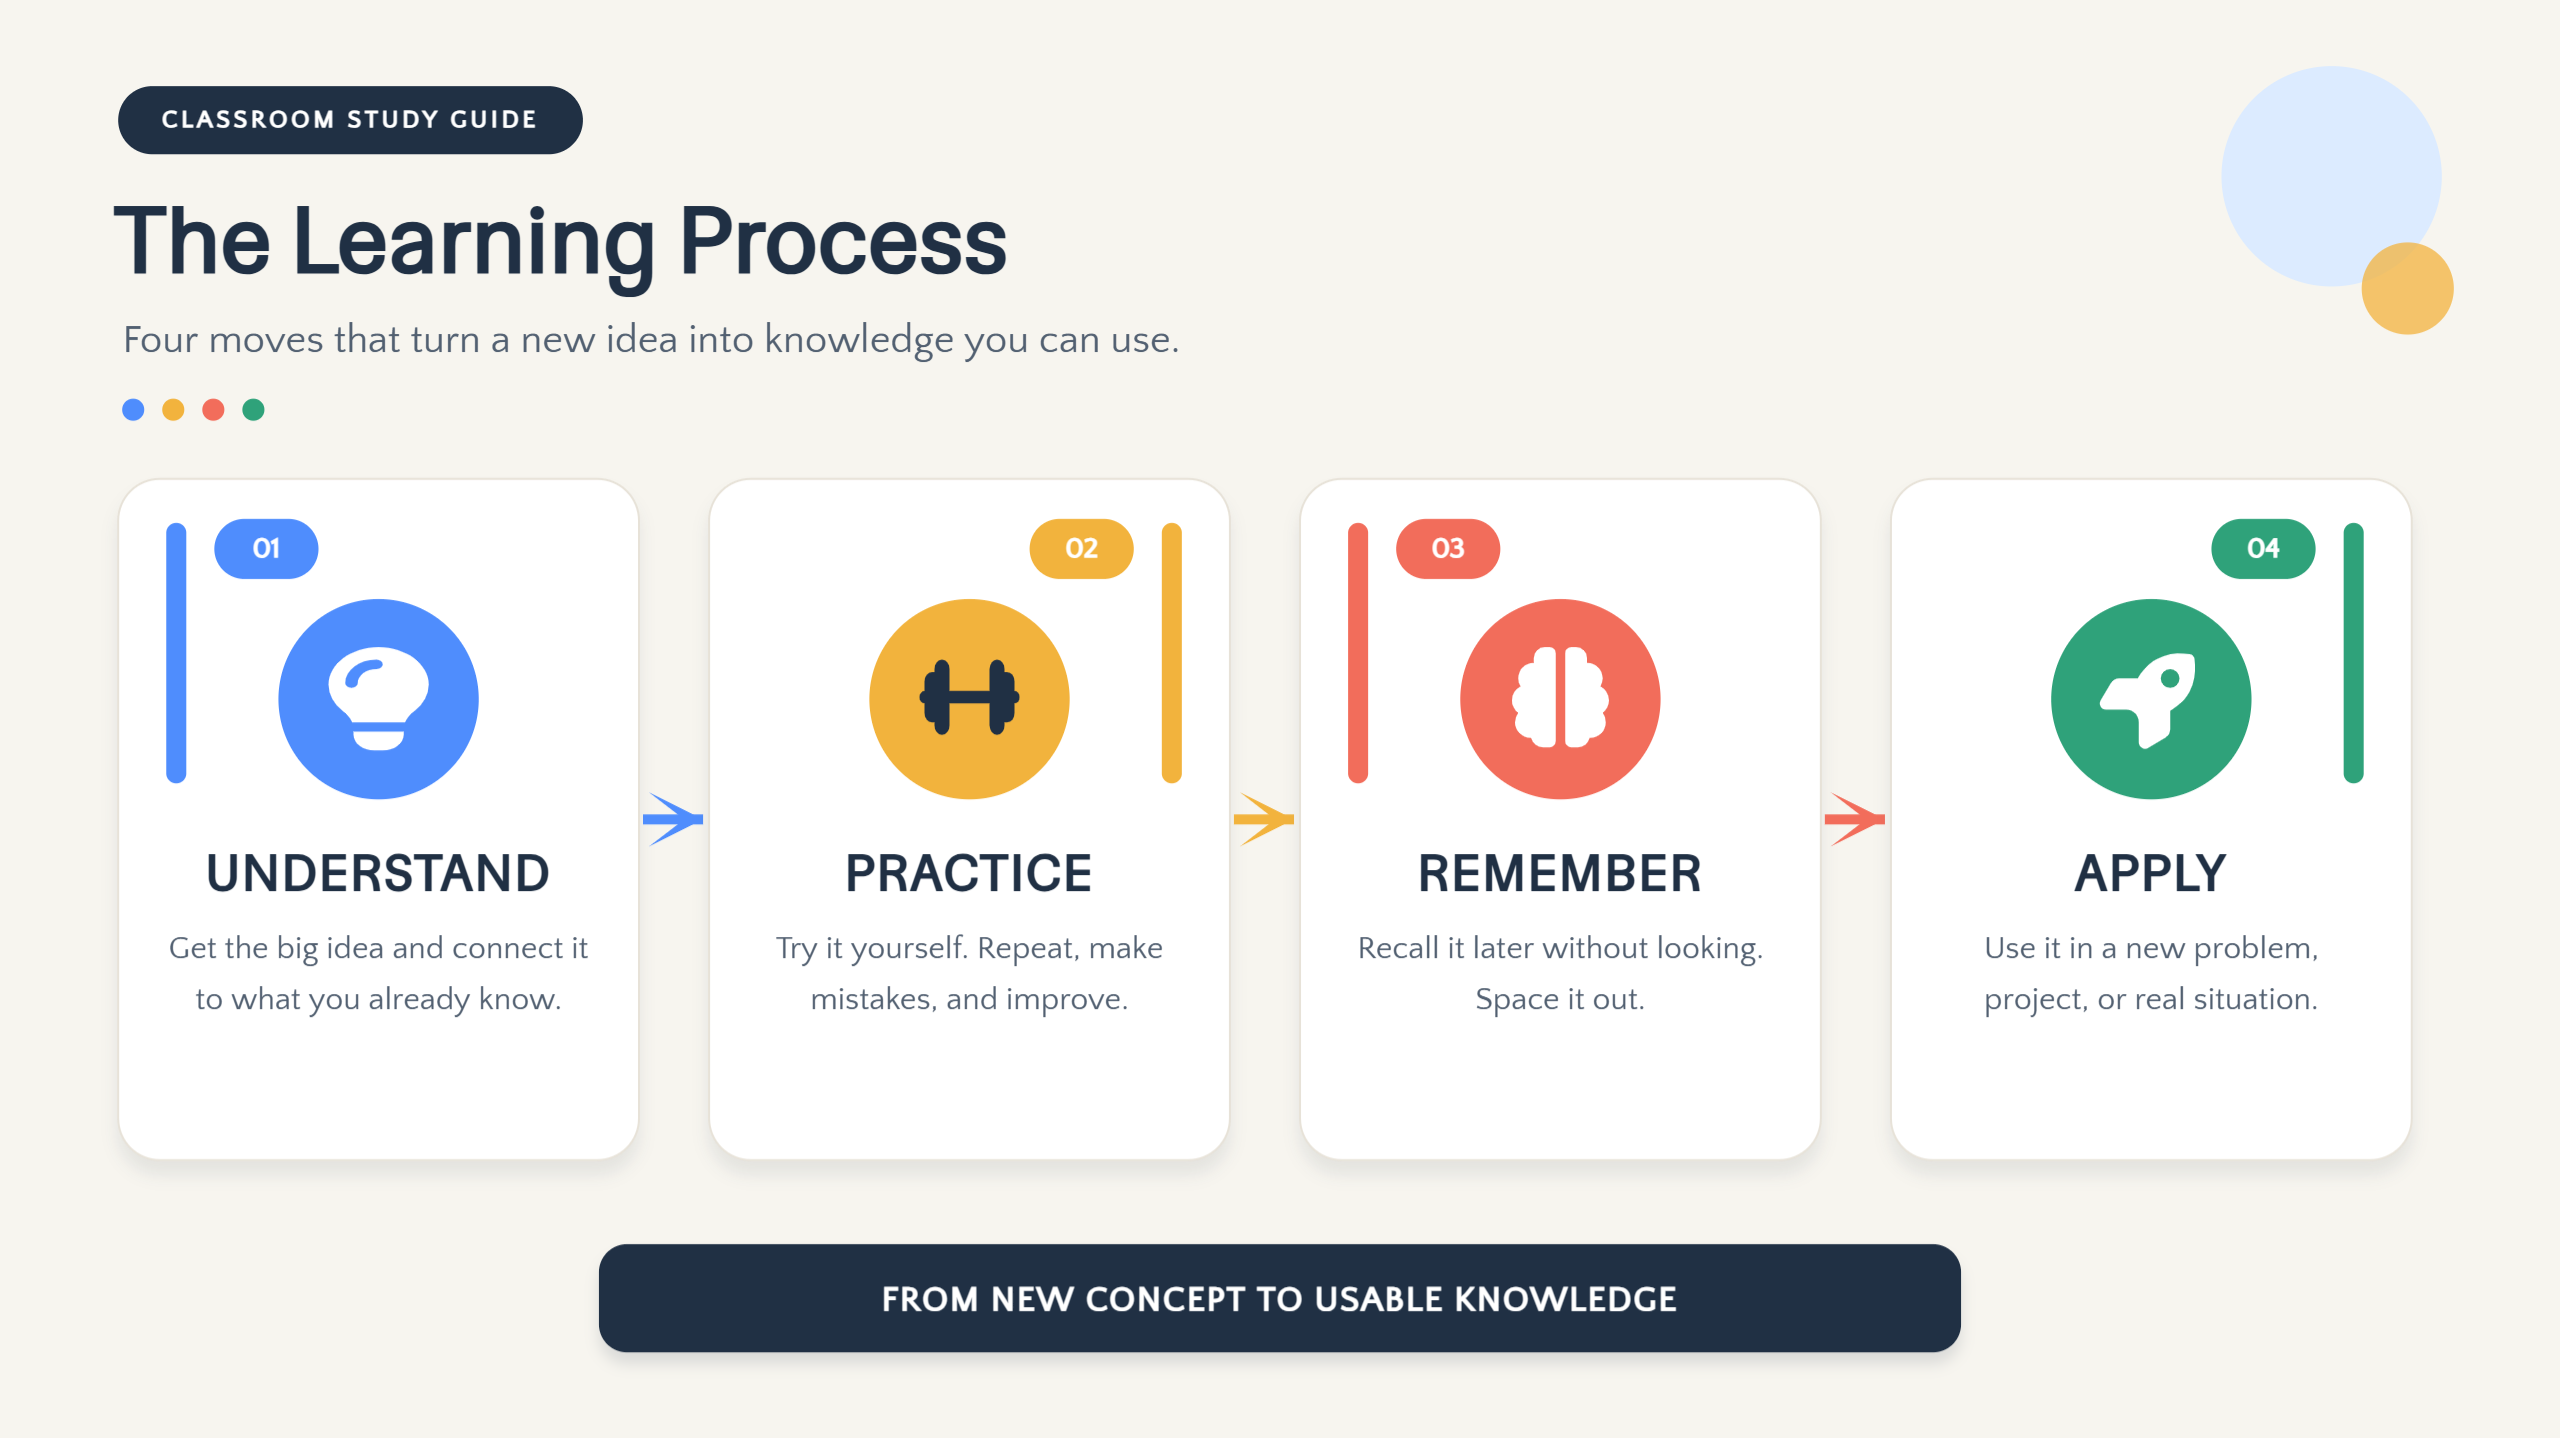
A learning process infographic shows how a new skill or topic develops from initial understanding to practical application. Students can use it to follow each learning stage, review key concepts, and track their progress. Teachers can use an educational infographic to explain learning methods, organize lesson activities, and guide students through unfamiliar topics.
Prompt:
Science infographic
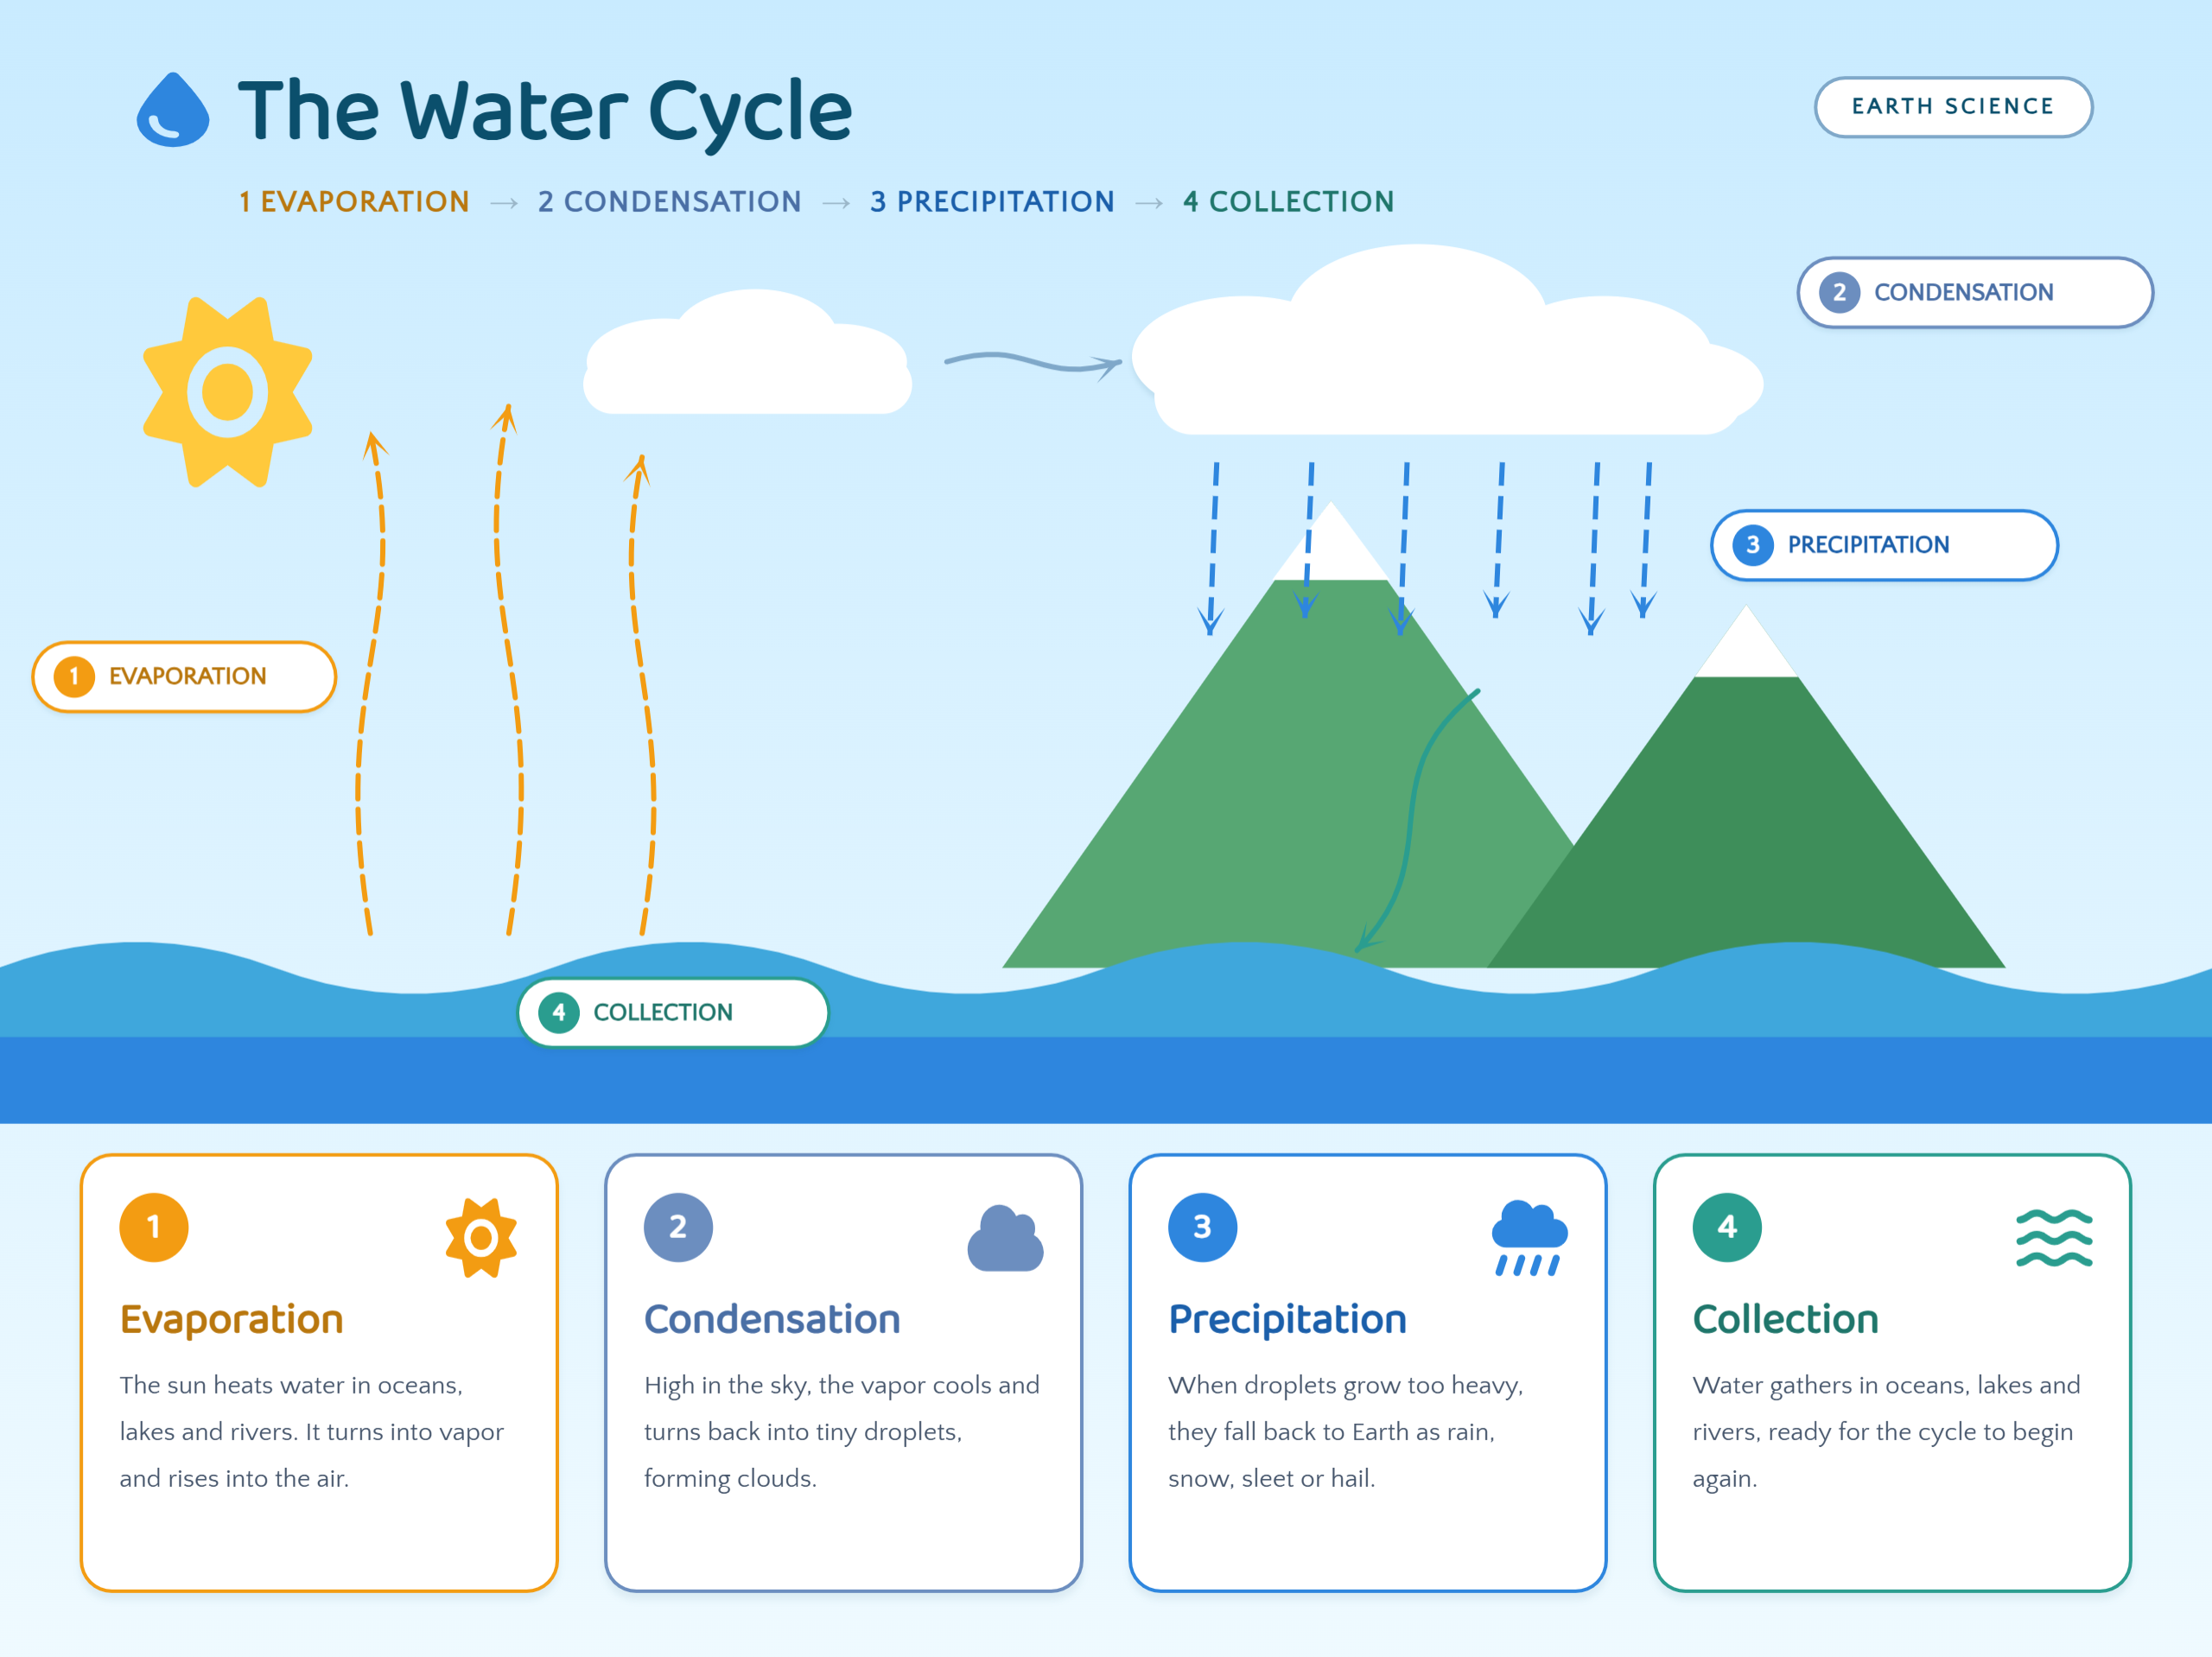
Science infographics bring together scientific facts, experimental steps, and natural processes through labeled illustrations and visual explanations. Science students can use them to review concepts, understand how different elements interact, and reinforce classroom knowledge. Teachers can also adapt these visuals to introduce scientific topics and explain complex phenomena. This is one of the practical educational infographic examples for presenting science concepts.
Prompt:
History infographic
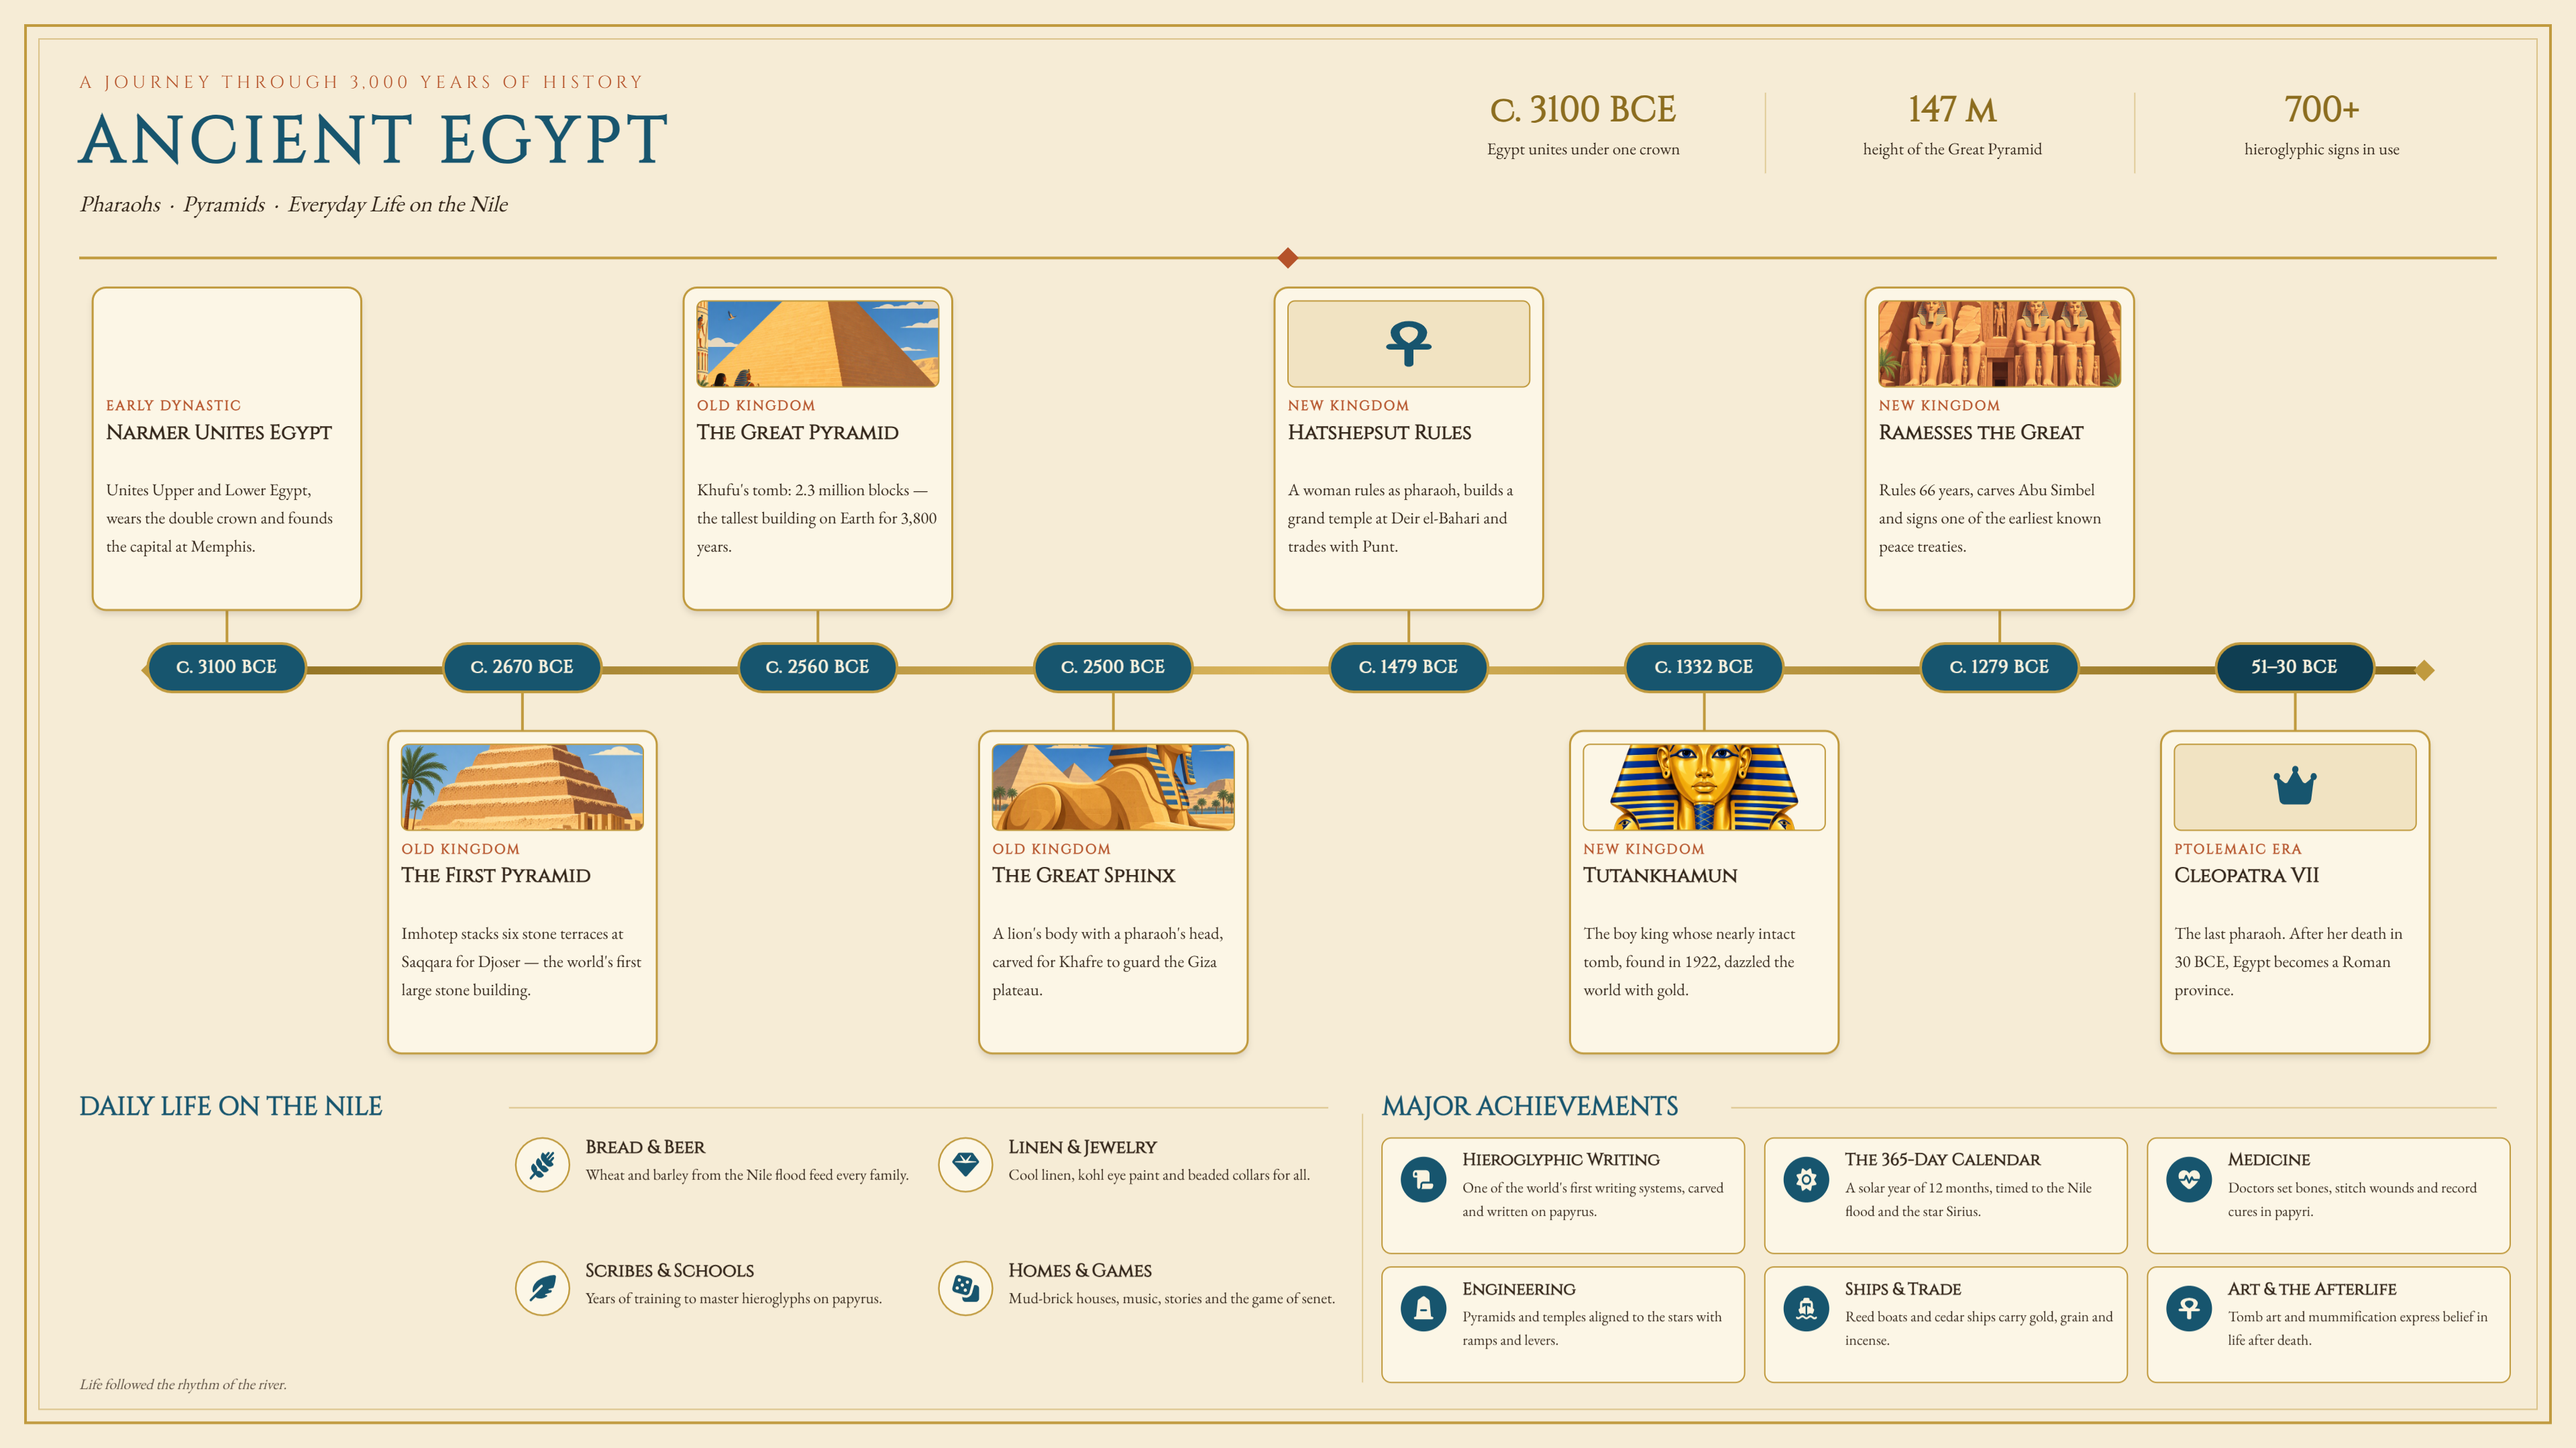
A history infographic organizes important events, dates, figures, and historical developments into a clear visual sequence. Students can use it to review historical periods, explore cause-and-effect relationships, and connect events across different timelines. Educators can incorporate these visuals into lessons to explain historical contexts, highlight major turning points, and encourage discussion about the past.
Prompt:
Math infographic
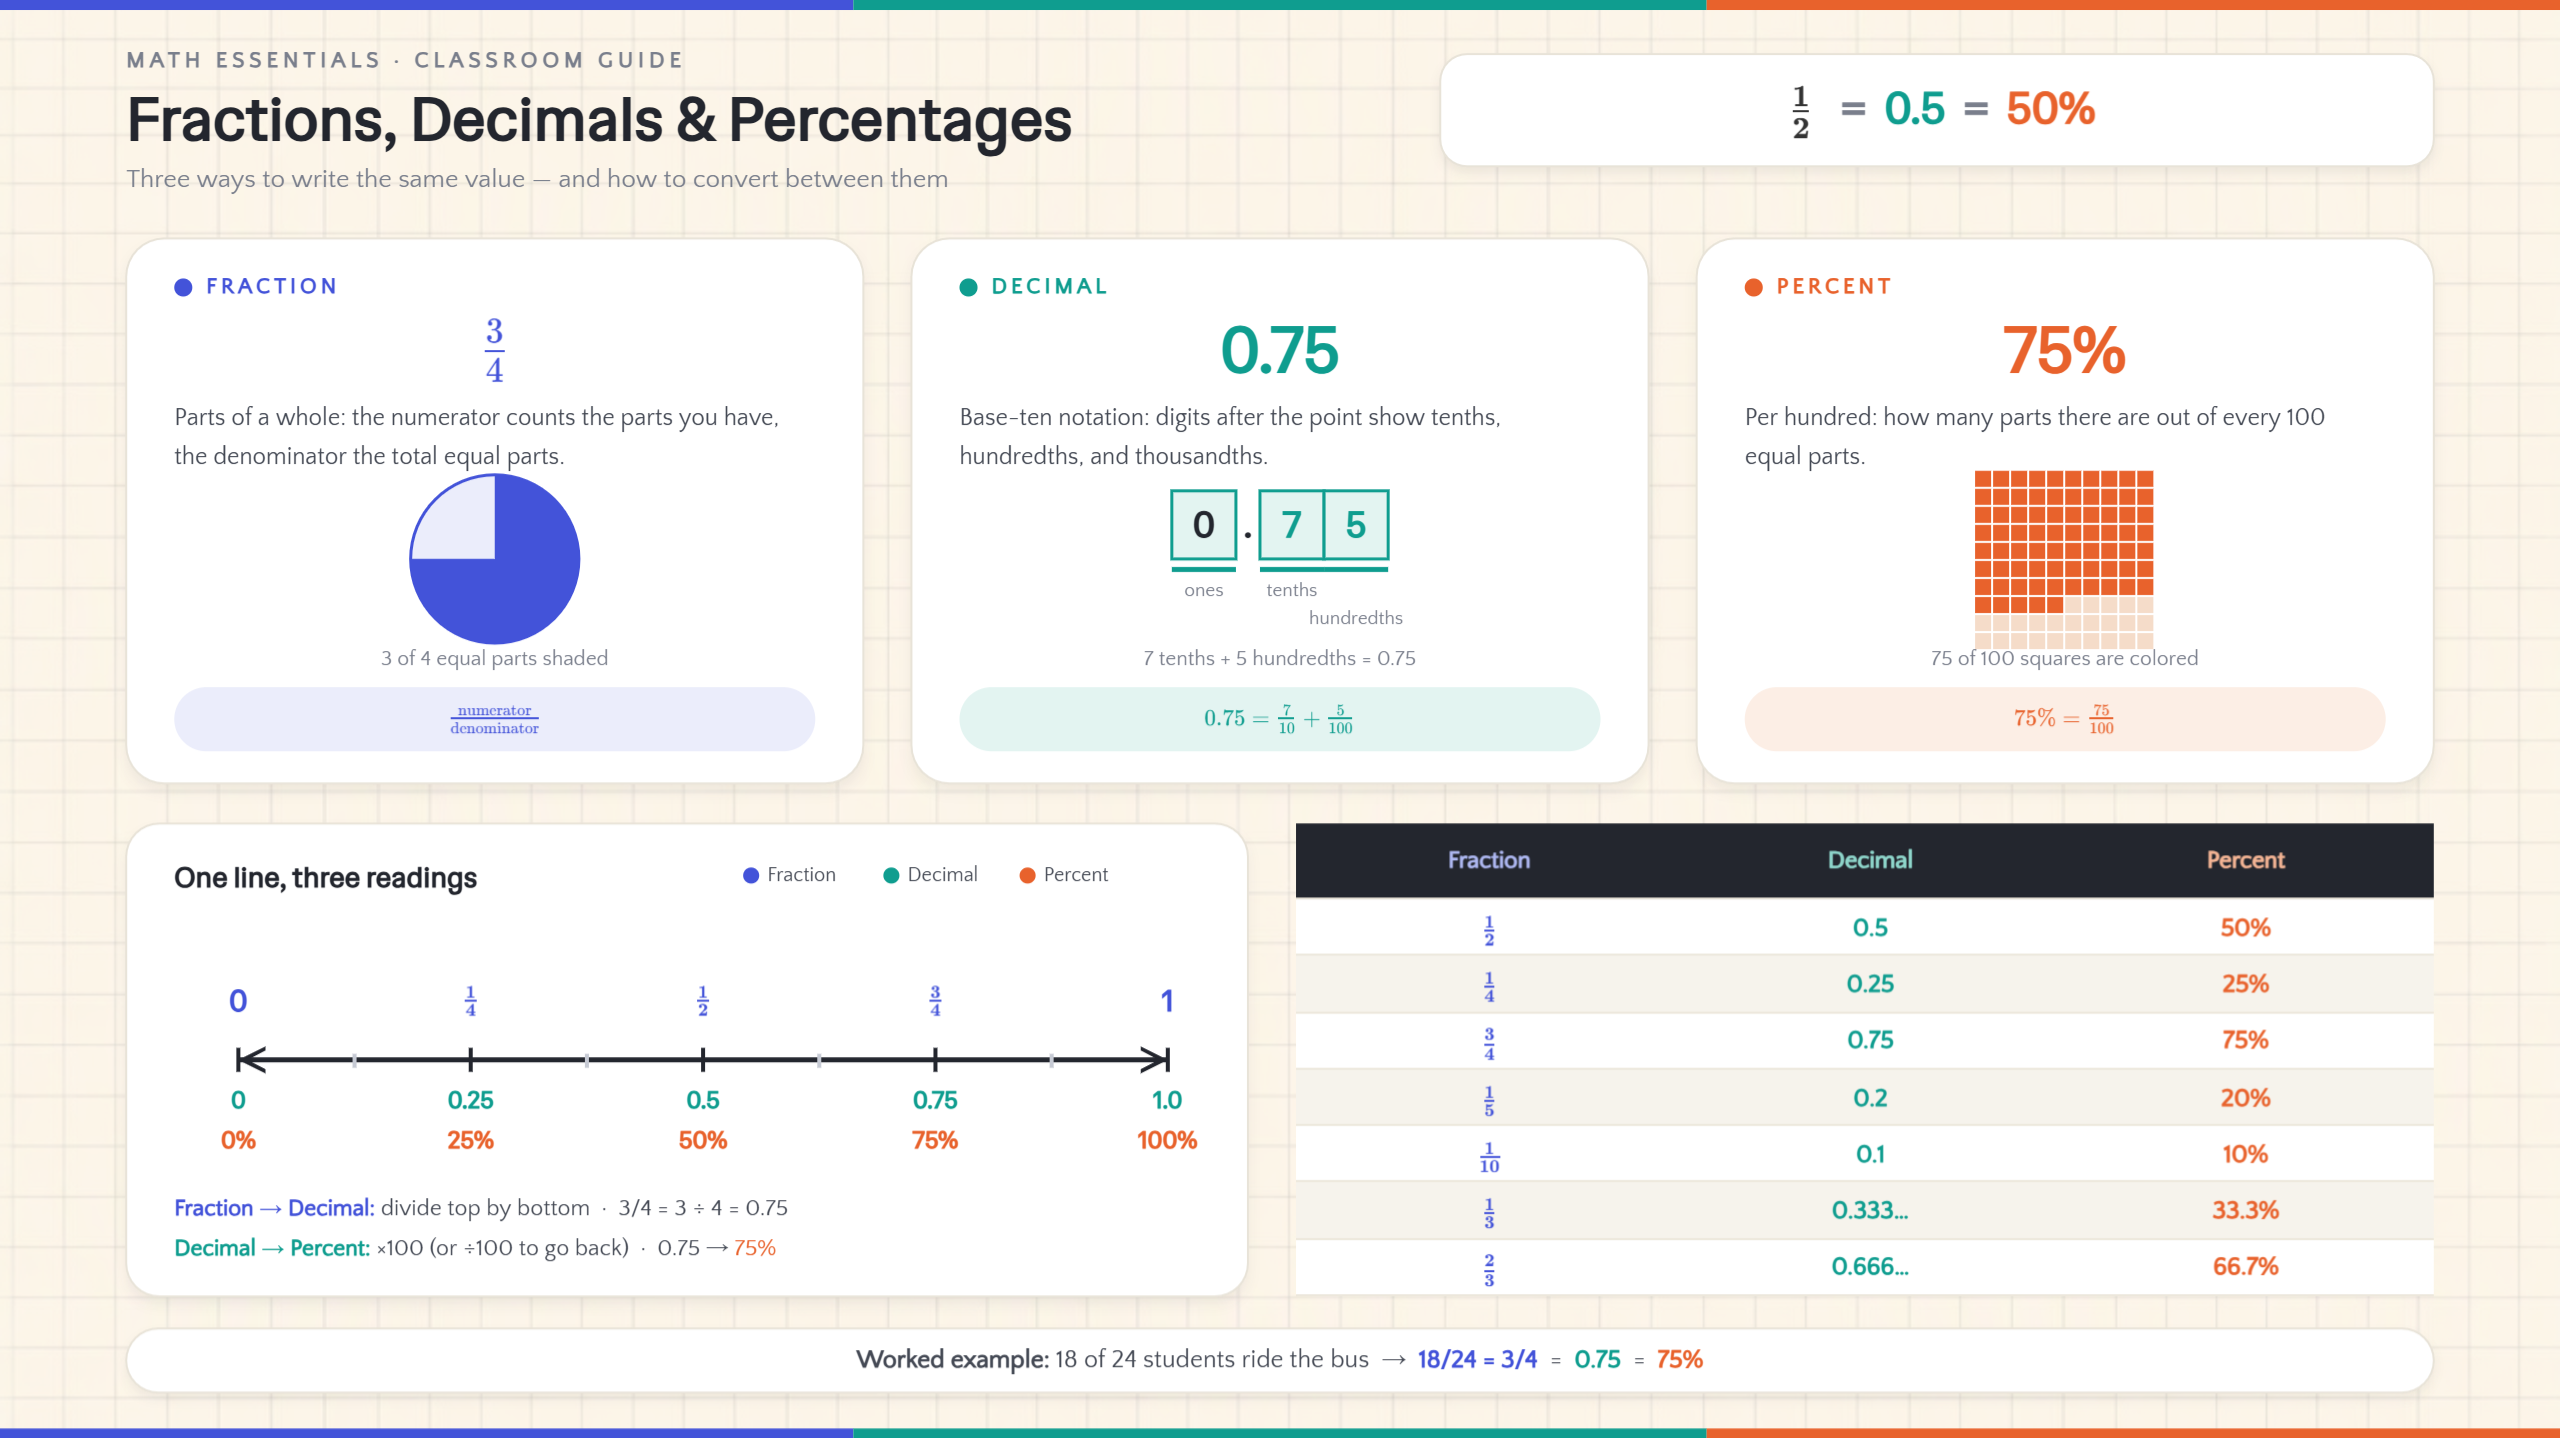
Math infographics present formulas, number patterns, and problem-solving methods through diagrams and practical examples. Students can refer to them when reviewing mathematical rules, understanding calculations, and practicing problems independently. Teachers can also use visual examples, such as fraction diagrams and number lines, to explain abstract concepts and demonstrate how different mathematical ideas connect.
Prompt:
Language learning infographic
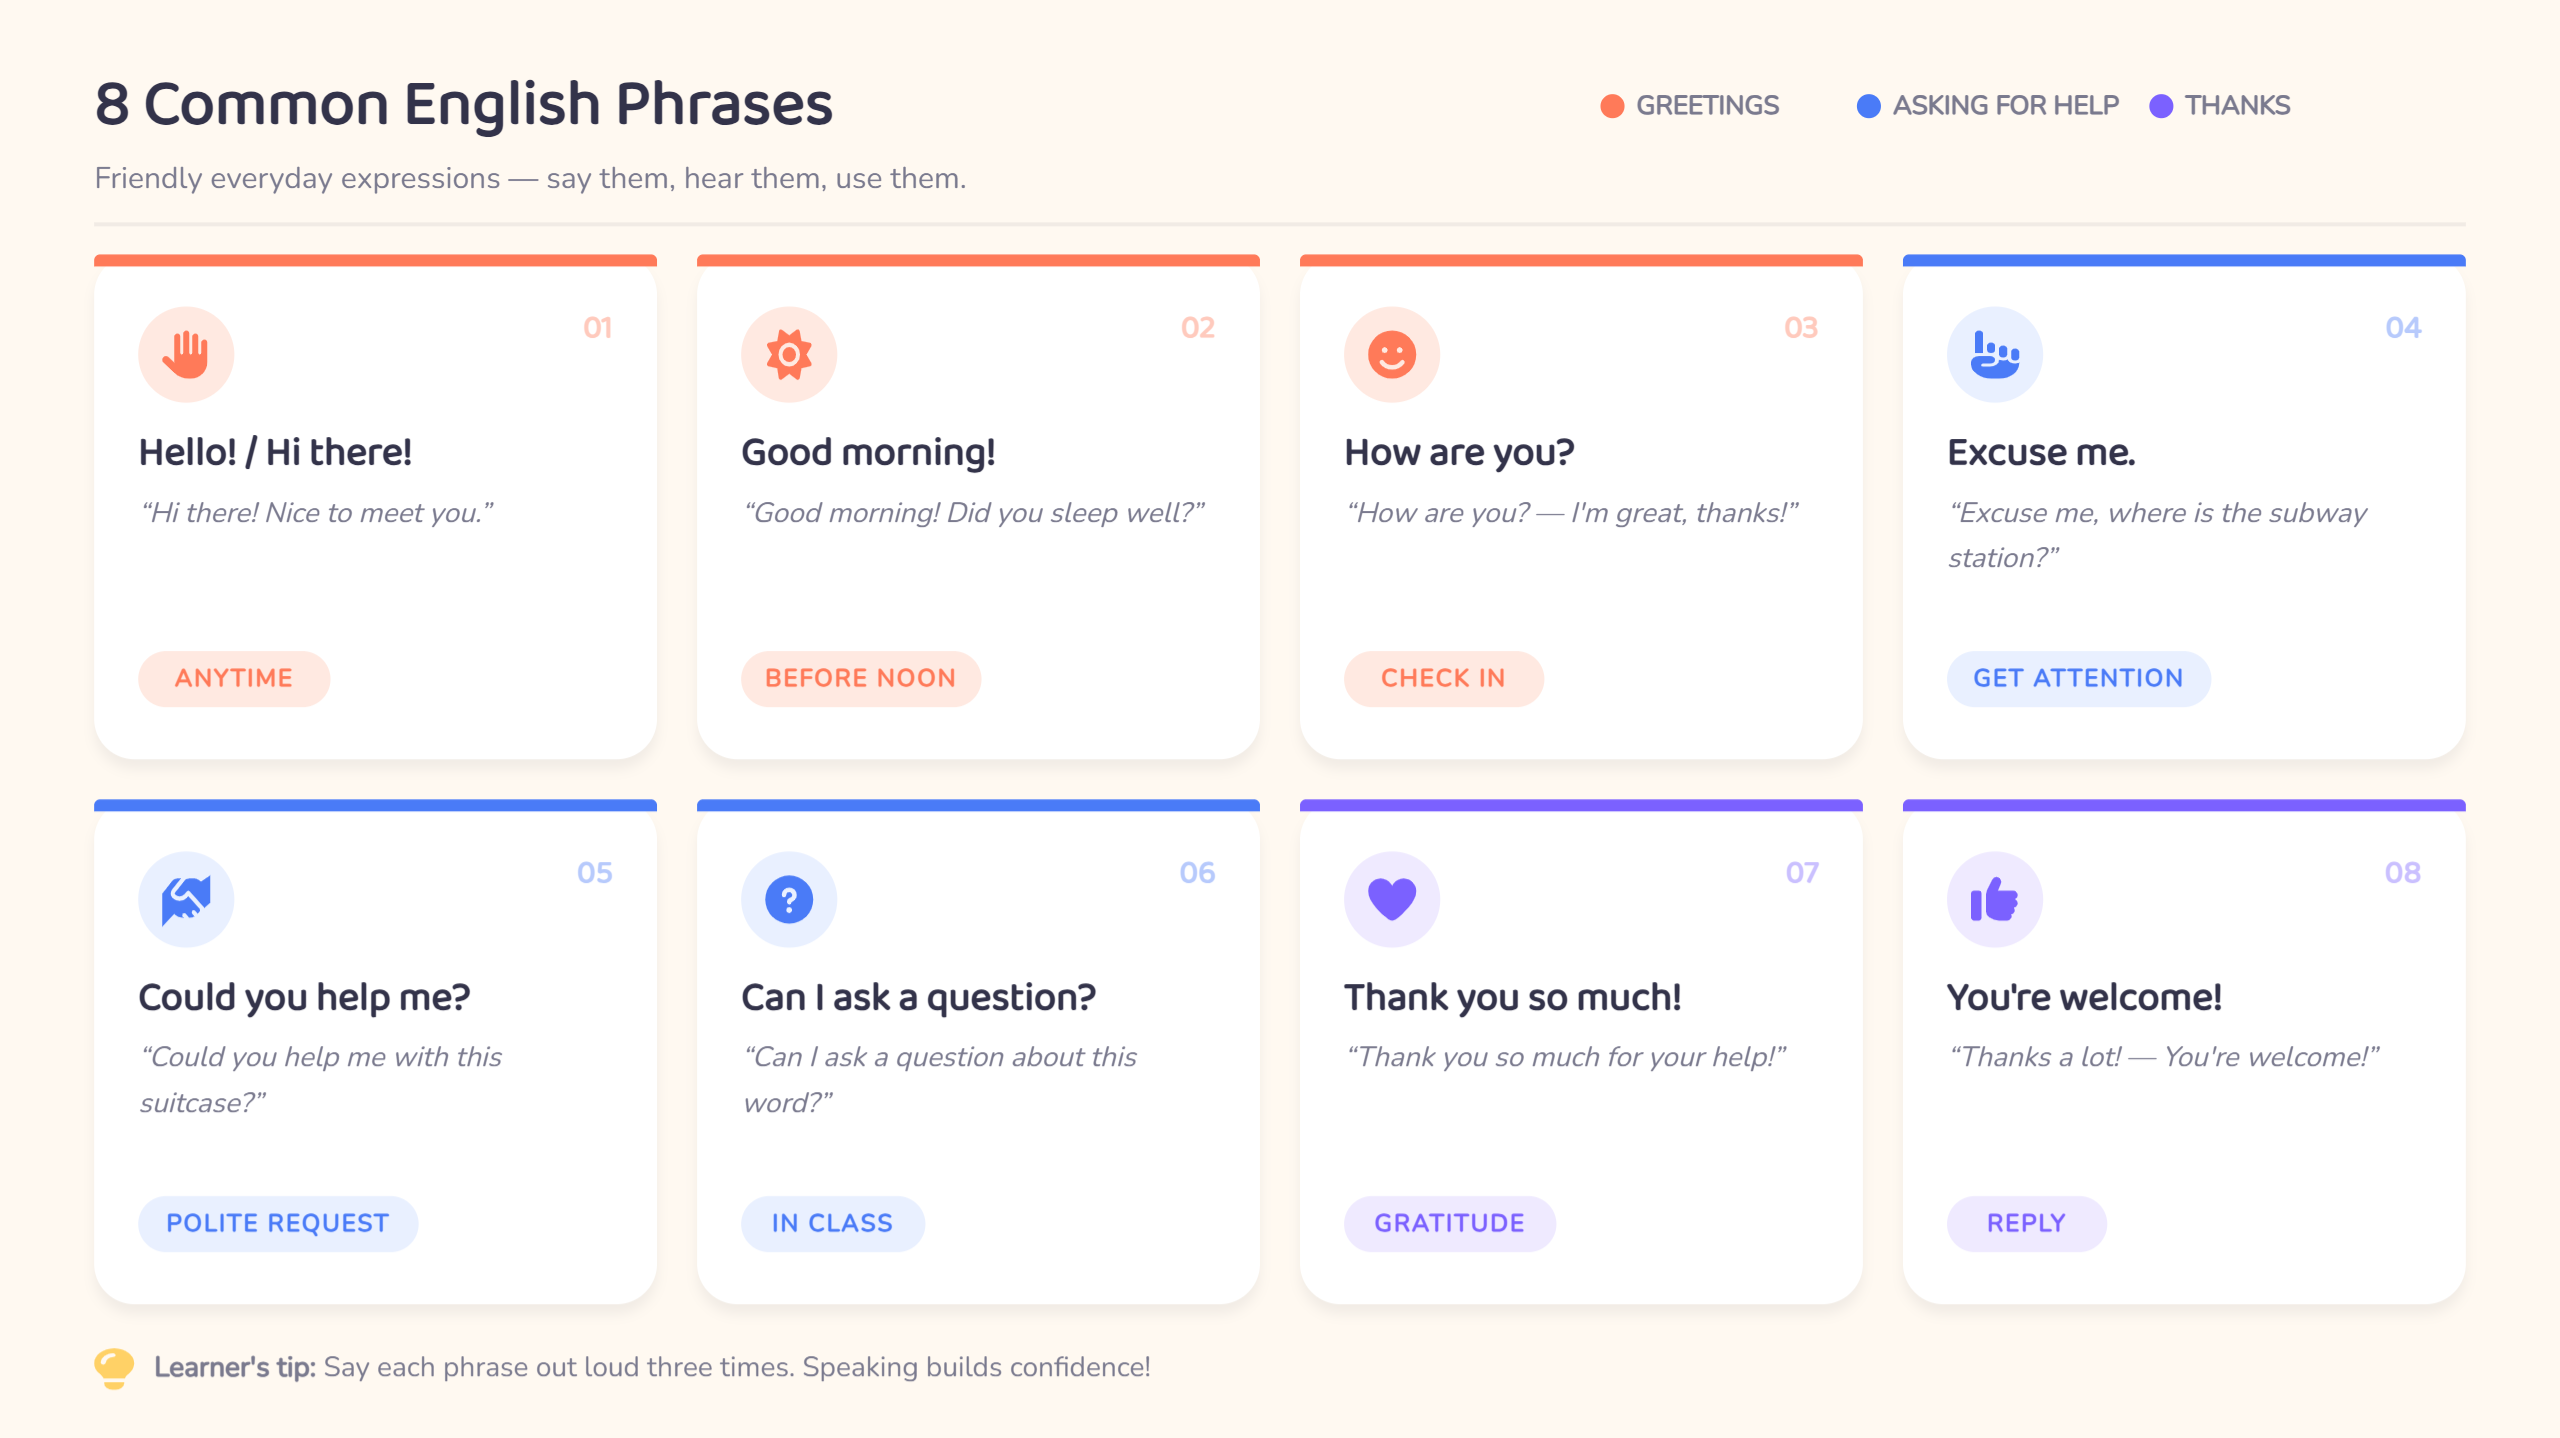
A language learning infographic combines vocabulary, grammar rules, and useful expressions with visual examples. Language learners can use it to review new words, understand sentence structures, and practice expressions in everyday situations. Instructors can also use these visuals to introduce language concepts, demonstrate how phrases work in context, and prepare reference materials for speaking and writing activities.
Prompt:
Study tips infographic
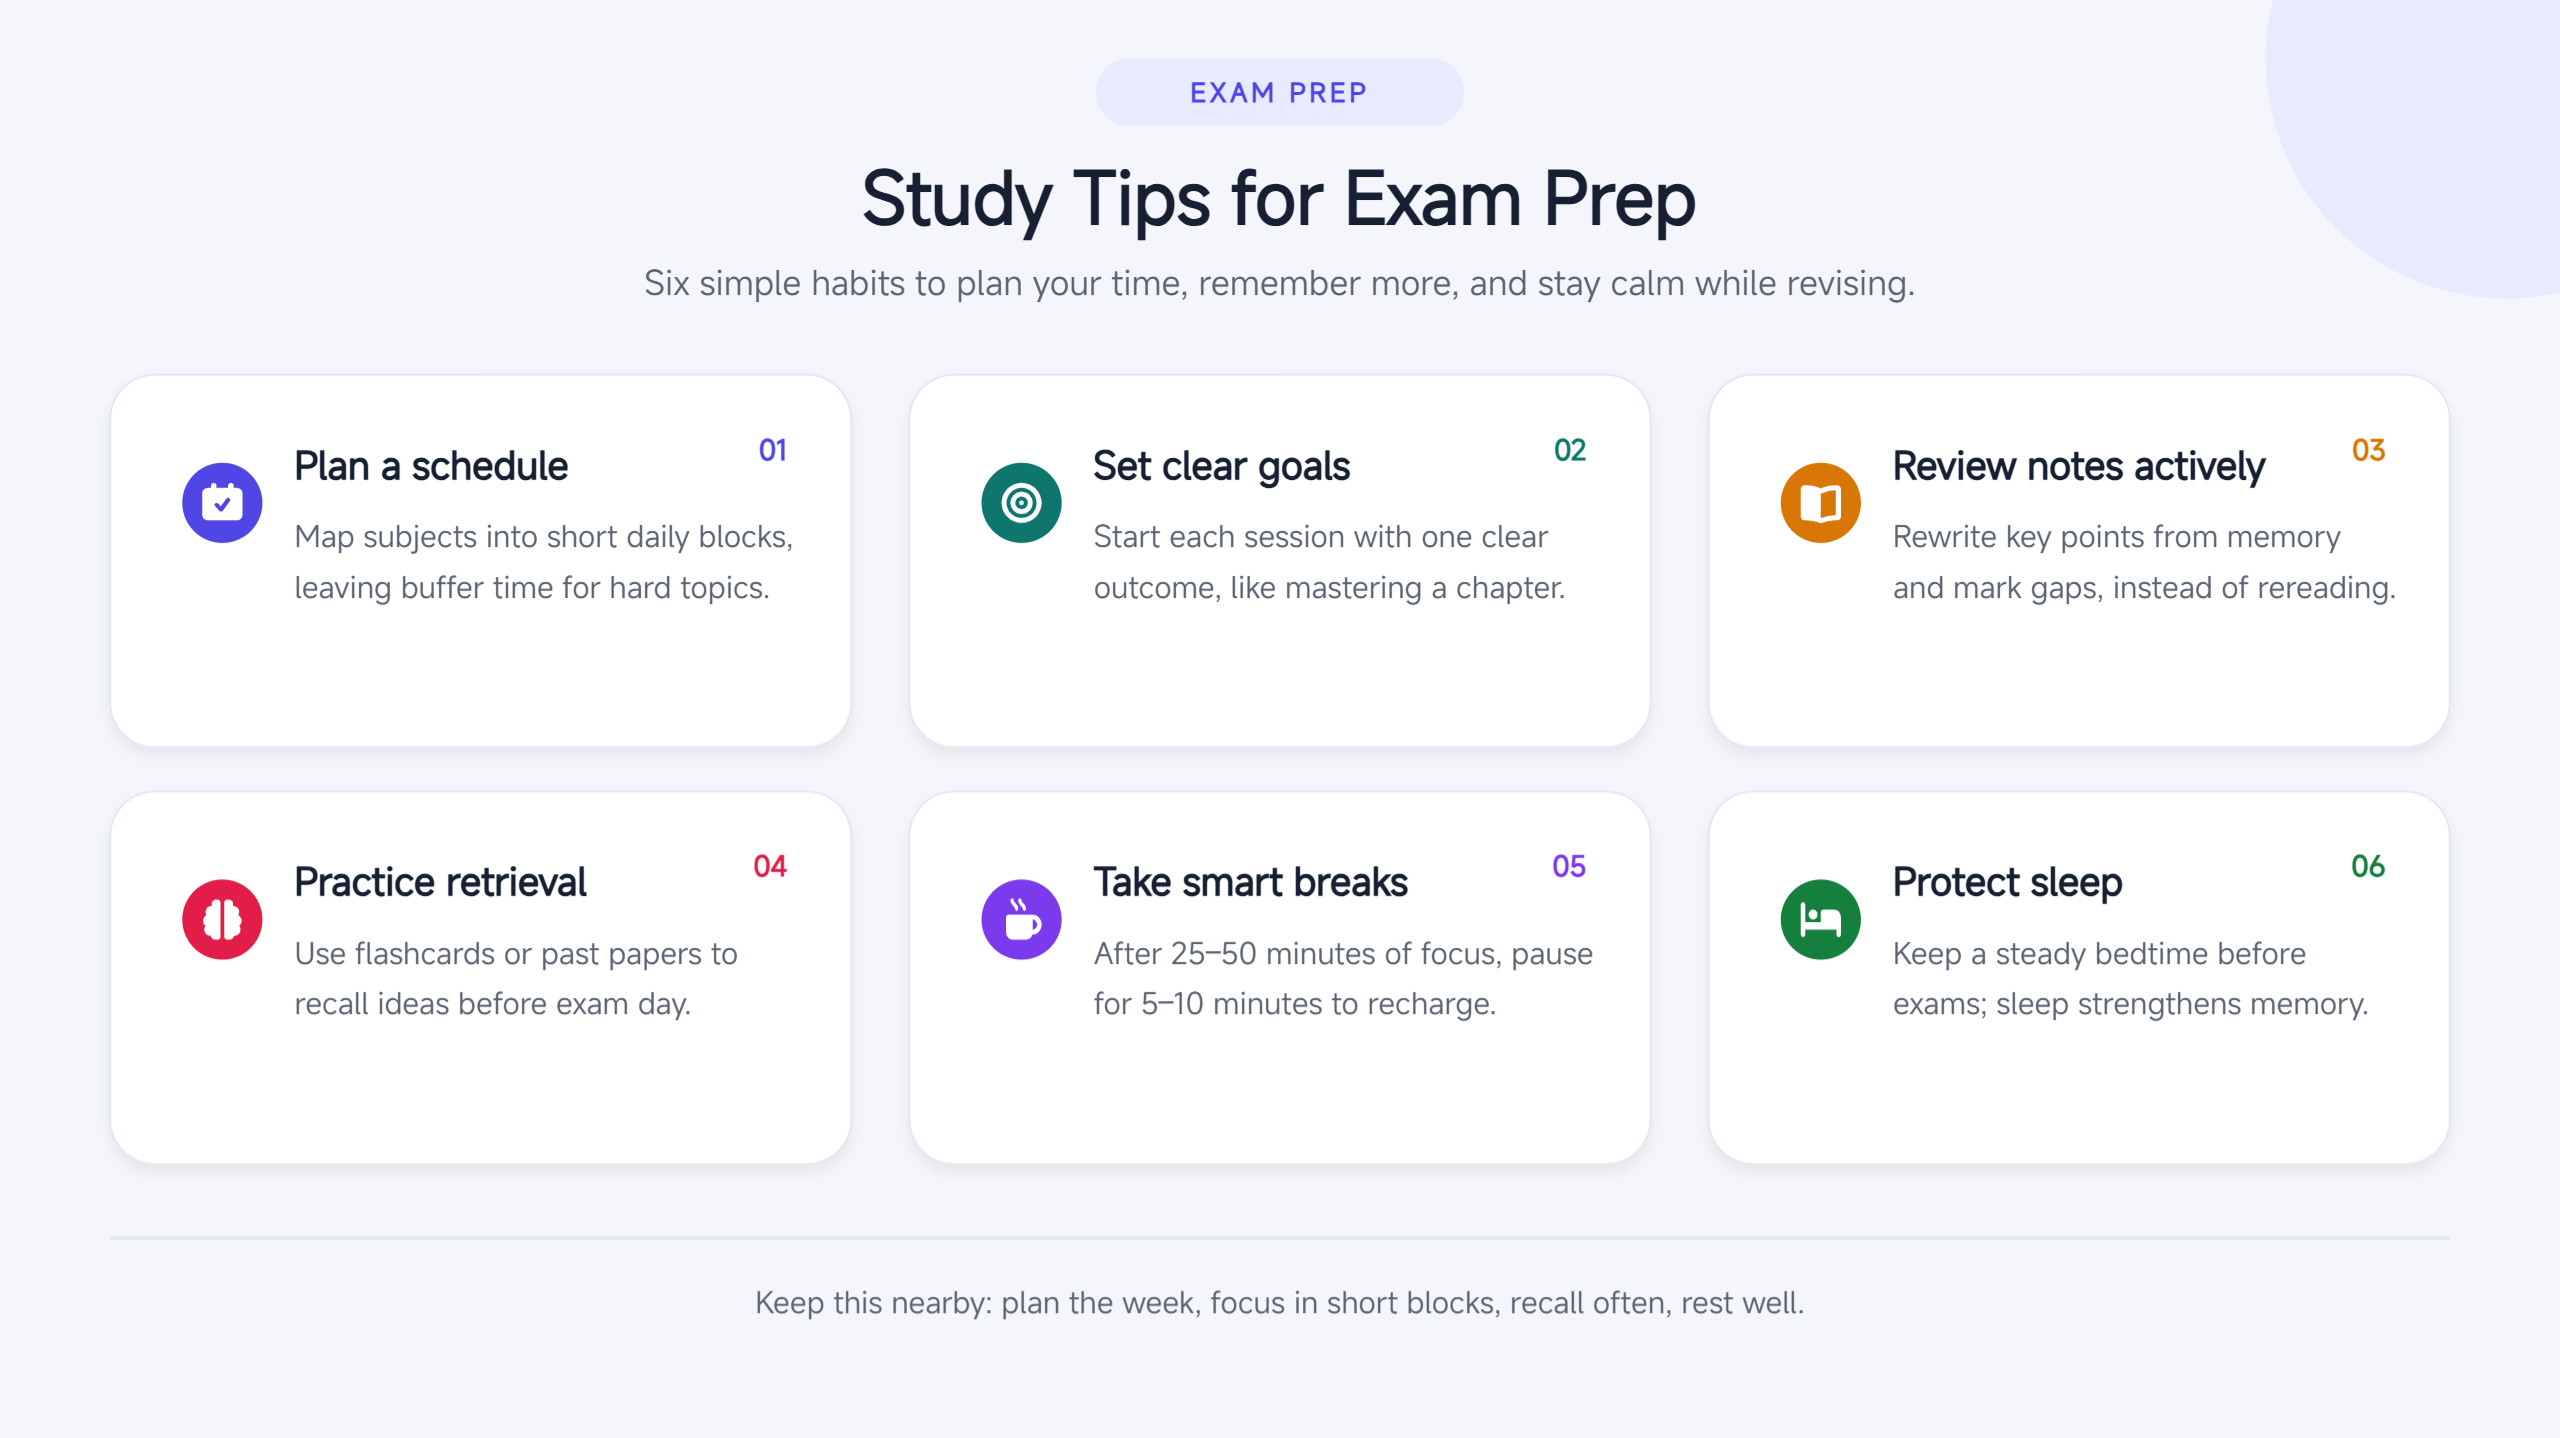
A study tips infographic presents practical learning strategies, such as active recall, spaced repetition, practice tests, and time management. Students and exam candidates can use it to explore different study methods, plan revision schedules, and develop habits that support exam preparation. This educational infographic example can also provide useful reference materials for academic guidance sessions and study skills workshops.
Prompt:
Classroom rules infographic
A classroom rules infographic communicates expectations and daily routines through short statements and friendly illustrations. School students can refer to it to understand classroom behavior, follow shared routines, and learn how to interact respectfully with classmates. Teachers can display these infographics in learning spaces to introduce class expectations, reinforce positive behavior, and create a more organized classroom environment.
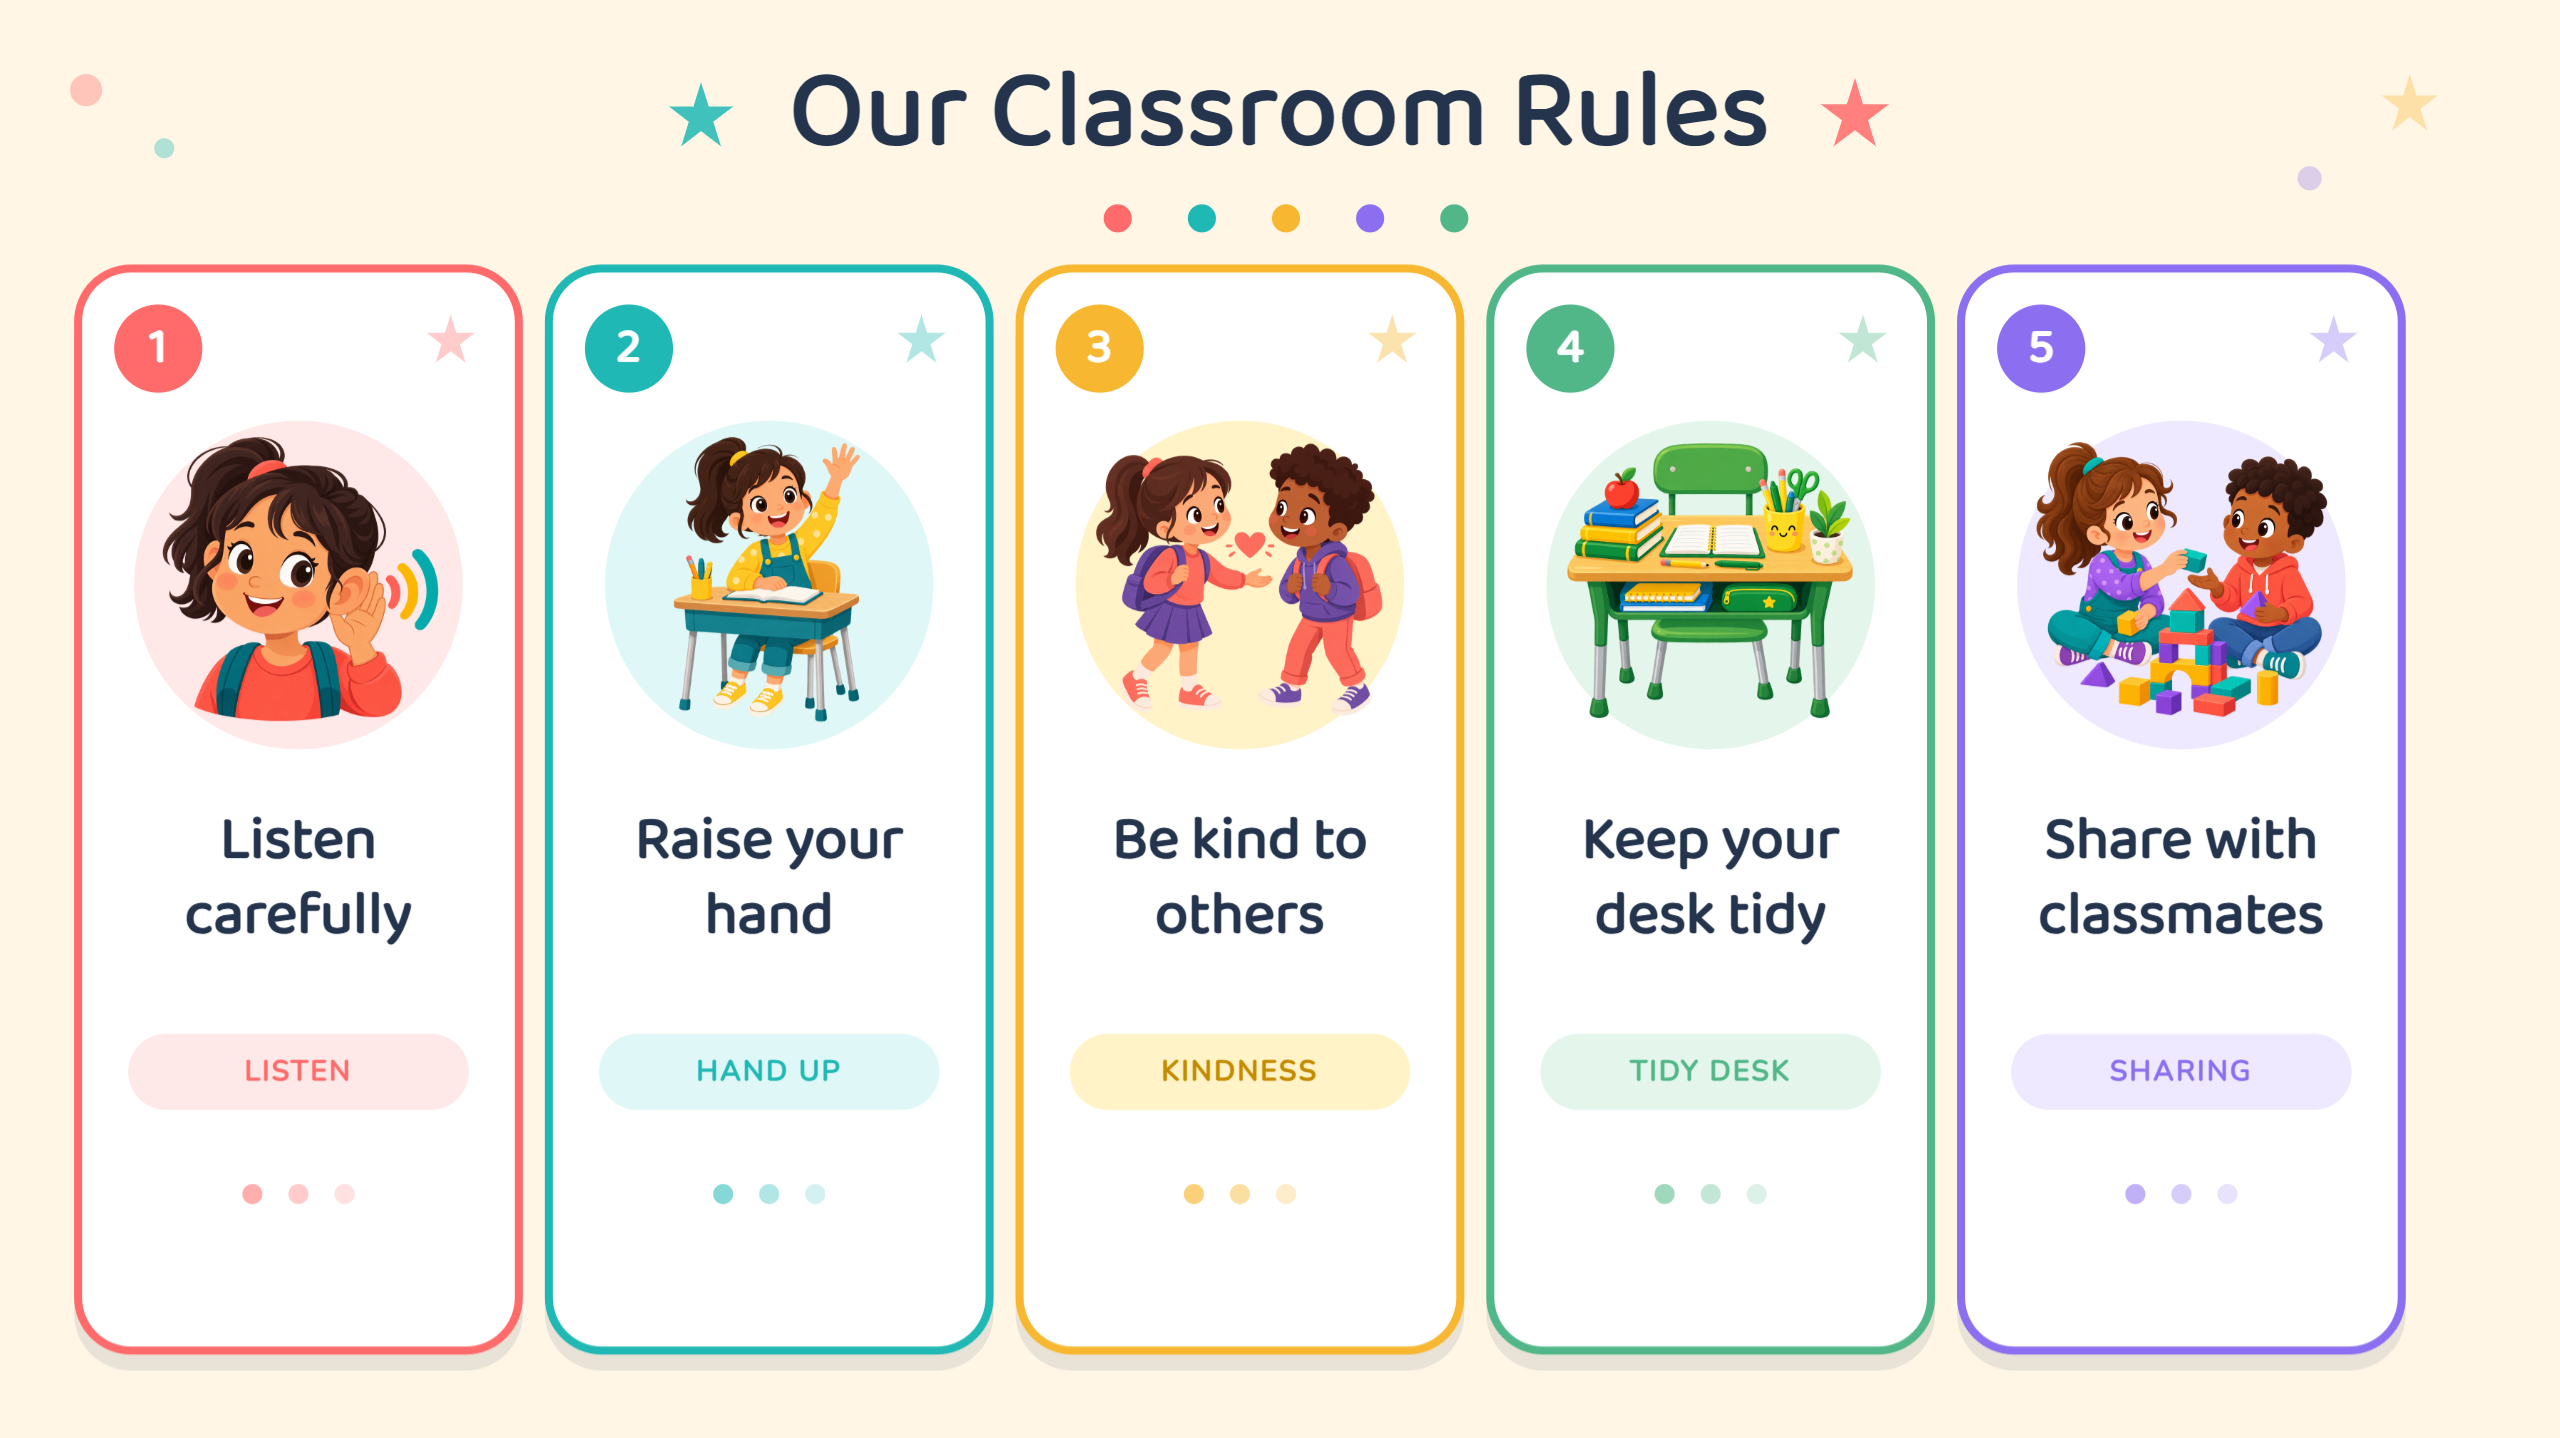
Prompt:
Anatomy infographic
An anatomy infographic uses labeled diagrams and concise explanations to show the structure and functions of body parts and organs. Biology students can use these visuals to identify anatomical structures, review organ functions, and understand how different body systems work. Health educators can also incorporate them into educational materials to explain basic human biology and communicate anatomical information more clearly.
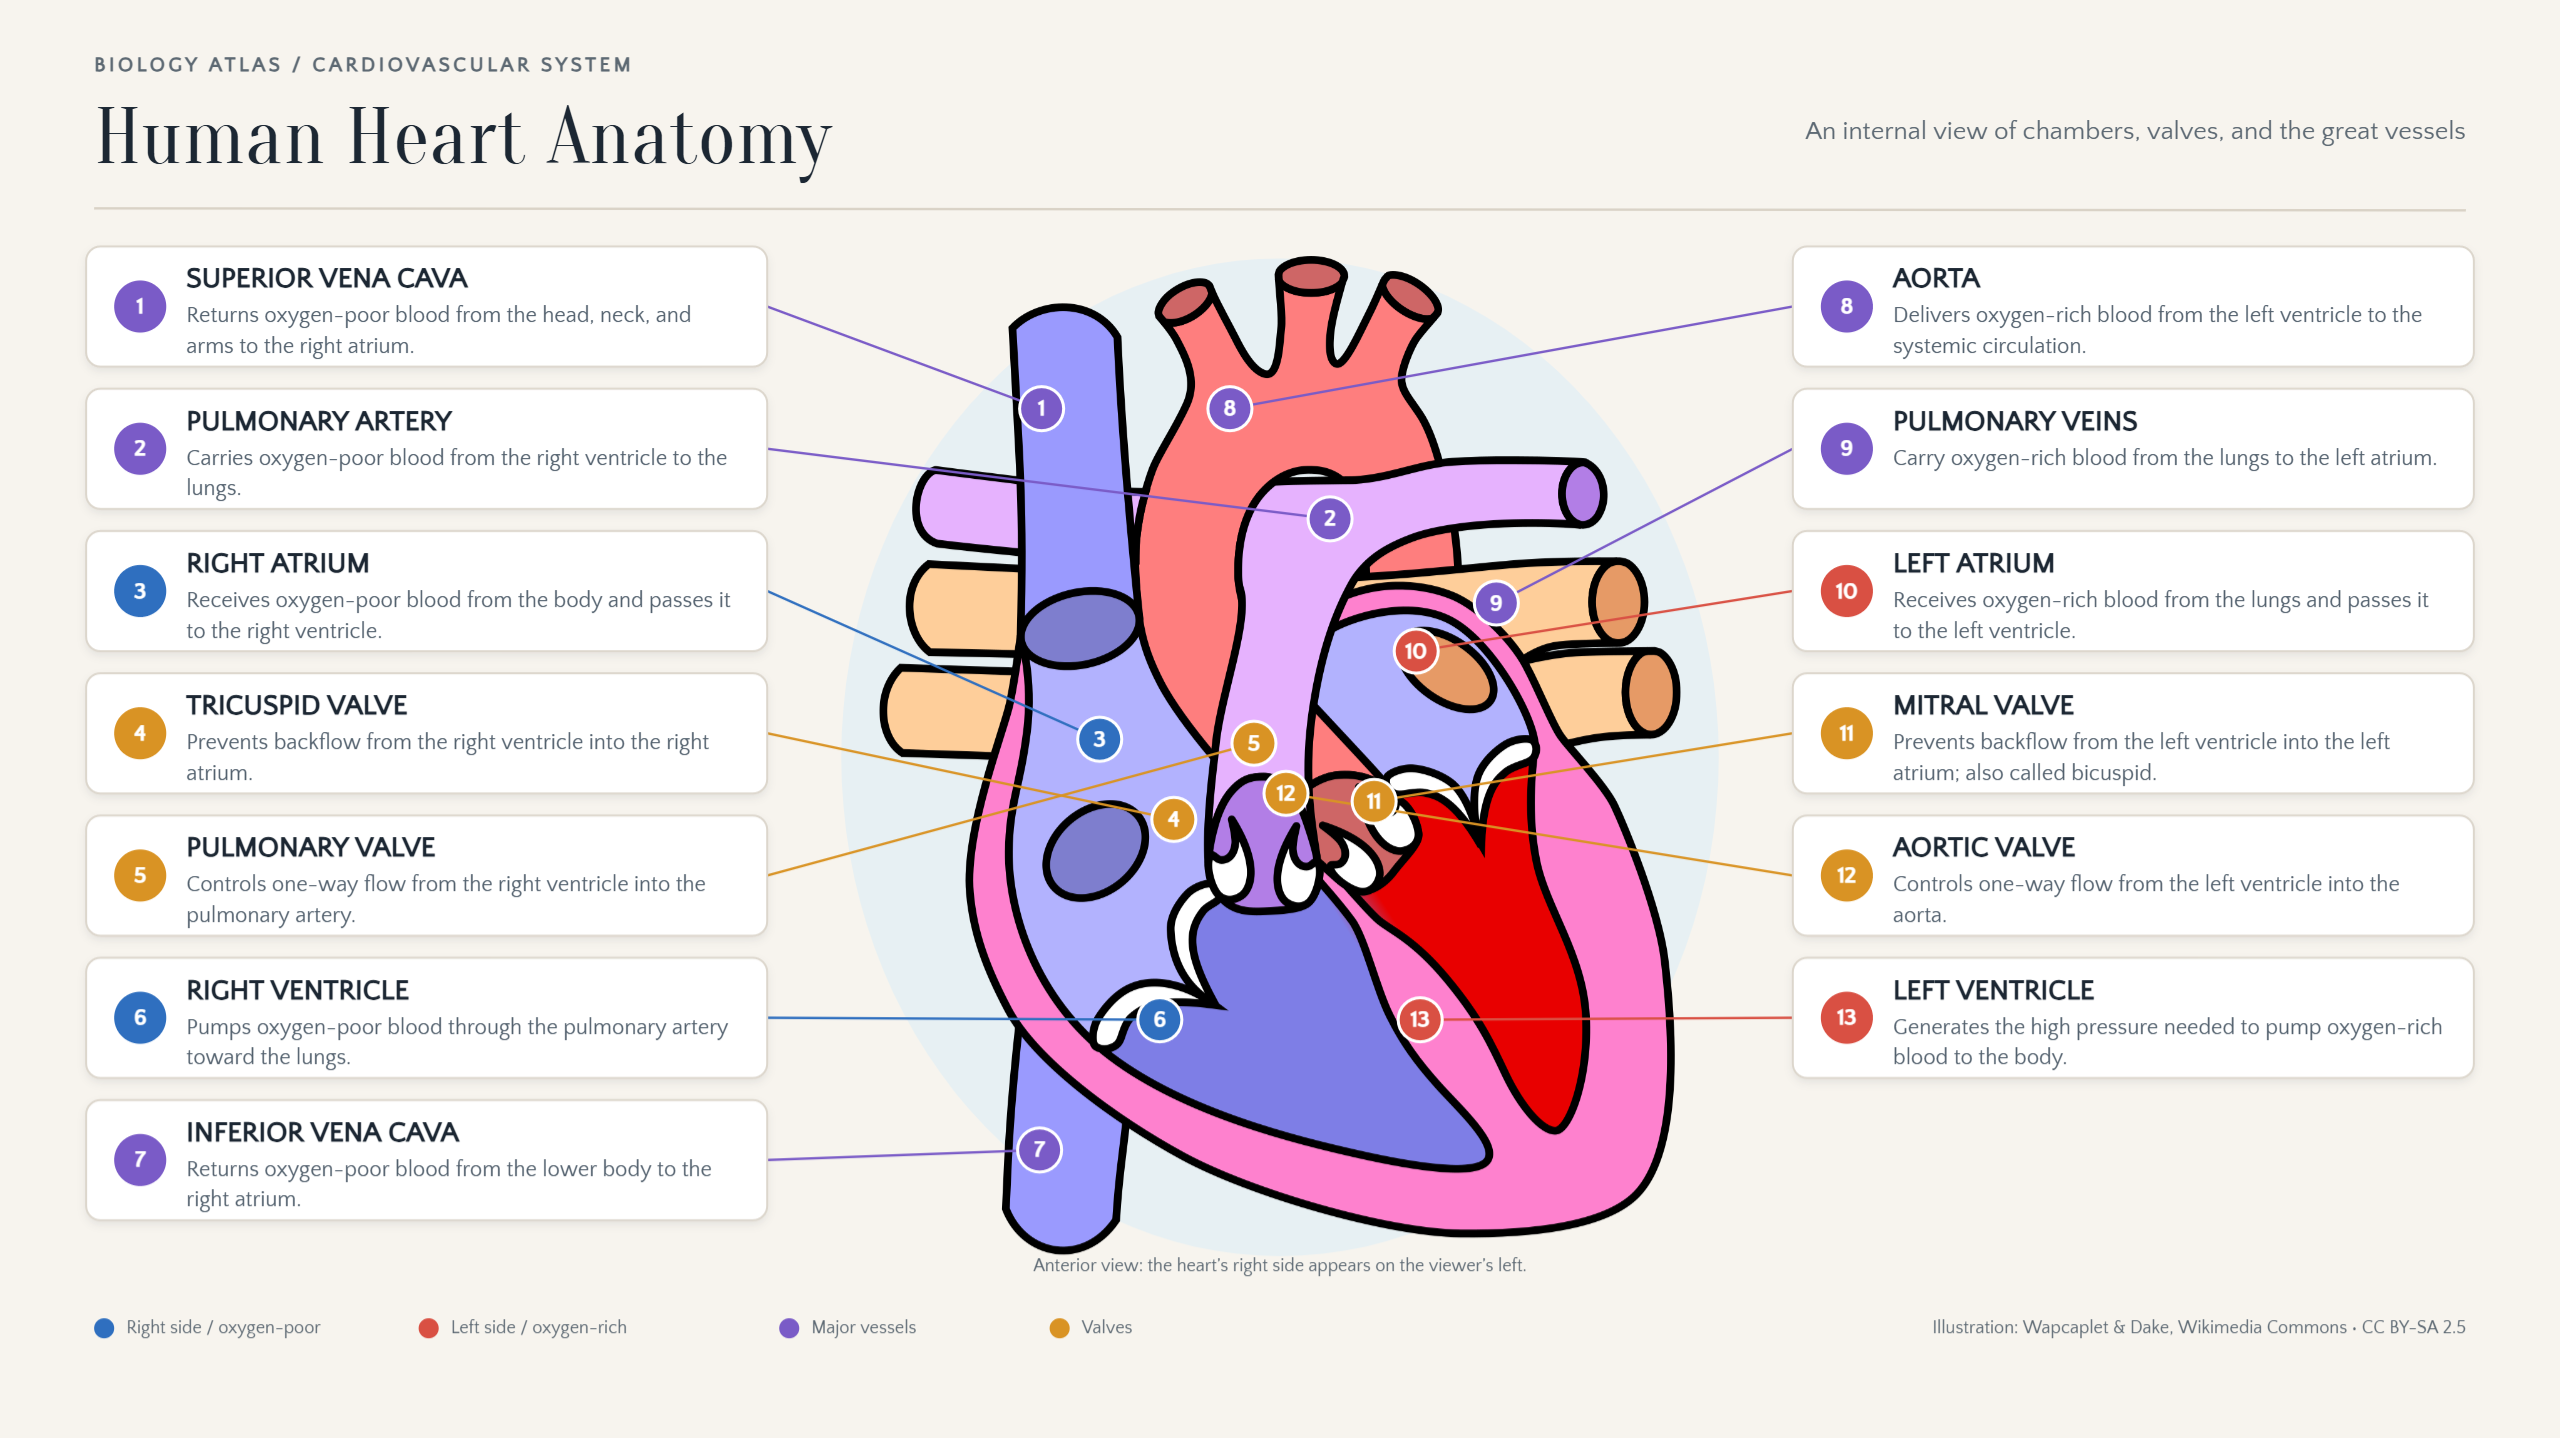
Prompt:
Environmental education infographic
Environmental education infographics explain topics such as pollution, climate change, deforestation, and waste management through visual examples. Students can use them to explore environmental issues, understand their causes and effects, and learn about sustainable practices. Teachers can incorporate these materials into environmental lessons and school projects, while environmental groups can use them to communicate conservation messages and encourage public participation in sustainability initiatives.
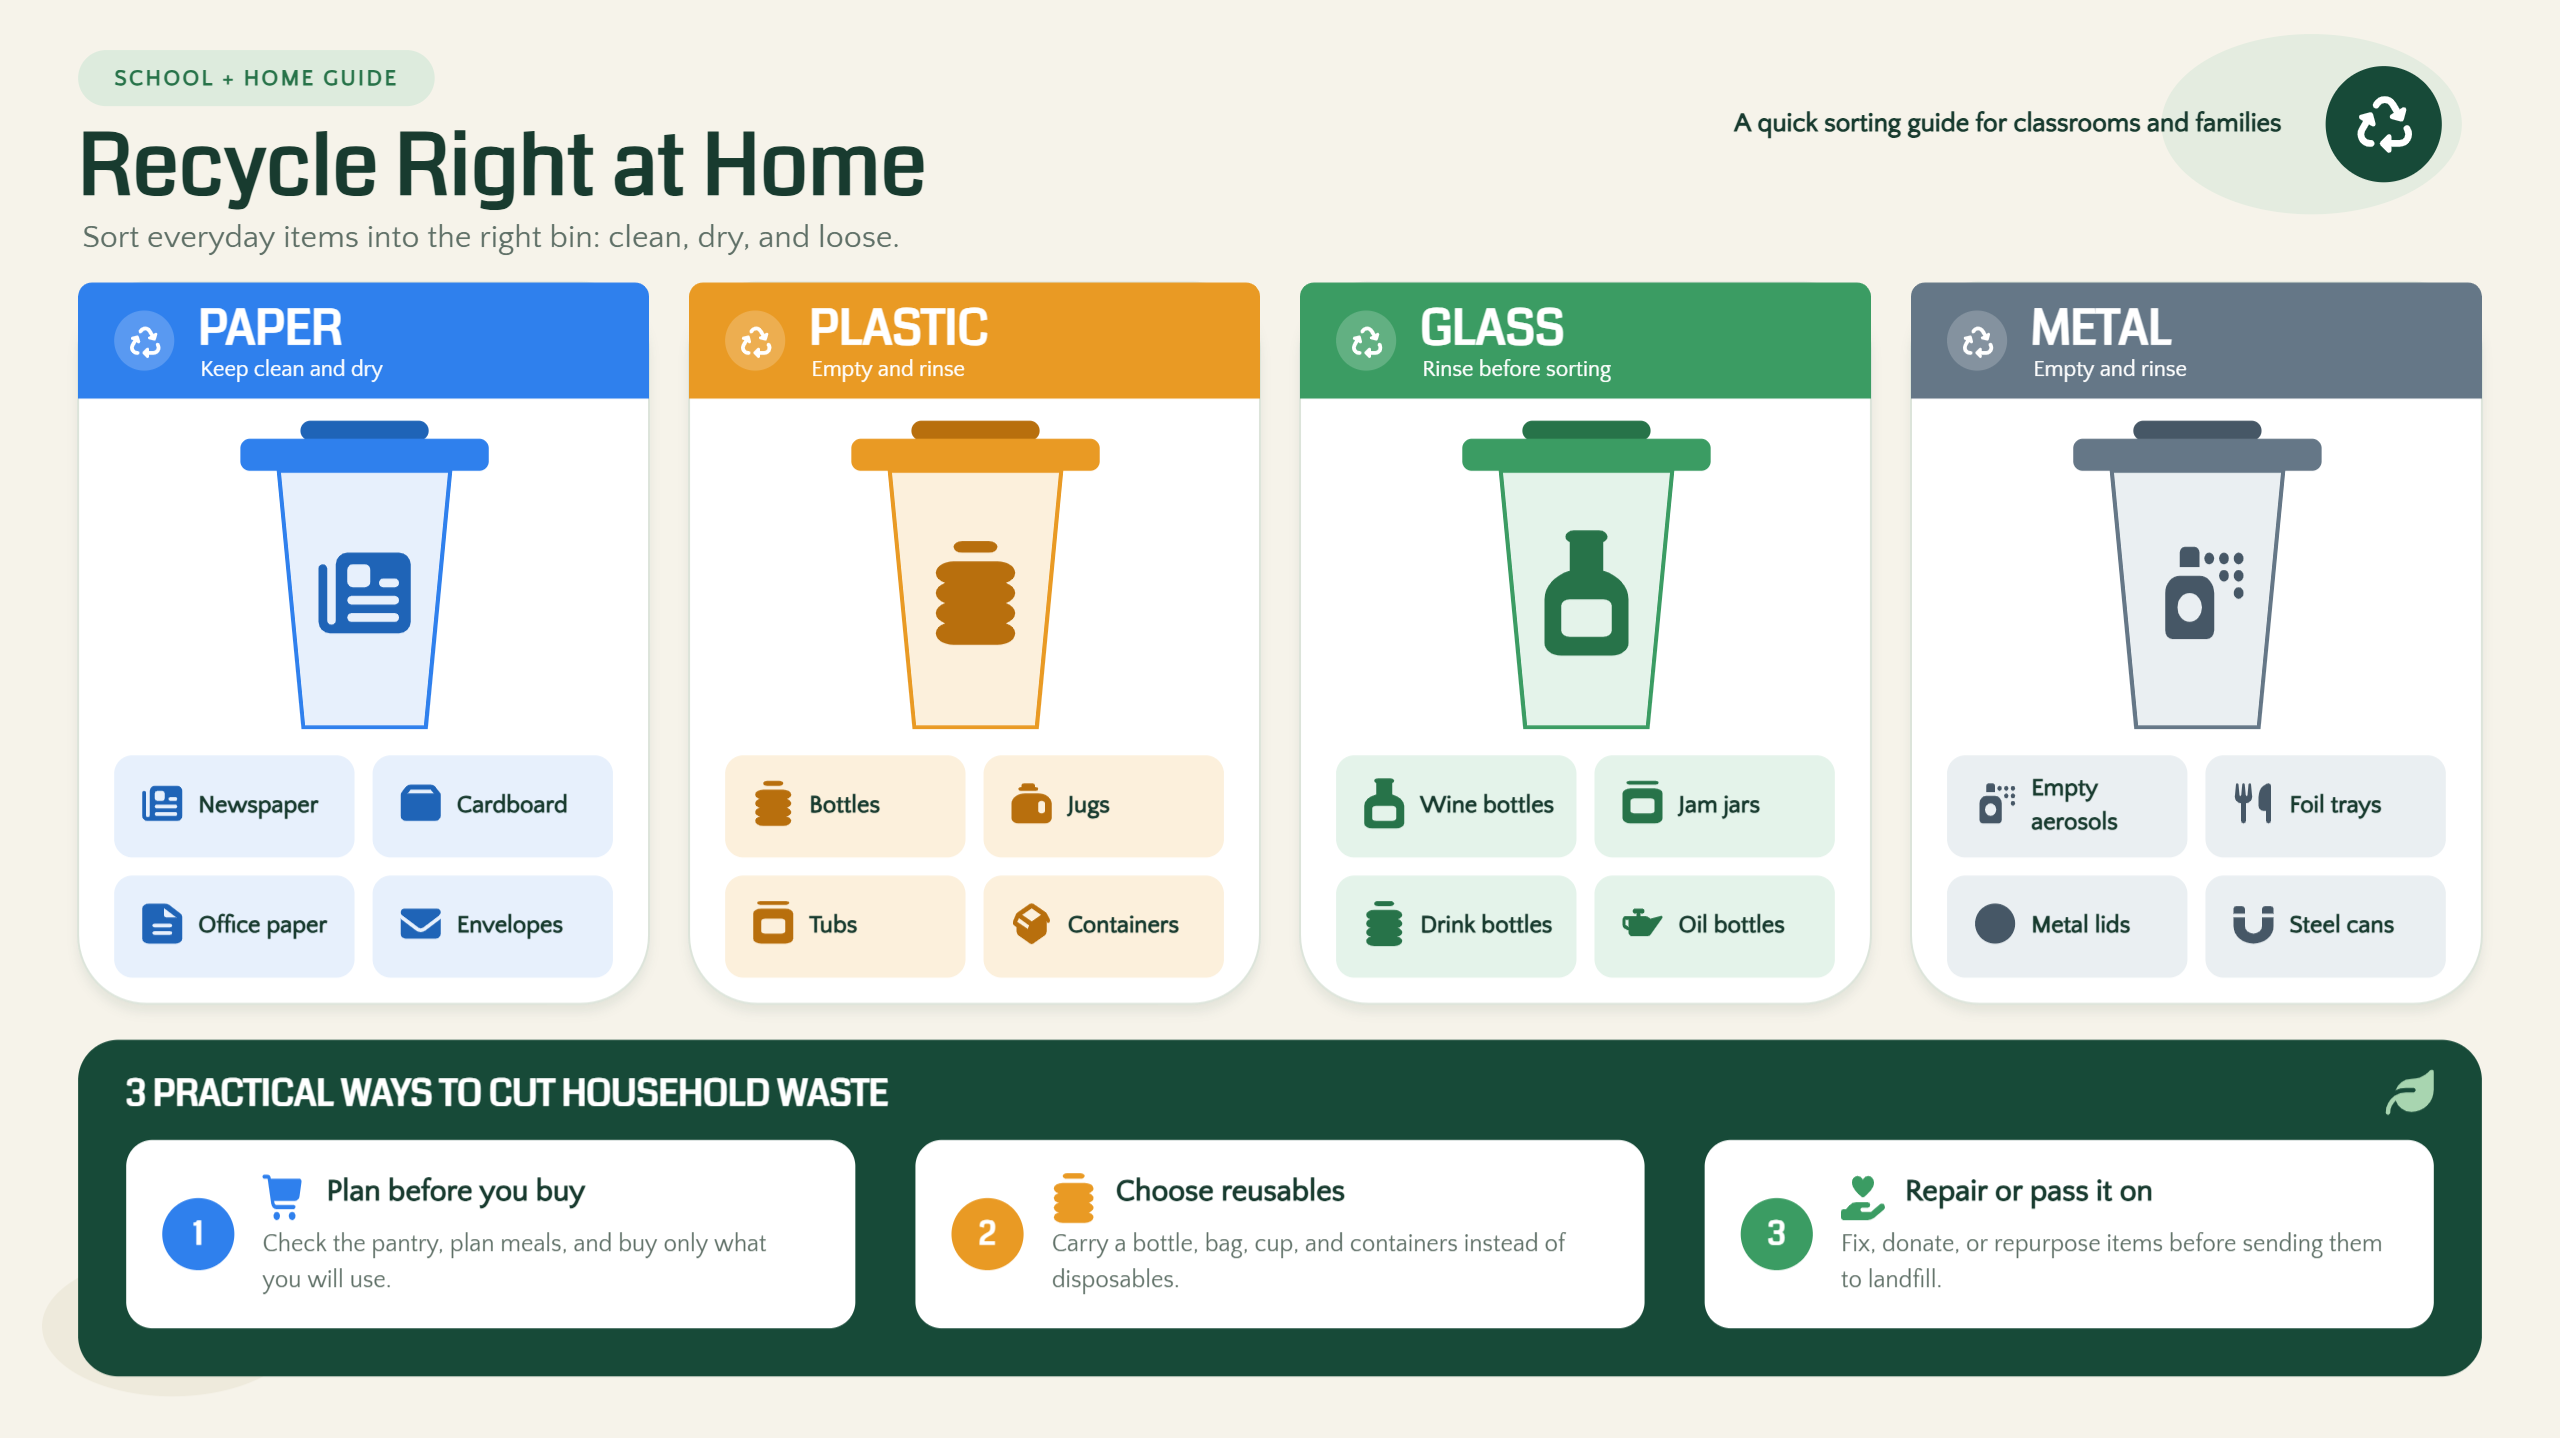
Prompt:
College application infographic
A college application infographic organizes admission steps, deadlines, and document requirements into an easy-to-follow visual guide. High school students can use it to explore college application requirements, prepare supporting materials, and plan ahead for upcoming admission cycles. College applicants can also refer to it when tracking submission deadlines, organizing application documents, and keeping up with important tasks throughout the admission process.
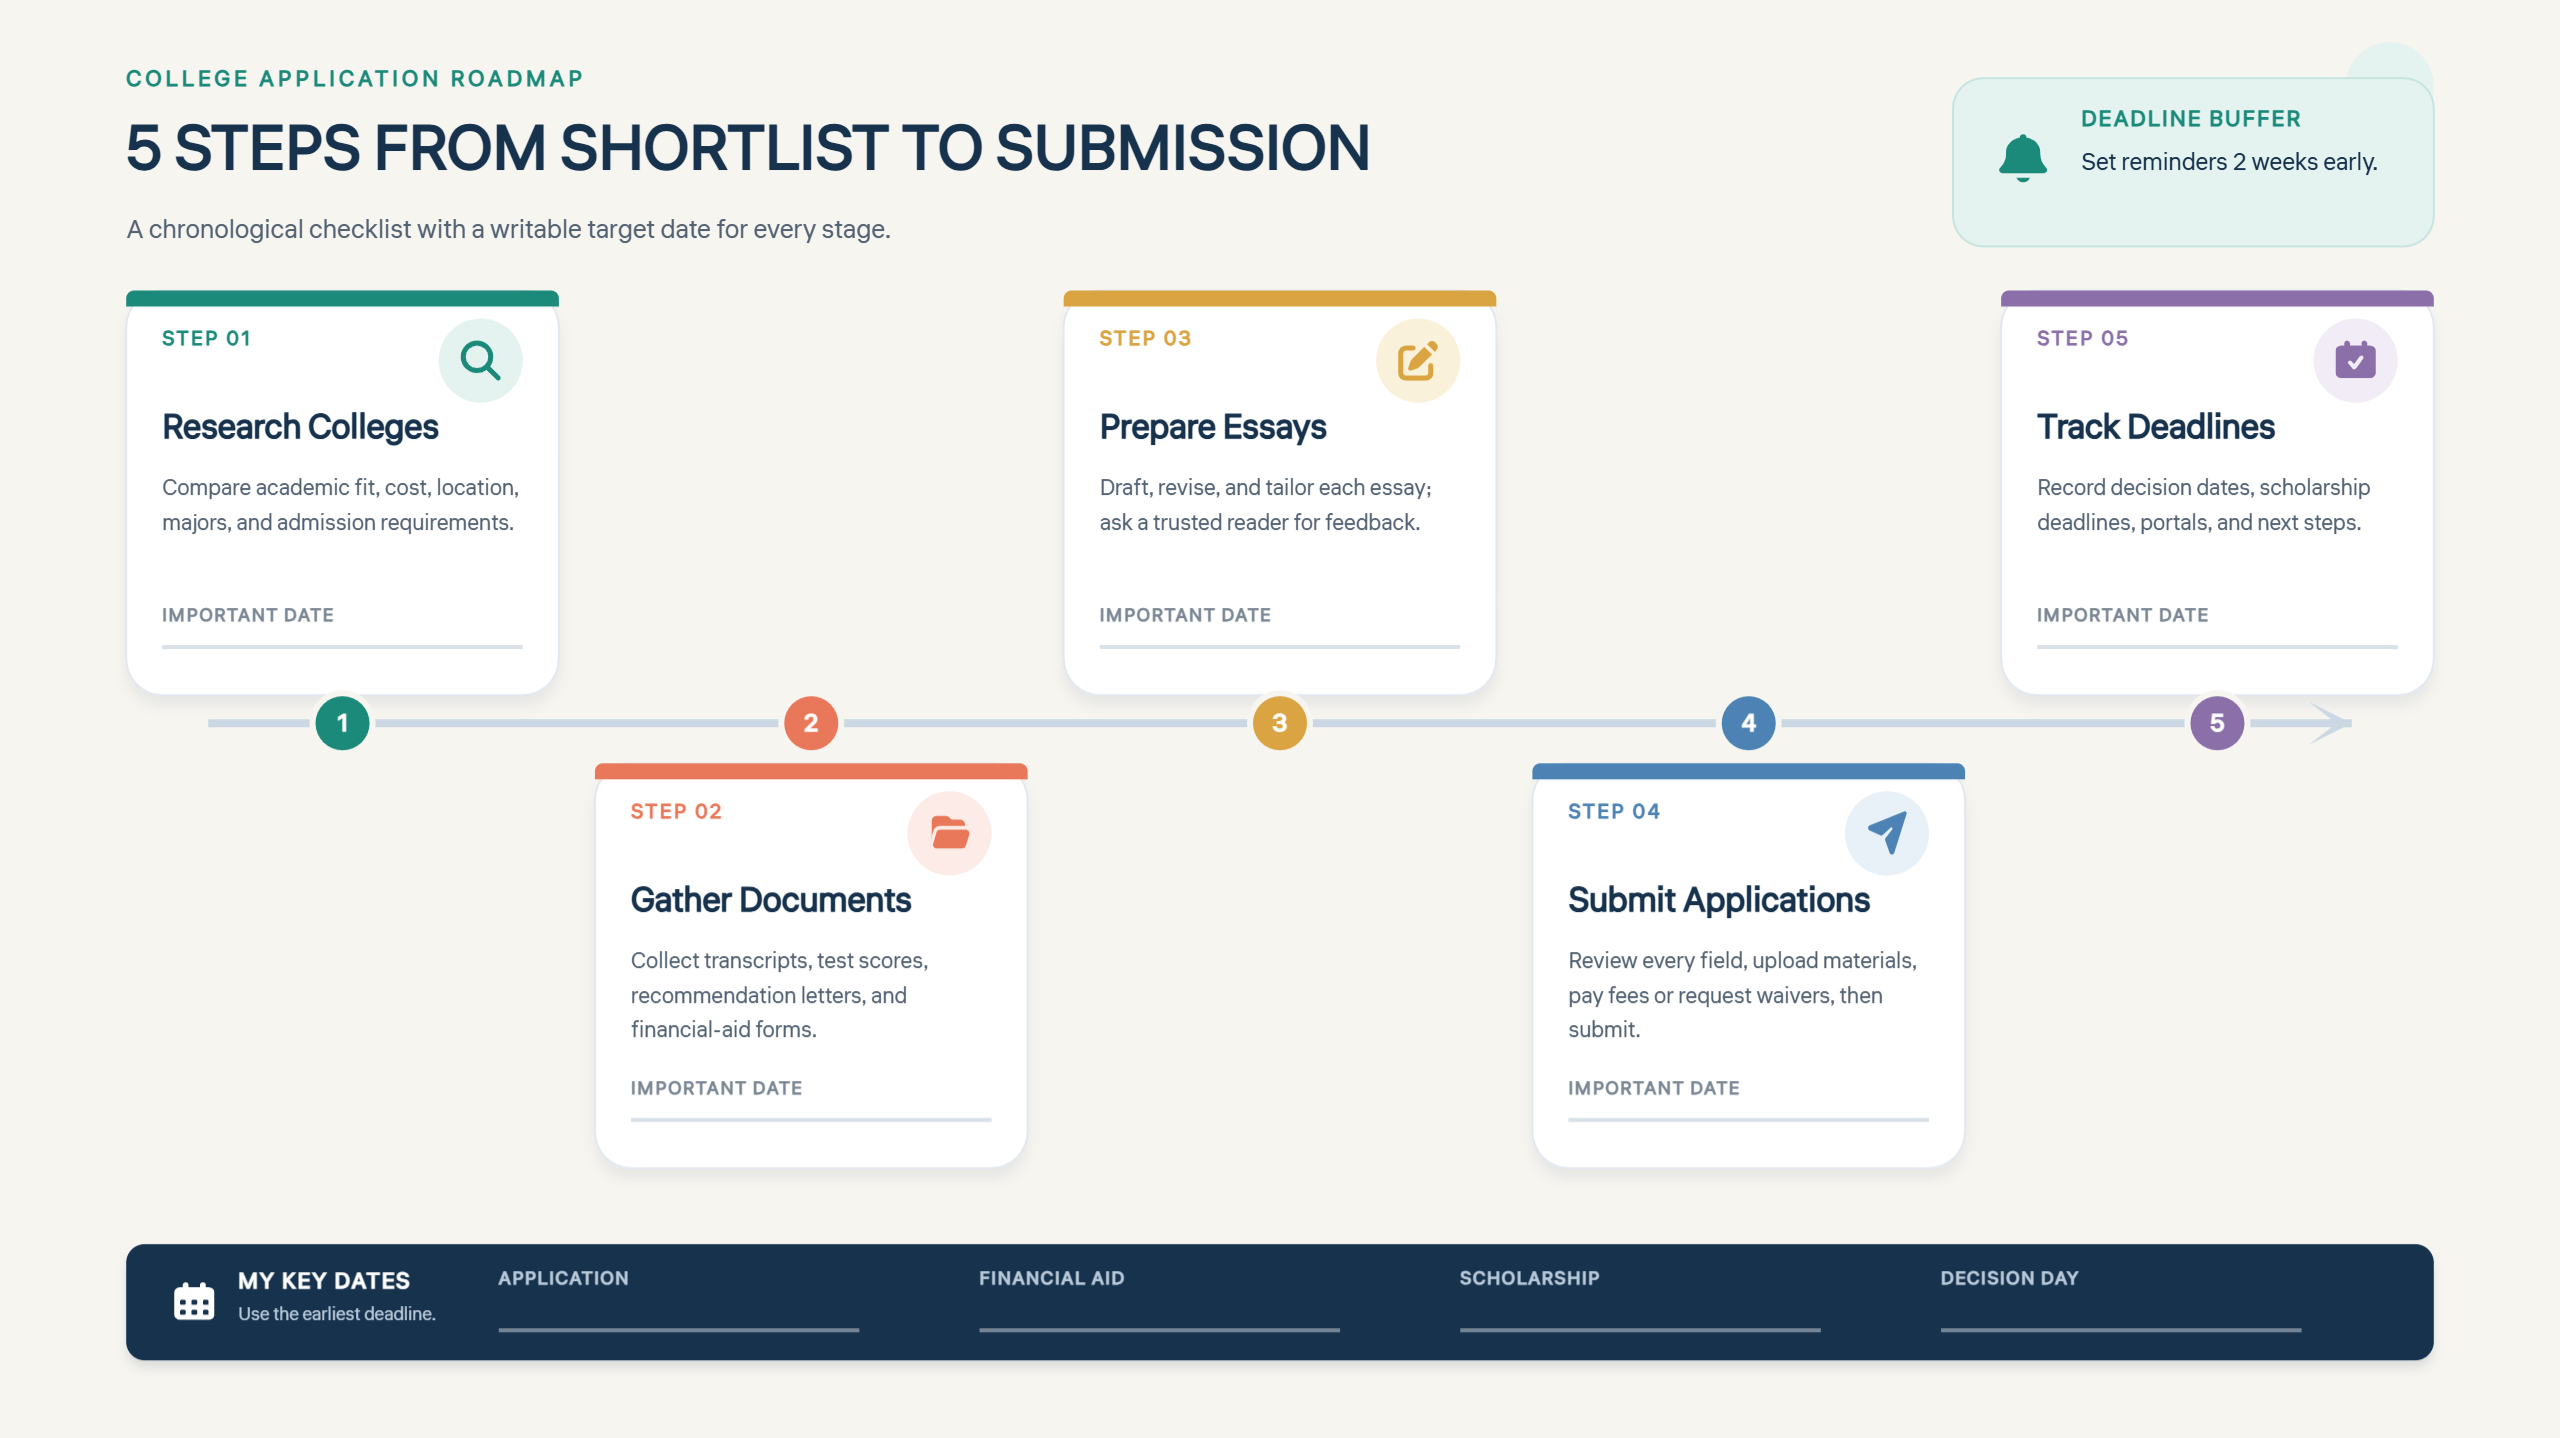
Prompt:
Why use Kimi Design for education infographics
Kimi Design offers tools for turning educational and academic content into clear, engaging infographics. Whether presenting lesson concepts, summarizing research findings, or explaining complex topics, users can organize information, customize visual elements, and refine designs to suit different academic purposes.
Build educational visuals with prompts and source materials
Describe a lesson topic, learning objective, or key concept in a text prompt, or upload study materials, documents, and reference images. Kimi Design helps turn educational content into a structured infographic with clear headings, visual elements, and an easy-to-follow layout.
Visualize complex concepts for different subjects
Create educational infographics for science lessons, history timelines, geography topics, language learning, and classroom projects. Use diagrams, illustrations, icons, and color-coded sections to explain ideas and make key information easier to understand.
Customize educational visuals with flexible editing tools
Refine explanations, labels, colors, layouts, and illustrations using natural-language prompts. Kimi Design also supports comments on specific elements and manual editing, so you can adjust details to suit different age groups, learning goals, and teaching styles.
Export educational infographics for learning and teaching
Export your finished designs in supported formats such as PNG, JPG, PDF, or PPTX. Teachers can use them to explain concepts in class, while students can include them in presentations, organize study notes, and review key information for exams.
What makes educational infographics engaging
A good educational infographic does more than look attractive. It presents information in a way students can understand and remember. Effective educational infographics combine clear text, relevant visuals, and an organized layout to make lessons easier to follow. Here are the key elements that make these designs more useful for learning.
Clear visuals that simplify hard topics
Students often understand a concept faster when they can see how it works. Diagrams, charts, and labeled drawings explain relationships between ideas, show important details, and make lessons easier to understand without relying on long descriptions.
Bright colors that grab attention
A thoughtful choice of colors helps students tell sections apart and notice key facts. For example, different shades can represent stages in a process or distinguish categories in a chart. Keeping the colors consistent also helps the page feel organized.
Short text that students read quickly
Each section should explain one main point using familiar words and direct sentences. Definitions, brief examples, and key facts give students enough information to understand the topic without filling the page with lengthy paragraphs.
Logical flow that guides the eye
The order of information affects how well students follow a lesson. Numbered steps suit instructions, timelines show changes over time, and comparison layouts highlight similarities and differences. A clear structure helps learners understand how each point fits into the bigger picture.
Icons and illustrations that aid memory
Relevant images help explain terms that may be unfamiliar to students. An arrow can show movement, a symbol can identify a category, and a labeled illustration can name specific parts. Choosing visuals that match the content makes the infographic more useful as a learning aid.
Real examples that connect to daily life
Students can better understand new ideas when they see how those ideas apply outside school. Shopping discounts can explain percentages, daily routines can illustrate time management, and household recycling can teach waste sorting. Such examples give abstract information a clear purpose.
Interactive elements that spark curiosity
Questions, mini-quizzes, and clickable details encourage learners to think about the information rather than simply read it. Teachers can add a short review question to check understanding, while digital infographics may include links to extra explanations or learning activities.
Conclusion
Choosing the right education infographic template depends on the lesson's purpose, the age of your learners, and the information you want to communicate. Kimi Design helps bring these elements together to make it easier to prepare educational materials for lessons, revision, and classroom activities. Start with a clear learning goal and create a design that serves it.